Aroon Pivots Beta 2.0THIS IS A BETA AND ONLY TO BE USED FOR TESTING PURPOSES
Upgraded Beta Version of the Aroon Pivots Beta.
PLEASE READ BELOW OF THE USAGE OF PIVOTS
Whats new in 2.0?
- Updated to a new Script: This is for two reasons (1) there have been some overall changed to the weaker signals to make then stronger and felt it was changed enough to differentiate and be able for beta testers to compare side by side, and (2) some users have had issues using the script and getting an error, which this hopefully fixes.
- Improved accuracy for the "weak" signals
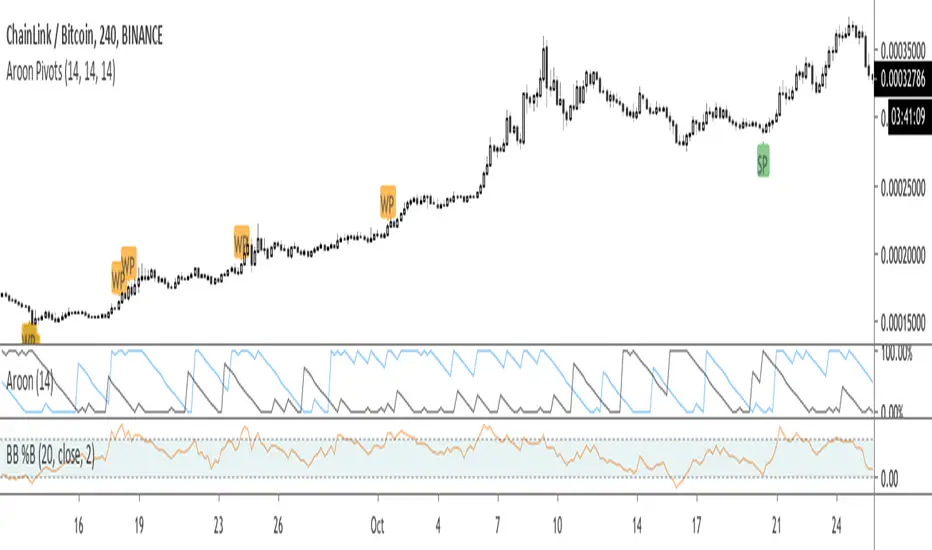
- Color coded "strong" and "week signals and now renamed to set them apart as "SP" and "WP" respectively.
- Added confluence to signals to help improve all timeframes.
This script is the beta version of the Aroon Pivots for testing purposes and is not intended to be used in real trading.
========= AROON PIVOTS =========
The purpose of this script is to use the power of the Aroon Lines to determine when trends or portions of a trend have reached a certain level of exhaustion, which in turn can help discover pivot points or reversals. Aroon Lines (the Up and Down lines) are measures of time that compare previous highs and lows, as well as opens and closes, which when compared can give insight on a possible incoming trading move. Aroon is one of the few indications that was designed for this purpose to show possible moves instead of historic data.
========= HOW TO USE =========
It's fairly simple, but small labels are created that show when entry or exit is at its closing peak. Labels can be used to enter as a maximum opportunity in addition to minimal risk, while simultaneously can be used to close an already open position for maximum closing results.
========= ADDITIONAL NOTES =======
- Labels are printed when the criteria is met, however, the labels are not fully realized until candle close.
- Labels are not repainted.
- Labels are specific to their relative timeframe, so its expected that a lower timeframe pivot will not expand into a high timeframe label, especially is the labels are giving opposite pivots .
Search in scripts for "pivot"
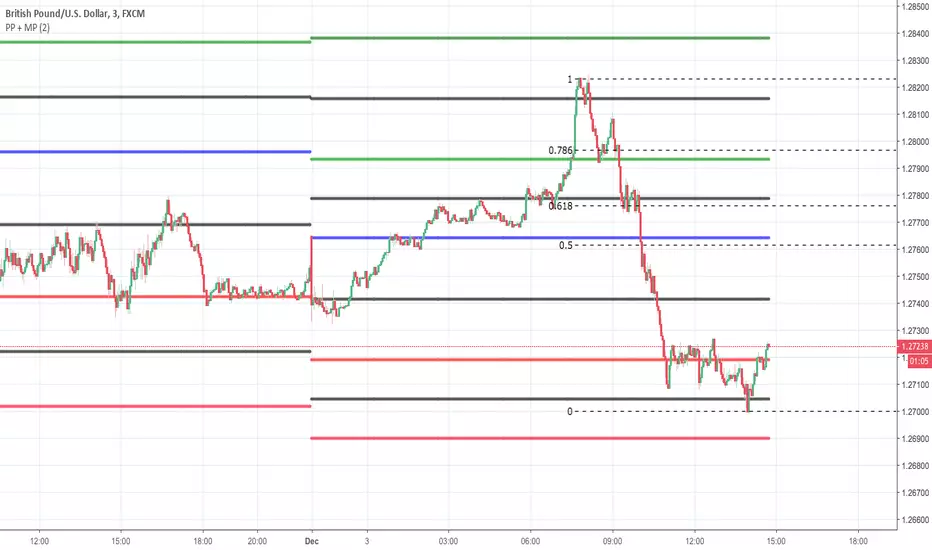
Pivot Point + MidPointsTraditional floor pivots with additional lines in between the s/r levels called Mid Points
If the Pivot Points are used as entering at s/r levels, you can use the Mid Points to scale out of a position or place Sl's behind
DMA: Pivot Point + Medians
Опорная точка (Pivot Point) – это уровень цены изменения направления рынка в конкретный день.
Зная уровни максимума, минимума и закрытия предыдущей сессии, и произведя простые арифметические действия, мы получим значения уровней поддержки и сопротивления.
Отличие этого метода анализа в том, что он помогает составить картину о направлении движения рынка на следующий день. Т.е. это очень удобный инструмент для торговли внутри дня, для интрадея.
Зная уровни закрытия, максимума, минимума дня сегодняшнего – можно рассчитать разворотные точки на день завтрашний.
Ввиду популярности данной теории, рынок часто реагирует на эти уровни.
Данный индикатор рассчитывает не только основные уровни Pivot Point (Floor), но и так называемые средние, медианы.
Формула расчета медиан:
Median0 = (S3 + S2)/2
Median1 = (S2 + S1)/2
Median2 = (S1 + Pivot)/2
Median3 = (PivotPoint + R1)/2
Median4 = (R1 + R2)/2
Median5 = (R2 + R3)/2
Alto Basso Swing Pivots + Barry Support Resistance Levels2 indicators, 1 script: swing pivots and Barry support resistance levels
Alto
high swing pivot
Basso
low swing pivot
Dal Segno
lookback period length for swing pivots
Barry Length
length for support resistance calculation
--------------------------------------------------------------------------------------------------------------------------------------------------------------------------------------------
Use swing pivots for confirmation of new structure levels on short term
Barry support resistance levels in proximity to standard pivots or Fibonacci levels may indicate greater strength
credit to BacktestRookies and likebike
stay ♯
Example: Dal Segno 13, Barry Length 21

VWAP From Pivots Lows and Highs
This script starts automatically VWAP from pivot lows and highs.
Parameter allows you to enable up to 3 VWAP (default).
If you use 3, the VWAP from the last three pivots point will be drawn.
If you use 1, just the last pivot point will be used.
You can also just enable VWAPs starting from pivot lows or highs.
Let me know if there are any problems.

Pivot Triangles High/Low (anchored)“It is used to detect price action pivots. You can choose the number of candles before a pivot is marked. It is useful for identifying trends.”

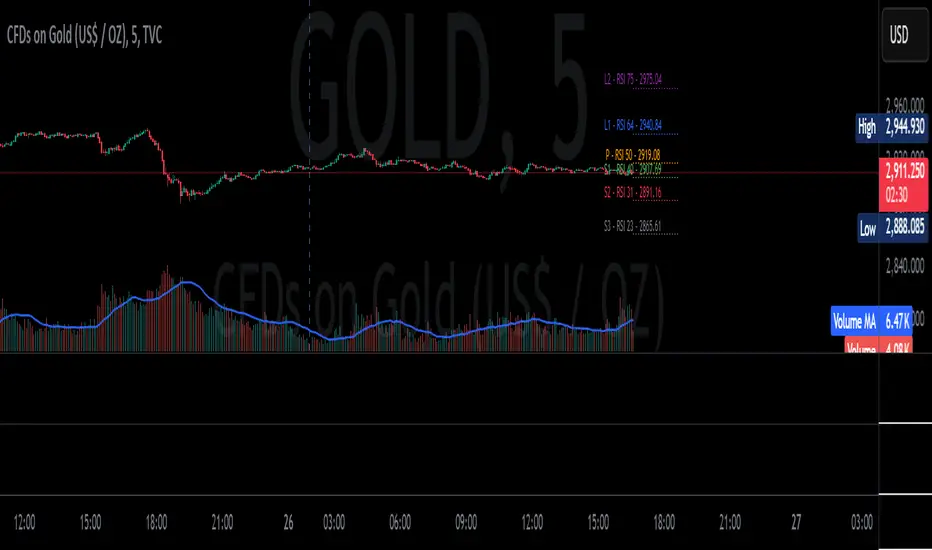
RSI Targeted Pivots"Targeted RSI Pivots" is an innovative indicator designed to assist traders in identifying potential price targets based on user-defined RSI levels. Unlike traditional RSI indicators, this script calculates and projects pivot levels (L3, L2, L1, P, S1, S2, S3) using a unique algorithm that integrates RSI data from a selectable timeframe. Traders can customize RSI targets, toggle individual levels, and adjust visual settings to suit their analysis needs—all overlaid directly on the price chart for seamless integration into their workflow.
This script stands out by offering a novel approach to RSI-based analysis, combining multi-timeframe RSI calculations with dynamic price projections. It empowers traders with actionable insights into potential support and resistance zones, enhancing decision-making in various market conditions.
The source code is kept closed to protect the proprietary methodology behind the pivot calculations and to safeguard the intellectual property developed through extensive research and testing. By publishing it as a protected script in the Public Library, I aim to share this valuable tool with the TradingView community while preserving the uniqueness of its design. This ensures that traders can benefit from its functionality without compromising the innovative logic that drives it.
[DarkTrader] Pivot Point HeatmapThe indicator calculates pivot points using price data from different timeframes such as 12M, 1M, 1W, 3D, and 1D. For each timeframe, it retrieves the high, low, open, and close prices of the previous bar. The pivot point is calculated as the average of the high, low, and close prices, which provides a central level where market sentiment may shift. This calculation is repeated for each timeframe, ensuring a multi-dimensional view of potential interest zones.
Importance of Pivot Points :
Pivot points are essential tools in technical analysis, providing traders with levels that act as potential support and resistance zones. These zones help identify price levels where reversals or breakouts are more likely to occur.
Visual Representation :
The core feature of this indicator is its ability to visualize pivot points as a heatmap on the chart. Instead of showing just the latest pivot points, it tracks the historical pivot swipe, providing a dynamic view of how price interacts with these key levels. Each pivot point is represented by a line, color-coded based on its position relative to other points, creating a gradient effect that highlights the most critical price areas.
Customization Options :
Traders can customize various aspects of the heatmap to suit their preferences. The indicator offers options to toggle pivot swipe history, enabling traders to either focus on the most recent price interactions or consider how price has behaved over time. The background color and pivot line colors are fully customizable, making it easy to match the heatmap with your chart's theme or emphasize certain price levels.
Detecting Sweeps and Price Interaction :
Another important feature is the detection of price interactions with pivot levels. If the current bar's high and low cross a pivot point, it signals that the pivot level has been "swept" by price action, potentially indicating a change in market sentiment. The indicator either extends the line if the pivot point remains relevant or deletes it if price has broken through. This dynamic adjustment helps traders stay updated on which pivot levels are still valid.

Simple Pivot Points with dots, not lines(manual setup)1. Why Pivot Point is popular?
Because unlike most indicators, it's not lagging! It is forward-looking, it's real-time, it's just right there.
2. Why this script is created?
I don't like many indicator lines crossing my screen everywhere, just as some Pivot Point indicators did. So I wrote this script to keep my screen as clean/neat as possible.
3. MUST READ before you add this “manual setup” version to your chart
I'm a E-mini S&P500 future trader, and I found the close prices on Daily chart is different from the ones on lower timeframe occasionally.
So I asked some TradingView staff and the reply was:
The closing price of a daily bar on TradingView is based on a Settle price from the exchange. The exchanges, at times, send this value before the close of the trading day, which leads to the situation when the price for daily-based resolutions does not change after receiving this Settle value, while the price changes still occur at smaller resolutions, since the construction of intraday bars is based on the actual trades produced.
So, in order to use the most accurate price,
I replace the D(representing the Daily timeframe) with 1440(representing 1440 minutes) in the script, making the daily Pivot Points more accurate.
The default Pivot Points are from daly timeframe.
You have to set the "last week/month close" in the "script settings" MANUALLY to ensure the weekly/monthly Pivot Point is the most accurate.
4. What if you don't want to go through the hassle of setting it up manually?
If the tickers you trade doesn't have the occasional problems as mentioned before, you can search the "Simple Pivot Points with dots, not lines(automatic setup)" version which uses the default close prices on each timeframe.
--------
If you want the dots stay a little further from your bars, you can adjust the "offset" parameter in the code. The larger the number is, the further the dot stays.
Fibonacci Extension / Retracement / Pivot Points by DGTFɪʙᴏɴᴀᴄᴄɪ Exᴛᴇɴᴛɪᴏɴ / Rᴇᴛʀᴀᴄᴍᴇɴᴛ / Pɪᴠᴏᴛ Pᴏɪɴᴛꜱ
This study combines various Fibonacci concepts into one, and some basic volume and volatility indications
█ Pɪᴠᴏᴛ Pᴏɪɴᴛꜱ — is a technical indicator that is used to determine the levels at which price may face support or resistance. The Pivot Points indicator consists of a pivot point (PP) level and several support (S) and resistance (R) levels. PP, resistance and support values are calculated in different ways, depending on the type of the indicator, this study implements Fibonacci Pivot Points
The indicator resolution is set by the input of the Pivot Points TF (Timeframe). If the Pivot Points TF is set to AUTO (the default value), then the increased resolution is determined by the following algorithm:
for intraday resolutions up to and including 5 min, 4HOURS (4H) is used
for intraday resolutions more than 5 min and up to and including 45 min, DAY (1D) is used
for intraday resolutions more than 45 min and up to and including 4 hour, WEEK (1W) is used
for daily resolutions MONTH is used (1M)
for weekly resolutions, 3-MONTH (3M) is used
for monthly resolutions, 12-MONTH (12M) is used
If the Pivot Points TF is set to User Defined, users may choose any higher timeframe of their preference
█ Fɪʙ Rᴇᴛʀᴀᴄᴇᴍᴇɴᴛ — Fibonacci retracements is a popular instrument used by technical analysts to determine support and resistance areas. In technical analysis, this tool is created by taking two extreme points (usually a peak and a trough) on the chart and dividing the vertical distance by the key Fibonacci coefficients equal to 23.6%, 38.2%, 50%, 61.8%, and 100%. This study implements an automated method of identifying the pivot lows/highs and automatically draws horizontal lines that are used to determine possible support and resistance levels
█ Fɪʙᴏɴᴀᴄᴄɪ Exᴛᴇɴꜱɪᴏɴꜱ — Fibonacci extensions are a tool that traders can use to establish profit targets or estimate how far a price may travel AFTER a retracement/pullback is finished. Extension levels are also possible areas where the price may reverse. This study implements an automated method of identifying the pivot lows/highs and automatically draws horizontal lines that are used to determine possible support and resistance levels.
IMPORTANT NOTE: Fibonacci extensions option may require to do further adjustment of the study parameters for proper usage. Extensions are aimed to be used when a trend is present and they aim to measure how far a price may travel AFTER a retracement/pullback. I will strongly suggest users of this study to check the education post for further details, where to use extensions and where to use retracements
Important input options for both Fibonacci Extensions and Retracements
Deviation, is a multiplier that affects how much the price should deviate from the previous pivot in order for the bar to become a new pivot. Increasing its value is one way to get higher timeframe Fib Retracement Levels
Depth, affects the minimum number of bars that will be taken into account when building
█ Volume / Volatility Add-Ons
High Volatile Bar Indication
Volume Spike Bar Indication
Volume Weighted Colored Bars
This study benefits from build-in auto fib retracement tv study and modifications applied to get extentions and also to fit this combo
Disclaimer:
Trading success is all about following your trading strategy and the indicators should fit within your trading strategy, and not to be traded upon solely
The script is for informational and educational purposes only. Use of the script does not constitute professional and/or financial advice. You alone have the sole responsibility of evaluating the script output and risks associated with the use of the script. In exchange for using the script, you agree not to hold dgtrd TradingView user liable for any possible claim for damages arising from any decision you make based on use of the script

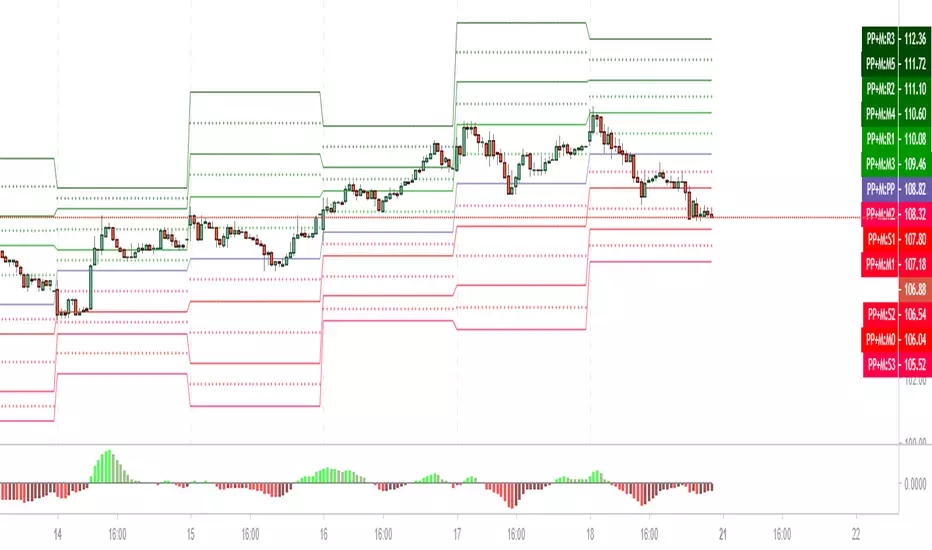
Weekly Pivot Points with Colored Mid Pivots from HalcyonUpdated version of the Weekly Pivots Points that include mid pivot lines.
Target trading zones for the week are shaded green and red respectively. The mid pivot area is shaded aqua.
Use: buy (green) zones are buys, red zones are sells with respective color targets.

Pivot Ranges AlertsThis script calculates the ranges of pivots and shows alerts when they are touched.
Requested by Jonathan - (jthurrott)

sma-pivotsThis model is based on this script
I change it to sma model . the model run on pivots high or low that are base on SMA
I make two SMA one for high pivots and one for low pivots ( I put for now at same distance but you need to change it according to needs)
because asset can be in bull period or bear period when we have two separate distance of SMA we can find the correct combination if to buy more or less by changing either the sma pivot of the low end or the sma pivots of the high end using the length . also global we can use the lookbar of bar numbers
one sma to both pivots is bad as it not consider the market situation but separation to two one for sell and one for buy can give you a better flexible model for enter or exit
so its your job to find what length is best suited for exit and what for enter .
example when we have two different length how it work on 4 hour


Standard Deviation W/Q/M PivotsThis is a re-iteration of the standard deviation of daily pivots with the pivots applied on weekly, monthly, quarterly and yearly levels. For intraday traders the weekly pivot points will act as a major support resistance levels. Quarterly and monthly pivot points are useful for short-term positions while the yearly pivot determines the stock's long term support-resistance levels and useful in determining if the stock is in a bullish/bearish leg.
Peso Pros Pivotes de FantasmasThis indicator automatically prints important pivot point levels for you on the chart for a variety of time frames such as 8 hour, Daily, Weekly and Monthly.
Look for pivot points that have been created on the screen but not hit yet as trend continuation confirmations within the first 1-2 days after they are generated. After 2-5 days these same pivot points if not hit yet will act as magnets with price returning to them.
Combine this with the other strategies and trading methods taught in the Peso Pros course and you are on your way to some massive gains with some nice swing trade setups.
Enjoy :)

Pivot Zones Trading RangesJust testing an advanced Pivot Zones display method with 12 different time frame options. Invite only.

Rounded Weekly Pivot (by ChartArt)Trade with the trend. This is an overlay indicator which shows the weekly pivot (rounded) either as line or circle drawing, select-able by the user. The width of the pivot line (or circle) overlay is also adjustable.
In addition the bars can be colored by the trend, depending if the close price is above or below both the weekly and monthly pivots. If the close price is neither above or below both the weekly and monthly pivot prices the trend color is neutral blue.
The weekly pivot indicator with the optional setting that the pivot price is drawn as circles instead of a line:
And here with the pivot drawing disabled, showing only the pivot bar trend color

Structure Pivot (LL-HL / HH-LH)Structure Pivot (LL-HL / HH-LH) - Indicator Guide
This indicator scans for market structure pivot patterns—specifically the bullish Higher Low (LL–HL) and the bearish Lower High (HH–LH) —across multiple lengths simultaneously.
It automatically selects the most optimal pattern based on a "Priority Mode" and plots the structure and breakout/breakdown levels on the chart.
1. Basic Calculation Method
The indicator builds upon TradingView’s ta.pivotlow and ta.pivothigh functions to identify structural points.
Bullish Structure (LL–HL)
1.LL (Lowest Low): A standard Pivot Low is identified.
2.HL (Higher Low): A subsequent Pivot Low forms higher than the previous LL. This completes the setup.
3.Pivot Line (Resistance): The indicator finds the highest price (High) that occurred between the LL and the HL. This level becomes the breakout trigger.
Bearish Structure (HH–LH)
1.HH (Highest High): A standard Pivot High is identified.
2.LH (Lower High): A subsequent Pivot High forms lower than the previous HH. This completes the setup.
3.Pivot Line (Support): The indicator finds the lowest price (Low) that occurred between the HH and the LH. This level becomes the breakdown trigger.
2. Multi-Length Scanning
Unlike standard indicators that use a single fixed length (e.g., Length = 5), this indicator scans a range of lengths simultaneously.
・Settings: Defined by Min Length and Max Length.
・Mechanism: If set to Min=2 and Max=10, the indicator internally runs 9 separate calculations (Length 2 through 10) in parallel.
This allows it to capture everything from small, short-term pullbacks to larger, significant structural pivots without manual adjustment.
3. Priority Mode System
Since multiple lengths are scanned, multiple valid patterns may appear at the same time. The Priority Mode determines which single pattern is the "winner" and gets displayed.
A. Tightest Structure (Default)
・For Bullish (Long): Selects the pattern with the lowest Pivot Line (Resistance).
・For Bearish (Short): Selects the pattern with the highest Pivot Line (Support).
・Advantage: It finds the "tightest" contraction (like a VCP). This offers the entry point closest to the stop-loss level, providing the best Risk/Reward ratio.
B. Longest Length
・Selects the pattern detected by the longest length setting.
・Advantage: Focuses on major structural points, filtering out short-term noise. Best for trend confirmation.
C. Shortest Length
・Selects the pattern detected by the shortest length setting.
・Advantage: Extremely sensitive. Best for scalping or catching immediate micro-pullbacks.
4. Real-Time Logic & Features
Structure Invalidation (Failure)
・Bullish: If the current price drops below the HL (the support of the structure), the setup is considered failed.
・Bearish: If the current price rises above the LH (the resistance of the structure), the setup is considered failed.
・Result: All lines and labels for that structure are immediately deleted to keep the chart clean.
Pivot Line Extension
・As long as the structure remains valid (price hasn't violated the HL or LH), the Pivot Line extends to the right, acting as a live reference for breakouts or breakdowns.
Alerts
・Bullish Breakout: Triggered when the Close price crosses over the Pivot Line.
・Bearish Breakdown: Triggered when the Close price crosses under the Pivot Line.

Tomorrow's Pivot Points [SMH]這個TradingView指標不同於內置的Pivot Point指標,因為它能夠提前顯示明天的Pivot Point。透過預測下一交易日的支撐與阻力位置,交易員可以更早部署策略,為隔日的市場波動做好準備。
This TradingView indicator is different from the built-in Pivot Point tool because it can display tomorrow’s Pivot Points in advance. By forecasting support and resistance levels for the next trading day, traders can position their strategies earlier and be well-prepared for upcoming market movements.

Bardhi's ICT Killzone & PivotsThis indicator is a complete ICT-style session and liquidity toolkit designed for precision trading. It automatically marks the most important trading windows (“Killzones”) and provides powerful tools for tracking price action around them.
Key Features:
Killzones: Automatically plots Asia, London, and New York (AM, Lunch, PM) sessions with customizable colors, transparency, and labels.
Session Highs, Lows & Midpoints: Dynamic lines for killzone highs/lows, optional midpoints, and alerts when levels are broken.
Range Statistics: Displays the real-time range of each session plus rolling averages in a customizable table.
Day / Week / Month Levels: Plots opens, highs, lows, and separators for higher-timeframe reference points with optional alerts.
Custom Opening Prices: Define up to 8 custom open lines (e.g., True Day Open, 06:00, 10:00) with cutoff times.
Vertical Timestamp Lines: Highlight important intraday times such as news events or personal strategy triggers.
Day-of-Week Labels: Clean labels for each day, with the option to hide weekends.
Full Customization: Adjustable label sizes, colors, line styles, transparency, and drawing limits.
Why Use It?
This tool combines killzone sessions, pivots, higher-timeframe opens/highs/lows, and range statistics into one clean, automated package. It saves time drawing manually, keeps charts organized, and helps traders apply ICT concepts consistently.

Hourly Strong Pivot RaysThis indicator projects strong hourly pivots consistent with institutional order flow. Pivots plotted are based on previous 21 days of price action.

Pivot Points with MID LevelsThis indicator shows the Standard Pivot Points level based on daily values that can act as support and resistance. It is used by a variety of traders around the world. You can select which time frame Pivot Point Levels you'd like. Daily, weekly etc... Perfect for swing trading or day trading.
Pivot Points- Shows 3 levels of resistance, the Pivot Point and 3 levels of support
(R3, R2, R1, PIVOT POINT, S1, S2, S3
MID Levels- The MID levels are 50% retracement from the pivot point level above it and below
Example- R3, MID, R2, MID, R1, MID, PIVOT POINT, MID, S1, MID, S2, MID, S3
With this indicator you will also have the option to show the Previous days High and Low that are also important levels. On gap up/down days it is always interesting to see if price will close the gap, hence the important level to note.
PDH= Previous Days High
PDL= Previous Days Low
I have added a feature that you can now select specific color to each level and the line style for each level to help understand which levels are being show by personal needs.
Happy Trading
