MarketProfile HLMarketProfile HL dynamically calculates and displays a side histogram of the distribution of volumes with colors along a gradient, which is set to a given number of candles. The histogram is overlaid on the candlesticks to visually represent areas of market balance and imbalance. The indicator uses the concepts of statistical distribution and is based on the market profile theory.
The gradient color of the levels shows where more or less horizontal volume accumulates.
Adapts to any timeframe or instrument.
Customizable display of horizontal levels HL and POC.
The HL and POC levels protrude beyond the boundaries of the main histogram on the right for a more convenient determination of dynamic centers and accumulation boundaries.
-------------------------------------------
MarketProfile HL динамически рассчитывает и отображает боковую гистограмму распределения объемов с цветами по градиенту, которая настроена на заданное количество свечей. Гистограмма накладывается на свечи, чтобы визуально представить области рыночного баланса и дисбаланса. Индикатор использует концепции статистического распределения и основан на теории профиля рынка.
Градиентный цвет уровней показывает, где накапливается больше или меньше горизонтального объема.
Адаптируется к любому таймфрейму или инструменту.
Настраиваемое отображение горизонтальных уровней HL и POC.
Уровни HL и POC выступают за границы основной гистограммы справа для более удобного определения динамических центров и границ накоплений.
Search in scripts for "poc"

Heisenberg's Uncertainty BandsHeisenberg's Uncertainty Bands:
This is a volatility indicator to determine and visualize the uncertainty in a securities' price.
In quantum mechanics, the uncertainty principle (also known as Heisenberg's uncertainty principle) is any of a variety of mathematical inequalities asserting a fundamental limit to the accuracy with which the values for certain pairs of physical quantities of a particle, such as position, x, and momentum, p, can be predicted from initial conditions.
It plots a Kalman filter average of the bars inside a higher timeframe bar, to attempt to find the most frequent price in that bar's timespan. To plot what is effectively a MA using POC (IvanLabrie's code, credits to the author).
It derives momentum from relative momentum, yielding results more sensitive to changes.
Then it uses Heisenberg's uncertainty principle to find an uncertainty range, and uses it as the channel distance from the POC MA, meaning price is likely to fluctuate within that range.
Since uncertainty must be greater than h/2, adding fib levels will make it a useful indicator. Essentially they are pseudo-Fibonacci Bollinger Bands, which uses a different calculation.
Benefits:
Prices fluctuate, and it can be helpful to visualize price as a range, rather than a single point or line. This visualization can help in managing risk, determining entries and exits, and prevent losing one's position due to price fluctuations during a trend.
If we use a particle model, the uncertainty principle dictates that it is impossible to predict the price within a range. This is a good model for risk management!
Usage:
There are 5 Fibonacci ratio outer bands that can be turned on or off according to user's preference.
Recommended that the length inputs should be increased in higher timeframes, to visualize trends, shorter timeframes should have lower lengths.
GLHF
- DPT

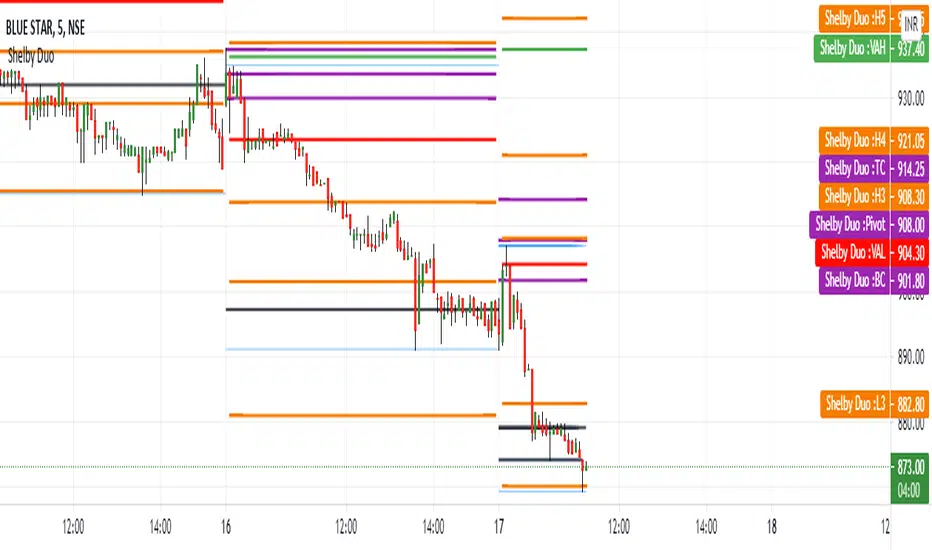
Shelby Duo Shelby Duo indicator is a combination of the following:
1. Central Pivot Range
2. Floor Pivots
3. Camarilla Pivots
4. Volume Point Of Contact
5. Value Area High and Value Area Low
All the pivot calculations are based on Secret of Pivot Boss book by Frank Ochoa .
One can also view tomorrow's central pivot range by today end of the day.
How to use it:
The Golden Pivot Zone is the method given by Frank Ochoa in his book "The Secret of Pivot Boss"
Here, he discusses its types and how to use them efficiently.
There are two types of GPZ,
1.) BEARISH GPZ
2.) BULLISH GPZ
BEARISH GPZ:
A bearish GPZ occurs when H3 of the Camarilla Equation, or any of the Money Zone levels, is mixed within the central pivot range. Therefore, a GPZ is present if any of the following pivots falls within the boundaries of the central pivot range:H3, VAL, VAH, POC, or VPOC. Any bullish advance that fails at the GPZ typically leads to a drop back toward the next area of pivot support, which is generally S1 or L3.
BULLISH GPZ:
A bullish GPZ occurs when L3 of the Camarilla Equation, or any of the Money Zone levels, is mixed within the central pivot range. Therefore, a GPZ is present if any of the following pivots falls within the boundaries of the central pivot range: L3, VAL, VAH, POC, or VPOC. A sell-off or pullback to a bullish GPZ generally leads to an advance back toward the next area of pivot resistance, which is usually R1 or H3.
Entry and Exit Conditions:
BEARISH GPZ: Entry can be taken when it touches the zone. Exit can be done when the price reaches PDL/L3.
BULLISH GPZ: Entry can be taken when it touches the zone. Exit can be done when the price reaches PDH/H3.
Enhanced Sigma by Cryptorhythms [CR] - AdvancedEnhanced Sigma - Advanced Volatility-Normalized Returns Analysis
The Enhanced Sigma indicator measures volatility-adjusted price returns to identify statistical extremes, regime changes, and mean reversion opportunities. By normalizing returns against their standard deviation, the indicator reveals when markets are experiencing unusual moves relative to recent volatility—highlighting potential exhaustion points, capitulation events, and statistical anomalies.
█ OVERVIEW
Sigma (σ) represents how many standard deviations current returns deviate from normal behavior. Readings beyond ±2.0 indicate statistically unusual moves, while extreme readings beyond ±3.0 occur less than 1% of the time under normal distribution. This version adds multi-layered analysis including regime detection, multi-timeframe confirmation, and adaptive thresholds.
█ KEY FEATURES
Return Calculation Methods
The indicator supports multiple return calculation approaches:
- Simple Returns — Standard percentage change calculation
- Log Returns — Logarithmic returns for better statistical properties
- Geometric Returns — Square root based calculation
- Percentage Returns — Scaled percentage format
Volume Weighting
Optional volume weighting emphasizes high-volume moves while dampening low-volume noise. When enabled, returns are weighted by normalized volume to give more significance to moves occurring on institutional participation.
Threshold Methods
Two threshold calculation approaches:
- Fixed Thresholds — Manual static levels
- Percentile-Based — Adaptive thresholds calculated from historical distribution
Percentile-based thresholds automatically adjust to changing volatility regimes over configurable lookback periods.
Statistical Significance Testing
Built-in t-test functionality determines whether current sigma readings are statistically significant or merely random noise. Configurable confidence levels (80-99.9%) filter out insignificant moves. Non-significant readings are visually dimmed.
Multi-Timeframe Analysis
Analyzes sigma across multiple timeframes simultaneously. Confluence signals trigger when all timeframes (current, 3x, 5x) align at extremes—indicating stronger conviction and reduced false signals. MTF sigma values are plotted as reference lines.
Regime Detection
Automatically classifies current volatility environment into four regimes:
- Low Volatility — Market in compression
- Normal — Standard volatility conditions
- High Volatility — Elevated movement
- Extreme — Unusual volatility expansion
Regime classification uses percentile ranking and statistical deviation analysis.
Adaptive Threshold System
Three methods for automatic threshold adjustment:
- ATR-Based — Adjusts based on Average True Range ratio
- Volatility Regime — Tightens in low volatility, widens in high volatility
- Range Expansion — Responds to recent sigma range changes
When enabled, thresholds dynamically scale with market conditions to maintain consistent sensitivity.
Cluster Analysis
Detects and scores clusters of threshold breaches within rolling windows. High cluster scores can indicate capitulation or exhaustion phases. Visual labels "C" show active clusters.
Mean Reversion Signals
Generates entry and exit signals based on extreme sigma readings returning to mean:
- Long Entry — Triggered on oversold extremes
- Short Entry — Triggered on overbought extremes
- Exit Signals — When sigma normalizes or time-based exit reached (marked as gray "X")
Optional statistical significance filter ensures only high-probability setups generate signals. Position tracking displays unrealized P&L.
Distribution Histogram
Displays sigma value distribution as a horizontal histogram showing Point of Control (POC)—the most frequently occurring sigma level. Configurable bin size and lookback period.
Statistics Dashboard
Real-time table displaying:
- Current sigma value and percentile rank
- Statistical measures (mean, std dev, skewness, kurtosis)
- Volatility regime classification
- Extreme event frequency
- Bars since last extreme
- Position status and P&L (when mean reversion enabled)
█ VISUAL ELEMENTS
Threshold Lines
- Aqua/Cyan lines — Positive (high) thresholds
- Fuchsia/Magenta lines — Negative (low) thresholds
- Solid lines — Short-term dynamic thresholds
- Circles — Long-term dynamic thresholds
- Crosses — Percentile-based static thresholds (when enabled)
Sigma Histogram
Primary histogram uses momentum-based coloring:
- Purple shades — Negative sigma (declining)
- Cyan shades — Positive sigma (advancing)
- Darker shades indicate weakening momentum
- Brighter shades indicate strengthening momentum
Statistically significant threshold breaches are highlighted with intensified colors.
Shape Markers
- Small triangles — Statistically significant threshold breaches
- Diamonds — Multi-timeframe confluence signals
- Large triangles with text — Mean reversion entry signals (LONG/SHORT)
- X markers — Mean reversion exit signals
- Labels — Cluster detection alerts
█ ALERTS
The indicator includes comprehensive alert conditions. Use confirm on bar close if repainting is enabled.
█ HOW TO USE
Identifying Extremes
Sigma readings beyond ±2.0 indicate unusual moves. Look for:
- Threshold breaches with statistical significance markers (triangles)
- Multi-timeframe confluence (diamonds) for stronger signals
- Cluster formation indicating potential exhaustion
Regime-Aware Trading
Use regime detection to adjust expectations:
- In Low Volatility regimes, smaller sigma moves may be significant
- In Extreme regimes, higher thresholds prevent overtrading
Mean Reversion Strategy
Enable mean reversion signals for systematic entries:
- LONG signals appear after statistically significant oversold extremes
- SHORT signals appear after statistically significant overbought extremes
- Exit signals trigger on return to mean or time-based stops
Distribution Analysis
Use the histogram to identify:
- POC level — Where sigma spends most time (equilibrium)
- Current position relative to distribution

Dynasty Position Pickup by Tirano안녕하세요. 다이너스티 팀의 안드레아 입니다.
기존에 티라노라는 이름으로 활동했습니다.
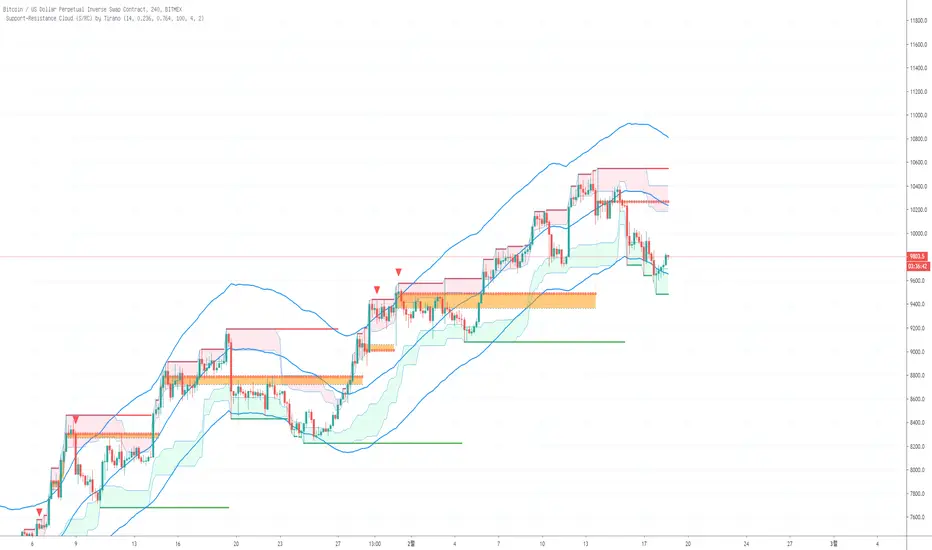
Support-Resistance Cloud 소개
1. 한번이라도 지지 혹은 저항이 작용한 구간을 라인으로 표현합니다. 한번 맞고 튕긴 구간은 되돌림을 통한 리테스트가 있기 마련이고, 다시한번 튕길 가능성이 높습니다.
- 따라서 되돌림이 일어났을때 선으로 표현되는 구간에서 진입하면 수익으로 연계할 확률이 높습니다.
- 매물대를 표현한 PoC 라인이 보조적으로 사용됩니다. (피보나치 상으로 의미있는 구간에 표현됩니다)
- 박스권 상황에 유리합니다.
2. 전체적인 흐름을 구름과 채널의 형태로 표현합니다.
- 구름이 서서히 내려오며 하방 추세라면 매수신호에서 long으로 진입하기 보다는, 구름에 닿았을때 short으로 진입하는게 좋습니다.
- 전체적인 흐름(추세)를 거스르지 않고 매매할 수 있습니다.
- 한 방향으로 진행되는 one way 상황에 유리합니다.
기타 문의 사항은 댓글 남겨주시면 감사하겠습니다.
Hi. this is Andreas of the Dynasty team.
Introduction to Support-Resistance Cloud
1. The lines where the support or resistance acts once are expressed by lines. Once hit and bounced, there is a retest through bounce, and it is likely to bounce again.
- Therefore, if you enter from the section represented by the line when the recurrence occurs, the probability of linking with the profit is high.
- The PoC line representing the residential area is supplementary. (Expressed in Fibonacci sensible section)
- It is advantageous in the box case situation.
2. Express the overall flow in the form of clouds and channels.
- If the cloud is going down slowly, it is better to go into the short when touching the cloud, rather than going into long in the buy signal.
- You can trade without overtaking the whole flow (trend).
- It is advantageous for one way situation that goes in one direction.
If you have any other questions, please leave a comment.

Support-Resistance Cloud (S/RC) [Alert] by Tirano안녕하세요. 다이너스티 팀의 안드레아 입니다.
기존에 티라노라는 이름으로 활동했습니다.
Support-Resistance Cloud 소개
1. 한번이라도 지지 혹은 저항이 작용한 구간을 라인으로 표현합니다. 한번 맞고 튕긴 구간은 되돌림을 통한 리테스트가 있기 마련이고, 다시한번 튕길 가능성이 높습니다.
- 따라서 되돌림이 일어났을때 선으로 표현되는 구간에서 진입하면 수익으로 연계할 확률이 높습니다.
- 매물대를 표현한 PoC 라인이 보조적으로 사용됩니다. (피보나치 상으로 의미있는 구간에 표현됩니다)
- 박스권 상황에 유리합니다.
2. 전체적인 흐름을 구름과 채널의 형태로 표현합니다.
- 구름이 서서히 내려오며 하방 추세라면 매수신호에서 long으로 진입하기 보다는, 구름에 닿았을때 short으로 진입하는게 좋습니다.
- 전체적인 흐름(추세)를 거스르지 않고 매매할 수 있습니다.
- 한 방향으로 진행되는 one way 상황에 유리합니다.
기타 문의 사항은 댓글 남겨주시면 감사하겠습니다.
Hi. this is Andreas of the Dynasty team.
Introduction to Support-Resistance Cloud
1. The lines where the support or resistance acts once are expressed by lines. Once hit and bounced, there is a retest through bounce, and it is likely to bounce again.
- Therefore, if you enter from the section represented by the line when the recurrence occurs, the probability of linking with the profit is high.
- The PoC line representing the residential area is supplementary. (Expressed in Fibonacci sensible section)
- It is advantageous in the box case situation.
2. Express the overall flow in the form of clouds and channels.
- If the cloud is going down slowly, it is better to go into the short when touching the cloud, rather than going into long in the buy signal.
- You can trade without overtaking the whole flow (trend).
- It is advantageous for one way situation that goes in one direction.
If you have any other questions, please leave a comment.
Support-Resistance Cloud (S/RC) for FX by Tirano안녕하세요. 다이너스티 팀의 안드레아 입니다.
기존에 티라노라는 이름으로 활동했습니다.
Support-Resistance Cloud 소개
1. 한번이라도 지지 혹은 저항이 작용한 구간을 라인으로 표현합니다. 한번 맞고 튕긴 구간은 되돌림을 통한 리테스트가 있기 마련이고, 다시한번 튕길 가능성이 높습니다.
- 따라서 되돌림이 일어났을때 선으로 표현되는 구간에서 진입하면 수익으로 연계할 확률이 높습니다.
- 매물대를 표현한 PoC 라인이 보조적으로 사용됩니다. (피보나치 상으로 의미있는 구간에 표현됩니다)
- 박스권 상황에 유리합니다.
2. 전체적인 흐름을 구름과 채널의 형태로 표현합니다.
- 구름이 서서히 내려오며 하방 추세라면 매수신호에서 long으로 진입하기 보다는, 구름에 닿았을때 short으로 진입하는게 좋습니다.
- 전체적인 흐름(추세)를 거스르지 않고 매매할 수 있습니다.
- 한 방향으로 진행되는 one way 상황에 유리합니다.
기타 문의 사항은 댓글 남겨주시면 감사하겠습니다.
Hi. this is Andreas of the Dynasty team.
Introduction to Support-Resistance Cloud
1. The lines where the support or resistance acts once are expressed by lines. Once hit and bounced, there is a retest through bounce, and it is likely to bounce again.
- Therefore, if you enter from the section represented by the line when the recurrence occurs, the probability of linking with the profit is high.
- The PoC line representing the residential area is supplementary. (Expressed in Fibonacci sensible section)
- It is advantageous in the box case situation.
2. Express the overall flow in the form of clouds and channels.
- If the cloud is going down slowly, it is better to go into the short when touching the cloud, rather than going into long in the buy signal.
- You can trade without overtaking the whole flow (trend).
- It is advantageous for one way situation that goes in one direction.
If you have any other questions, please leave a comment.

Bitmex StopHunter by Tirano안녕하세요. 다이너스티 팀의 안드레아 입니다.
기존에 티라노라는 이름으로 활동했습니다
Bitmex StopHunter 소개
흔히 세력이라고 표현하는 큰손들은 쉽게 개미의 뜻대로 움직여 주지 않습니다.
소위 개미털기 라고 하는 행위를 반복하며 가격을 흔드는 행동을 합니다.
본 지표는 15분 캔들에서 거래가 많이 이루어진 PoC 매물대를 기준으로 해당 포지션의 청산가를 표현했습니다.
누군가의 스탑로스가 나의 엔트리가 될 수도 있습니다.
기타 문의사항은 댓글 남겨주시면 감사하겠습니다.
Hi. this is Andreas of the Dynasty team.
Introduction to Bitmex StopHunter
Big hands, often referred to as forces, do not move easily as ants do.
I repeat the act of so-called ant shine and act to shake the price.
This index represents the clearing price of the position in the 15-minute candle, based on the large number of traded PoC units.
Someone's stop-loss may be my entry.
If you have any other questions, please leave a comment.

Support-Resistance Cloud (S/RC) by Tirano안녕하세요. 다이너스티 팀의 안드레아 입니다.
기존에 티라노라는 이름으로 활동했습니다.
Support-Resistance Cloud 소개
1. 한번이라도 지지 혹은 저항이 작용한 구간을 라인으로 표현합니다. 한번 맞고 튕긴 구간은 되돌림을 통한 리테스트가 있기 마련이고, 다시한번 튕길 가능성이 높습니다.
- 따라서 되돌림이 일어났을때 선으로 표현되는 구간에서 진입하면 수익으로 연계할 확률이 높습니다.
- 매물대를 표현한 PoC 라인이 보조적으로 사용됩니다. (피보나치 상으로 의미있는 구간에 표현됩니다)
- 박스권 상황에 유리합니다.
2. 전체적인 흐름을 구름과 채널의 형태로 표현합니다.
- 구름이 서서히 내려오며 하방 추세라면 매수신호에서 long으로 진입하기 보다는, 구름에 닿았을때 short으로 진입하는게 좋습니다.
- 전체적인 흐름(추세)를 거스르지 않고 매매할 수 있습니다.
- 한 방향으로 진행되는 one way 상황에 유리합니다.
기타 문의 사항은 댓글 남겨주시면 감사하겠습니다.
Hi. this is Andreas of the Dynasty team.
Introduction to Support-Resistance Cloud
1. The lines where the support or resistance acts once are expressed by lines. Once hit and bounced, there is a retest through bounce, and it is likely to bounce again.
- Therefore, if you enter from the section represented by the line when the recurrence occurs, the probability of linking with the profit is high.
- The PoC line representing the residential area is supplementary. (Expressed in Fibonacci sensible section)
- It is advantageous in the box case situation.
2. Express the overall flow in the form of clouds and channels.
- If the cloud is going down slowly, it is better to go into the short when touching the cloud, rather than going into long in the buy signal.
- You can trade without overtaking the whole flow (trend).
- It is advantageous for one way situation that goes in one direction.
If you have any other questions, please leave a comment.

[RS]Market ProfileEXPERIMENTAL: this script is very crude and prone to errors..
Request for: FibTrader
instead of a POC line theres a POC area instead, since the script is checking a price area range for the frequency, its possible to average the values but this works as well.
KIMATIX FVG/IFVG/BPRProfessional Fair Value Gap & Imbalance Toolkit
The KIMATIX FVG/IFVG/BPR indicator is a precision tool designed to identify institutional inefficiencies in price:
Fair Value Gaps (FVG), Inverse Fair Value Gaps (IFVG) and Balanced Price Ranges (BPR) — clean, minimal and non-repainting.
This indicator is built for scalpers, intraday traders and smart-money traders who want to trade where price is most likely to react, not where indicators lag.
What this indicator shows
Fair Value Gaps (FVG)
Detects bullish and bearish FVGs using strict 3-candle imbalance logic
Highlights areas where price moved too fast, leaving inefficient structure
Ideal for:
Continuation trades
Pullback entries
Reaction zones after impulse moves
Color-coded
🟢 Bullish FVG
🔴 Bearish FVG
Inverse Fair Value Gaps (IFVG)
Automatically detects when an FVG is invalidated
Marks the same zone as an Inverse FVG
Extremely useful for:
Failed structure setups
Reversal trades
Stop-hunt & liquidity traps
Color-coded
🟡 IFVG (invalidation zone)
Balanced Price Range (BPR)
Detects overlapping bullish & bearish FVGs
Highlights price areas where buying and selling pressure are balanced
These zones often act as:
High-probability reaction areas
Compression zones before expansion
Premium intraday decision levels
Color-coded
🔵 BPR (balanced price range)
Smart, Clean & Non-Repainting
Non-repainting
Only the last 3 active zones are shown → no clutter
Boxes extend forward with a manual cap (user-controlled)
Designed for 1m – 15m execution, works on all markets
Futures, Crypto, FX, Indices, Stocks
How professionals use it
Combine FVGs with:
VWAP
Session highs/lows
Volume Profile (POC / VAH / VAL)
Market structure (BOS / displacement)
Use IFVGs to spot failed smart-money narratives
Use BPRs as decision zones, not blind entries
This indicator does not give buy/sell signals.
It shows you where trades make sense — execution is up to you.
Best use cases
Scalping (1m–3m)
Intraday trading (5m–15m)
Smart-money concepts
Liquidity-based trading
News reactions & stop runs
Learn how to trade it properly
This indicator is part of the KIMATIX Trading Framework.
More education, live examples & full system:
kimatixtrading.com

SNIPER ORB V3# 🎯 SNIPER ORB TRADING CHEAT SHEET
## Quick Reference Guide for Live Trading
---
## 📊 VISUAL IDENTIFICATION GUIDE
```
═══════════════════════════════════════════════════════════════════
YOUR CHART AT A GLANCE
═══════════════════════════════════════════════════════════════════
🔵 BRIGHT BLUE LINES (3px) → 5min ORB High/Low
🔷 CYAN LINES (2px) → 15min ORB High/Low
🟣 PURPLE LINES (2px) → 30min ORB High/Low (PRIMARY)
🟢 GREEN DASHED LINES (1px) → Upside targets (1x, 2x, 3x from 30min ORB)
🔴 RED DASHED LINES (1px) → Downside targets (1x, 2x, 3x from 30min ORB)
🟡 GOLD LINE (2px) → Anchored VWAP (9:30 AM anchor for NY, 3:00 AM for London)
📋 INFO TABLE (top-right) → Shows live ORB ranges, VWAP price, status
═══════════════════════════════════════════════════════════════════
```
**KEY DIFFERENCE FROM OTHER ORB INDICATORS:**
- You see **ALL 3 ORB PERIODS SIMULTANEOUSLY** (5min, 15min, 30min)
- Targets calculated from **30min ORB ONLY** (not 5min or 15min)
- **NO BOX FILLS** - clean line-only display for sniper precision
- Auto-disappears at session end (no clutter from old sessions)
---
## 🔘 NEW FEATURE: ORB DISPLAY TOGGLES
**You now have FULL CONTROL over which ORB periods to display!**
```
In indicator settings → "ORB Display" section:
☑ Show 5min ORB → Toggle blue lines ON/OFF
☑ Show 15min ORB → Toggle cyan lines ON/OFF
☑ Show 30min ORB → Toggle purple lines ON/OFF
USE CASES:
━━━━━━━━━━━━━━━━━━━━━━━━━━━━━━━━━━━━━━━━━━━━━━━
1. FOCUS MODE (30min only)
☐ 5min ☐ 15min ☑ 30min
→ Clean chart, just your primary trading range
→ Best for beginners or minimalist traders
2. EARLY WARNING MODE (5min + 30min)
☑ 5min ☐ 15min ☑ 30min
→ See early breaks with 5min, trade 30min confirmation
→ Reduces visual noise from 15min
3. CONFLUENCE MODE (all 3 ORBs)
☑ 5min ☑ 15min ☑ 30min
→ Maximum information, all alignment signals
→ For advanced traders seeking highest probability
4. INTRADAY SCALP MODE (5min only)
☑ 5min ☐ 15min ☐ 30min
→ Ultra-fast entries on 5min breaks
→ High-risk, high-frequency approach
━━━━━━━━━━━━━━━━━━━━━━━━━━━━━━━━━━━━━━━━━━━━━━━
💡 PRO TIP: Start with 30min only, then add 5min/15min as you gain experience
```
---
## 🎯 FIXED: ANCHORED VWAP (TIMESTAMP-BASED)
**The VWAP now anchors with SURGICAL PRECISION to the exact session start candle!**
```
LONDON SESSION:
• Anchors at the EXACT 3:00 AM ET candle
• Uses timestamp checking: hour == 3 AND minute == 0
• Resets every morning at London Open
NEW YORK SESSION:
• Anchors at the EXACT 9:30 AM ET candle
• Uses timestamp checking: hour == 9 AND minute == 30
• Resets every day at NY Open
WHAT THIS MEANS:
✅ VWAP starts accumulating from the first tick of the session
✅ No more "off by one bar" errors
✅ Institutional-grade VWAP anchoring
✅ Perfect alignment with your ORB start times
HOW TO VERIFY IT'S WORKING:
1. Load indicator on 1min or 5min chart
2. Find the exact 9:30 AM candle (NY) or 3:00 AM candle (London)
3. VWAP should START appearing from that exact bar
4. Not the bar before, not the bar after - THAT EXACT BAR
```
---
## ⏰ SESSION TIMING MATRIX
| Session | Start Time | 5min Complete | 15min Complete | 30min Complete | Session End |
|---------|-----------|---------------|----------------|----------------|-------------|
| **London** | 3:00 AM ET | 3:05 AM | 3:15 AM | 3:30 AM | 9:30 AM ET (disappears) |
| **New York** | 9:30 AM ET | 9:35 AM | 9:45 AM | 10:00 AM | 5:00 PM ET (disappears) |
**💡 GOLDEN RULES:**
1. **WAIT FOR 30MIN ORB TO COMPLETE** before trading targets (10:00 AM NY / 3:30 AM London)
2. Use 5min and 15min ORBs as **early warning signals** only
3. All ORB lines + VWAP **auto-delete** at session end (clean chart)
---
## 🎯 THE 3-ORB SYSTEM: HOW IT WORKS
### **Hierarchical ORB Structure**
```
TIME: 9:30 AM ─────────────────────────────────> 10:00 AM ──────> 5:00 PM
↓ ↓
SESSION START 30min ORB COMPLETE
(all 3 ORBs begin forming) (targets appear)
📍 5min ORB (9:30-9:35 AM): ━━━━━━━━━━━━━━━━━━━━━━━━━━━━━━━━━━━━━>
Purpose: EARLY breakout signal, fastest-moving boundary
📍 15min ORB (9:30-9:45 AM): ━━━━━━━━━━━━━━━━━━━━━━━━━━━━━━━━━━━━━>
Purpose: MID-TERM institutional reference level
📍 30min ORB (9:30-10:00 AM): ━━━━━━━━━━━━━━━━━━━━━━━━━━━━━━━━━━━━━>
Purpose: PRIMARY TRADING RANGE - all targets calculated from this
🎯 TARGETS (10:00 AM onward): ▪ ▪ ▪ ▪ ▪ (1x, 2x, 3x from 30min ORB)
Purpose: Profit-taking levels based on 30min range
```
**Why 3 ORBs Instead of 1?**
- **5min ORB**: Captures early institutional positioning (first 5 minutes)
- **15min ORB**: Confirms directional bias (more stable than 5min)
- **30min ORB**: Full market digestion of overnight news + opening orders
- **Confluence = Higher Win Rate**: When all 3 align, breakouts are extremely reliable
---
## 🎯 THE 5 HIGH-PROBABILITY SETUPS
### **SETUP #1: TRIPLE ORB BREAKOUT CONFLUENCE** ⭐⭐⭐⭐⭐
```
CONDITIONS:
✅ 30min ORB complete (10:00 AM NY / 3:30 AM London)
✅ Price breaks ALL 3 ORBs simultaneously:
• 5min high/low (blue line)
• 15min high/low (cyan line)
• 30min high/low (purple line)
✅ VWAP confirms direction (below price = bullish, above = bearish)
✅ Volume spike on breakout candle
ENTRY: Close of breakout candle (must close beyond ALL 3 ORBs)
STOP: Inside 30min ORB at 30m low (long) or 30m high (short)
TARGET 1: First green/red dashed line (0.5x 30m range)
TARGET 2: Second target (1x 30m range)
TARGET 3: Third target (1.5x 30m range)
WIN RATE: 75-85% | R:R = 1:2.5 minimum
NOTES: When all 3 ORBs align, institutional order flow is unanimous
```
---
### **SETUP #2: 5MIN EARLY BREAKOUT → 30MIN CONFIRMATION** ⭐⭐⭐⭐
```
CONDITIONS:
✅ Price breaks 5min ORB first (blue line crossed)
✅ 15min ORB holds initially (cyan line not crossed yet)
✅ After 30min ORB completes, price breaks 30min boundary (purple)
✅ VWAP alignment confirms direction
✅ All 3 ORBs now broken in same direction
ENTRY: When 30min ORB breaks (purple line) + 5min/15min already broken
STOP: 30min ORB opposite boundary
TARGET 1-3: Standard targets from 30min ORB
WIN RATE: 70-80% | R:R = 1:2+
NOTES: 5min gave early warning, 30min confirms institutional commitment
```
---
### **SETUP #3: FALSE 5MIN BREAKOUT → 30MIN REVERSAL** ⭐⭐⭐⭐⭐
```
CONDITIONS:
✅ Price breaks 5min ORB (blue line)
✅ Fails to break 15min or 30min ORBs (cyan/purple lines hold)
✅ Price reverses back inside 5min ORB
✅ Then breaks OPPOSITE side of 30min ORB (purple line)
✅ VWAP flips to confirm new direction
ENTRY: When 30min ORB breaks in OPPOSITE direction of failed 5min break
STOP: Failed 5min breakout high/low (now a liquidity grab zone)
TARGET 1-3: Standard targets
WIN RATE: 80-90% | R:R = 1:3+ (trapped traders forced to exit)
NOTES: Most profitable setup - 5min breakout was liquidity hunt
```
---
### **SETUP #4: TIGHT COMPRESSION → EXPLOSION** ⭐⭐⭐⭐
```
CONDITIONS:
✅ All 3 ORBs tightly overlapping (5m, 15m, 30m within 50 points on YM)
✅ Range < 0.3% of price (very tight consolidation)
✅ VWAP sitting in middle of compression
✅ 30min ORB complete, price still inside all 3
ENTRY: Simultaneous break of ALL 3 ORBs + VWAP cross
STOP: Middle of compression zone
TARGET: 2x-4x normal targets (volatility expansion)
WIN RATE: 65-75% | R:R = 1:5+ (explosive breakout)
NOTES: Low volatility → high volatility shift, institutions coiling spring
```
---
### **SETUP #5: VWAP BOUNCE WITHIN 30MIN ORB** ⭐⭐⭐⭐
```
CONDITIONS:
✅ Price stayed inside 30min ORB for 1+ hours post-formation
✅ VWAP acting as dynamic support (long) or resistance (short)
✅ Price bouncing between VWAP and 30min ORB boundaries
✅ Clear rejection candles at VWAP
ENTRY: When price bounces off VWAP toward 30min ORB boundary
• Long: VWAP bounce up toward 30m high (purple)
• Short: VWAP rejection down toward 30m low (purple)
STOP: Beyond VWAP by 20 points
TARGET: 30min ORB opposite boundary
WIN RATE: 70-80% | R:R = 1:1.5-2
NOTES: Range-bound play, NOT for breakout traders
```
---
## 🛡️ RISK MANAGEMENT RULES
### **Position Sizing by ORB Range**
```
30min ORB Range | Stop Distance | Risk $500 (1%) | YM Contracts
-----------------|------------------|-----------------|-------------
< 50 points | 50 pts | $500 ÷ $250 = | 2 contracts
50-100 points | 100 pts | $500 ÷ $500 = | 1 contract
100-150 points | 150 pts | $500 ÷ $750 = | 0.66 (use 1)
150-200 points | 200 pts | $500 ÷ $1000 = | 0.5 (use 1)
> 200 points | Don't trade | Too wide | Skip setup
Formula: Risk $ ÷ (Stop Distance × $5 per YM point) = Max Contracts
```
### **The 3-Strike Rule (MANDATORY)**
```
✅ Trade 1: Full position size (based on 30m ORB range)
❌ Stop hit → Trade 2: HALF position size
❌ Stop hit → Trade 3: QUARTER position size
❌ Stop hit → DONE FOR THE DAY (no exceptions)
```
### **Profit Taking Ladder**
```
TARGET 1 (0.5x 30m range): Take 50% off, move stop to breakeven
TARGET 2 (1.0x 30m range): Take 30% off, trail stop by 25 points
TARGET 3 (1.5x 30m range): Take 15% off, let 5% run with 50pt trail
```
---
## ⚠️ DO NOT TRADE IF...
```
🚫 30min ORB incomplete (< 10:00 AM NY / < 3:30 AM London)
🚫 30min ORB range < 40 points YM (too tight, likely chop)
🚫 30min ORB range > 250 points YM (too wide, unpredictable)
🚫 All 3 ORBs wildly divergent (5m=100pts, 15m=180pts, 30m=240pts)
🚫 Major news release within 30 minutes (wait for ORB to reform)
🚫 You've hit 3 losses in the session (3-strike rule)
🚫 You're tired, emotional, revenge trading, or distracted
🚫 Time > 12:00 PM ET (lunch, avoid until 1:00 PM)
🚫 Time > 3:00 PM ET unless Power Hour (3:00-4:00 PM) momentum
```
---
## 🔍 PRE-SESSION CHECKLIST
**15 Minutes Before London (2:45 AM ET) or NY (9:15 AM ET):**
```
□ Check economic calendar (FOMC? NFP? CPI? → extra caution)
□ Review previous session's ORB ranges (context for today's volatility)
□ Load SNIPER ORB on 1min or 5min chart
□ Select correct session: "London" or "New York"
□ Verify indicator settings:
• Number of Targets: 3
• Target % of 30min Range: 50%
• Show Anchored VWAP: ON
□ Set TradingView alerts:
• 30min ORB complete (10:00 AM or 3:30 AM)
• Price crossing 30min high/low
• VWAP crosses
□ Prepare bracket orders mentally (entry, stop, 3 targets)
□ Review yesterday's P&L and lessons learned
□ Set phone to "Do Not Disturb" mode
```
---
## 🎨 INDICATOR SETTINGS GUIDE
### **Core Settings (Updated with Toggles)**
```
SESSION SETTINGS:
━━━━━━━━━━━━━━━━━━━━━━━━━━━━━━━━━━━━━━━━
• Active Session: "London" or "New York"
ORB DISPLAY (NEW!):
━━━━━━━━━━━━━━━━━━━━━━━━━━━━━━━━━━━━━━━━
☑ Show 5min ORB (toggle blue lines)
☑ Show 15min ORB (toggle cyan lines)
☑ Show 30min ORB (toggle purple lines)
💡 Turn OFF any ORB to declutter your chart!
TARGET SETTINGS:
━━━━━━━━━━━━━━━━━━━━━━━━━━━━━━━━━━━━━━━━
• Number of Targets: 3 (default)
• Target % of 30min Range: 50% (default)
VWAP SETTINGS:
━━━━━━━━━━━━━━━━━━━━━━━━━━━━━━━━━━━━━━━━
☑ Show Anchored VWAP
• VWAP Color: Gold (#FFC107)
• VWAP Width: 2px
```
### **Color Customization (Optimized for Dark Charts)**
```
DEFAULT COLORS:
━━━━━━━━━━━━━━━━━━━━━━━━━━━━━━━━━━━━━━━━
5min ORB: Bright Blue (#2196F3) - 3px wide
15min ORB: Cyan (#00BCD4) - 2px wide
30min ORB: Purple (#9C27B0) - 2px wide
Upside Targets: Green (#4CAF50) - 1px dashed
Downside Targets: Red (#F44336) - 1px dashed
VWAP: Gold (#FFC107) - 2px solid
━━━━━━━━━━━━━━━━━━━━━━━━━━━━━━━━━━━━━━━━
WHY THESE COLORS?
• Blue family (5m/15m) = short-term, high-frequency
• Purple (30m) = primary, institutional level
• Green/Red = universal up/down
• Gold VWAP = fair value anchor (stands out)
```
### **Settings by Trading Style**
**BEGINNER (Clean & Simple):**
```
ORB Display:
☐ Show 5min ORB
☐ Show 15min ORB
☑ Show 30min ORB (30min only - focus mode)
Number of Targets: 2-3
Target % of 30min Range: 50%
Chart Timeframe: 5-minute
```
**SCALPER (5-15 min holds):**
```
ORB Display:
☑ Show 5min ORB (early signals)
☐ Show 15min ORB
☑ Show 30min ORB (confirmation)
Number of Targets: 5
Target % of 30min Range: 30-40%
Label Size: Tiny
Chart Timeframe: 1-minute
```
**DAY TRADER (30-90 min holds):**
```
ORB Display:
☑ Show 5min ORB
☑ Show 15min ORB
☑ Show 30min ORB (all 3 - confluence mode)
Number of Targets: 3
Target % of 30min Range: 50%
Label Size: Small
Chart Timeframe: 5-minute (RECOMMENDED)
```
**SWING TRADER (2-4 hour holds):**
```
ORB Display:
☐ Show 5min ORB (too noisy for swings)
☑ Show 15min ORB
☑ Show 30min ORB
Number of Targets: 2-3
Target % of 30min Range: 75-100%
Label Size: Normal
Chart Timeframe: 15-minute
```
---
## 📈 TIMEFRAME SELECTION GUIDE
| Your Timeframe | What You See | Best For |
|---------------|--------------|----------|
| **1-minute** | Every tick, high noise | Scalping, precision entries |
| **5-minute** | Balanced clarity | Day trading (RECOMMENDED) |
| **15-minute** | Clean structure | Swing positions |
| **30-minute** | Too compressed | Not recommended (can't see ORB form) |
**💡 PRO TIP:**
- **Primary chart: 5-minute** (for entries and monitoring)
- **Secondary chart: 1-minute** (for precise timing)
- **Never go above 15-minute** (ORBs won't form properly)
---
## 🧠 READING THE 3-ORB STRUCTURE
### **Bullish Alignment Patterns**
```
PATTERN 1: "Staircase Expansion"
5min: ━━━━ (tight, 60 pts)
15min: ━━━━━━ (wider, 90 pts)
30min: ━━━━━━━━ (widest, 120 pts)
→ Bullish expansion, expect upside breakout
PATTERN 2: "Nested Compression"
5min: ━━ (30 pts)
15min: ━━━ (35 pts)
30min: ━━━━ (40 pts)
→ All tight, explosive breakout likely
PATTERN 3: "Early Commitment"
5min: ━━━━━━ (100 pts, already broken up)
15min: ━━━━━ (80 pts, holding)
30min: ━━━━━ (110 pts, about to break)
→ 5min led the way, 30min confirmation coming
```
### **Bearish Alignment Patterns**
```
PATTERN 1: "Waterfall Setup"
5min: ━━━━ (50 pts, broke down)
15min: ━━━━━ (70 pts, broke down)
30min: ━━━━━━ (90 pts, about to break)
→ Sequential breakdown, strong bearish momentum
PATTERN 2: "Failed Highs"
5min: ━━━━━━ (upper wick rejections)
15min: ━━━━━━ (couldn't break)
30min: ━━━━━━━ (topped out)
→ All 3 rejecting highs, bearish reversal likely
```
### **Neutral/Chop Patterns (AVOID TRADING)**
```
PATTERN 1: "Wide Divergence"
5min: ━━ (30 pts)
15min: ━━━━━━━ (120 pts)
30min: ━━━━━━━━━━━ (200 pts)
→ No consensus, unpredictable, skip
PATTERN 2: "Whipsaw City"
• Price breaking 5min up, then down, then up again
• 15min and 30min not aligned
• VWAP getting crossed every 5 minutes
→ Chop day, step aside, wait for clarity
```
---
## 📊 INTEGRATION WITH YM ULTIMATE SNIPER v8.1
**The 2-System Confluence Method:**
```
┌─────────────────────────────────────────────────────────────┐
│ STEP 1: SNIPER ORB → Defines "Zones That Matter" │
│ • 30min ORB = primary institutional range │
│ • VWAP = fair value anchor │
│ • Targets = profit zones │
│ • 5min/15min = early warning signals │
└─────────────────────────────────────────────────────────────┘
↓
┌─────────────────────────────────────────────────────────────┐
│ STEP 2: YM ULTIMATE SNIPER → Triggers precise entry │
│ • Wait for GOD MODE signal AT 30min ORB boundary │
│ • 6-gate filter: Score ≥9, fat body ≥70%, delta ≥70% │
│ • Candle Dominance Index (CDI) ≥7 │
│ • Intrabar pressure consistent throughout formation │
└─────────────────────────────────────────────────────────────┘
↓
┌─────────────────────────────────────────────────────────────┐
│ STEP 3: EXECUTE TRADE │
│ • ORB breakout + GOD MODE = MAXIMUM PROBABILITY │
│ • Enter ONLY when BOTH systems align │
│ • This is TRUE "sniper" trading (2-5 trades/day max) │
└─────────────────────────────────────────────────────────────┘
```
**Confluence Scoring for Combined System:**
```
SNIPER ORB Criteria:
□ 30min ORB complete (10:00 AM+) +2 points
□ All 3 ORBs broken in same direction +2 points
□ VWAP alignment (below=bull, above=bear) +1 point
□ Volume spike on breakout candle +1 point
□ Tight 3-ORB compression (<100pt divergence) +1 point
YM ULTIMATE SNIPER Criteria:
□ GOD MODE signal at ORB boundary +3 points
□ Score ≥9.0 (tier classification) +1 point
□ Candle Dominance Index (CDI) ≥8 +1 point
TOTAL POSSIBLE: 12 points
TRADE EXECUTION RULES:
• 10-12 points = MAX SIZE (this is the holy grail setup)
• 8-9 points = FULL SIZE (high probability)
• 6-7 points = HALF SIZE (moderate probability)
• <6 points = NO TRADE (wait for better alignment)
```
---
## 💡 COMMON MISTAKES & FIXES
```
❌ MISTAKE: Trading before 30min ORB completes
✅ FIX: Wait until 10:00 AM (NY) or 3:30 AM (London), NO EXCEPTIONS
❌ MISTAKE: Ignoring 5min and 15min ORBs (only watching 30min)
✅ FIX: Use all 3 for confluence - they're your early warning system
❌ MISTAKE: Chasing breakouts 100+ points beyond 30min ORB
✅ FIX: Wait for pullback to VWAP or 30min boundary for re-entry
❌ MISTAKE: Not adjusting target % for market conditions
✅ FIX: Volatile day (ORB >200pts)? Use 75-100% targets
Calm day (ORB <80pts)? Use 30-40% targets
❌ MISTAKE: Trading when all 3 ORBs are wildly different sizes
✅ FIX: Skip the day if 5m/15m/30m diverge by >100pts - no consensus
❌ MISTAKE: Forgetting VWAP position
✅ FIX: VWAP MUST confirm bias:
• Long: price > VWAP
• Short: price < VWAP
• If VWAP contradicts, skip the trade
❌ MISTAKE: Not respecting the 3-strike rule
✅ FIX: 3 losses = DONE for the session, no rationalization
❌ MISTAKE: Trading during lunch (12:00-1:00 PM ET)
✅ FIX: Volume dies, ORBs lose relevance, false signals increase
```
---
## 🔔 ALERT SETUP (ESSENTIAL)
**TradingView Alerts You MUST Set:**
```
ALERT 1: "30min ORB Complete"
• Type: Time-based
• Trigger: 10:00 AM ET (NY) or 3:30 AM ET (London)
• Message: "🎯 30min ORB complete - targets now active"
ALERT 2: "30min ORB High Breakout"
• Type: Crossing Up
• Value 1: Close
• Value 2: 30min ORB High (purple line)
• Message: "🚀 30m ORB HIGH broken - check for long setup"
ALERT 3: "30min ORB Low Breakdown"
• Type: Crossing Down
• Value 1: Close
• Value 2: 30min ORB Low (purple line)
• Message: "📉 30m ORB LOW broken - check for short setup"
ALERT 4: "VWAP Cross"
• Type: Crossing
• Value 1: Close
• Value 2: VWAP
• Message: "⚡ VWAP crossed - check institutional bias shift"
ALERT 5: "Target 1 Hit"
• Type: Crossing
• Value 1: High (for longs) or Low (for shorts)
• Value 2: First target line
• Message: "🎯 Target 1 hit - take 50% off, move stop to BE"
```
---
## 📱 MOBILE TRADING WORKFLOW
**TradingView Mobile App Setup:**
```
1. SAVE LAYOUT
• Chart: 5-minute timeframe
• SNIPER ORB indicator loaded
• YM Ultimate SNIPER v8.1 loaded (if using)
• Save as "SNIPER ORB - YM"
2. ENABLE NOTIFICATIONS
• Settings → Notifications → Push Alerts: ON
• All 5 alerts above configured
3. QUICK ACCESS
• Add YM futures to Watchlist: "MYM" or "YM1!"
• Pin SNIPER ORB layout to favorites
4. EXECUTION READY
• Broker app (TastyTrade, NinjaTrader, etc.) logged in
• Preset bracket orders:
- Entry: market order
- Stop: 30m ORB opposite boundary
- Targets: 3 levels (50%, 30%, 20% of position)
5. BATTERY & CONNECTIVITY
• Phone charged 100% before session
• Stable WiFi or LTE connection
• Backup power bank available
```
---
## 🎓 DAILY PERFORMANCE JOURNAL
**After Each Trading Session (MANDATORY):**
```
═══════════════════════════════════════════════════════════════
DATE: __________ SESSION: □ London □ New York
═══════════════════════════════════════════════════════════════
ORB DATA:
• 5min ORB Range: ______ points
• 15min ORB Range: ______ points
• 30min ORB Range: ______ points
• Alignment: □ Tight □ Moderate □ Wide (skip if wide)
VWAP BEHAVIOR:
• Opening position: □ Above price □ Below price □ Mixed
• Did VWAP act as support/resistance? □ Yes □ No
TRADES TAKEN:
Total Setups Identified: _____
Trades Executed: _____
Win/Loss Record: _____ W / _____ L
Win Rate: _____%
Gross P&L: $_______
Net P&L (after commissions): $_______
BEST TRADE:
• Setup: ____________________ (which of the 5 setups?)
• Entry Price: ______ Exit Price: ______
• Profit: $_______
• What went RIGHT: _________________________________
_________________________________________________
WORST TRADE:
• Setup: ____________________
• Entry Price: ______ Exit Price: ______
• Loss: $_______
• What went WRONG: _________________________________
_________________________________________________
• Lesson Learned: ___________________________________
3-STRIKE RULE STATUS:
□ No losses (great day)
□ 1 loss (still in game)
□ 2 losses (caution, half size)
□ 3 losses (stopped for day, as required)
TOMORROW'S ADJUSTMENTS:
□ _________________________________________________
□ _________________________________________________
□ _________________________________________________
EMOTIONAL STATE TODAY:
□ Calm & focused (optimal)
□ Anxious/rushed (need to work on patience)
□ Overconfident (dial back position size)
□ Fearful (review winning trades to build confidence)
═══════════════════════════════════════════════════════════════
```
---
## 🚀 YOUR FIRST LIVE TRADE WALKTHROUGH
**Step-by-Step for New York Session (Most Common):**
```
⏰ 9:15 AM ET - PREPARATION
□ Load SNIPER ORB on YM 5-minute chart
□ Select "New York" session in indicator settings
□ Verify VWAP is showing (gold line)
□ Check economic calendar (any big news at 9:30?)
□ Prepare mentally: "I will wait for 30min ORB to complete"
⏰ 9:30 AM ET - SESSION OPENS
□ Watch 3 ORBs begin forming:
• Blue lines (5min) will lock in at 9:35 AM
• Cyan lines (15min) will lock in at 9:45 AM
• Purple lines (30min) will lock in at 10:00 AM
□ Observe VWAP anchoring at 9:30 AM candle
□ DO NOT TRADE YET - just observe
⏰ 9:35 AM - 5MIN ORB COMPLETE
□ Note 5min high/low (blue lines locked)
□ Check info table: "5m Range = XX points"
□ If 5min ORB breaks early, note direction but DON'T ENTER
⏰ 9:45 AM - 15MIN ORB COMPLETE
□ Note 15min high/low (cyan lines locked)
□ Compare to 5min ORB: Aligned? Expanding?
□ Still waiting... patience pays
⏰ 10:00 AM - 30MIN ORB COMPLETE (TARGETS APPEAR!)
□ Purple lines locked (30m high/low)
□ Green/red dashed target lines appear automatically
□ Info table shows "Status: ✓ Complete"
□ NOW you can trade breakouts
⏰ 10:00 AM - 11:30 AM - TRADING WINDOW
□ Wait for price to break purple line (30m ORB high or low)
□ Confirm:
1. All 3 ORBs broken in same direction?
2. VWAP confirming (below=bullish, above=bearish)?
3. Volume spike visible?
4. YM SNIPER GOD MODE signal? (if using)
□ If all YES → ENTER TRADE:
• Market order at breakout close
• Stop at 30m ORB opposite boundary
• Targets at green/red dashed lines
⏰ TARGET MANAGEMENT
□ Price hits first target (1x) → Take 50% off, move stop to BE
□ Price hits second target (2x) → Take 30% off, trail stop
□ Price hits third target (3x) → Take 15% off, let 5% run
⏰ 12:00 PM - LUNCH (AVOID TRADING)
□ Volume dies down
□ ORBs become less relevant
□ Take a break, review morning trades
⏰ 1:00 PM - 3:00 PM - AFTERNOON SESSION
□ ORBs still valid but less reliable
□ Consider waiting for Power Hour (3:00-4:00 PM)
⏰ 5:00 PM - SESSION END
□ All ORB lines disappear automatically
□ VWAP disappears automatically
□ Chart cleans itself - ready for tomorrow
□ Fill out daily journal
```
---
## 🏆 WINNING MINDSET AFFIRMATIONS
Read these BEFORE each trading session:
```
"I trade ORBs, not chaos. Structure gives me edge."
"3 high-quality trades beat 20 mediocre ones."
"The 30min ORB is my anchor. I wait for it. Every. Single. Time."
"When all 3 ORBs align, institutions are unified. I follow."
"VWAP is my institutional compass. I respect its guidance."
"3 strikes and I'm out. Discipline > Ego."
"I am a SNIPER, not a machine gunner. Precision wins."
"My edge is patience. Let the ORBs complete."
"I don't predict. I react to proven structure."
"One perfect setup is worth waiting all morning."
```
---
## 📞 TROUBLESHOOTING
**"ORB lines not showing on chart!"**
→ Check timeframe: Must be 1min-30min (not daily/weekly)
→ Verify session time: Must be during London (3AM-9:30AM) or NY (9:30AM-5PM)
→ Check indicator status: Should say "⏳ Forming" or "✓ Complete" in table
**"Targets not appearing!"**
→ 30min ORB must be complete (10:00 AM NY / 3:30 AM London)
→ Check "Number of Targets" setting (must be ≥1)
→ Verify "Target % of 30min Range" is set (default 50%)
**"VWAP disappeared!"**
→ Normal behavior: VWAP auto-deletes at session end (5PM NY / 9:30AM London)
→ Toggle "Show Anchored VWAP" OFF then ON to reset
→ Check if you're viewing chart outside session hours
**"All 3 ORBs look the same!"**
→ This is actually GOOD - means tight alignment (high-probability setup)
→ If they're diverging wildly (>100pts difference), that's a skip signal
**"Info table blocking my view!"**
→ Info table is in top-right corner by default
→ Drag it to a different position (TradingView allows moving)
→ Or minimize it by clicking the small arrow
**"Colors are hard to see on my chart!"**
→ Go to indicator settings:
• "5min ORB", "15min ORB", "30min ORB" color pickers
• "Upside Targets", "Downside Targets" color pickers
• Recommended: Use contrasting colors vs your chart background
---
## 📚 ADVANCED INTEGRATION TECHNIQUES
### **Combining with Market Profile**
```
• Use Volume Profile to identify Value Area High (VAH) and Low (VAL)
• If 30min ORB aligns with VAH/VAL → extra confluence
• POC (Point of Control) acts similar to VWAP
```
### **Combining with Cumulative Delta**
```
• Check if delta is positive on 30min ORB high break (bullish confirmation)
• Negative delta on low break confirms bearish institutional flow
• Your YM SNIPER already tracks this - use together!
```
### **Combining with Options Flow**
```
• Large call buying near 30min ORB high? Institutions positioning for breakout
• Large put buying near 30min ORB low? Smart money hedging/shorting
• Tools: Unusual Whales, Cheddar Flow, OptionStrat
```
---
## 🎯 FINAL PRE-LIVE CHECKLIST
**DO NOT GO LIVE UNTIL ALL CHECKED:**
```
□ Practiced on TradingView Replay for 2+ weeks
□ Can identify all 5 setups by pattern recognition
□ Understand why targets come from 30min ORB only
□ Know difference between 5min/15min/30min roles
□ Risk management rules memorized (position sizing, 3-strike)
□ YM Ultimate SNIPER v8.1 loaded (optional but recommended)
□ All 5 TradingView alerts configured
□ Broker platform tested with demo account
□ Stop/target orders can be placed in <10 seconds
□ Daily journal template prepared
□ Emotional state: calm, patient, focused
□ Account size: Minimum $10,000 recommended
□ Understand auto-disappear behavior (ORBs delete at session end)
□ Know NOT to trade before 30min ORB complete
□ Comfortable with looking at chart and seeing 6+ lines (3 ORBs + targets)
IF ALL CHECKED → YOU'RE READY TO SNIPE! 🎯
IF ANY UNCHECKED → KEEP PRACTICING, DON'T RUSH
```
---
## 💎 THE CORE PRINCIPLE
```
╔═══════════════════════════════════════════════════════════╗
║ ║
║ "The ORB doesn't predict the market. ║
║ The ORB reveals where institutions are positioned. ║
║ ║
║ When you see all 3 ORBs align and break, ║
║ you're not guessing direction— ║
║ you're following the billion-dollar order flow." ║
║ ║
║ THAT'S YOUR EDGE. ║
║ ║
╚═══════════════════════════════════════════════════════════╝
```
**🎯 Good luck, stay patient, and happy sniping! 🎯**
═══════════════════════════════════════════════════════════════════
END OF SNIPER ORB TRADING CHEAT SHEET v3.0
═══════════════════════════════════════════════════════════════════

ORB + FVG A+ PRO (All-in-One) [QQQ]Configurable ORB + FVG + filters (VIX, ORB range, relative volume) + A+ PRO (retest at the FVG edge + rejection) + anti-fakeout + orange reminder “CONFIRM POC/HVN (Volume Profile)” right when the A+ signal appears

VCAI Volume & Liquidity Map LiteVCAI Volume & Liquidity Map Lite visualises recent market participation using a horizontal liquidity/volume histogram plotted beside current price.
It shows where trading activity has clustered, where the chart is thin, and how much of that activity came from buying vs selling pressure.
This Lite edition keeps the tool simple and fast:
Yellow = buy-side volume (aggressive buyers / upward pressure)
Purple = sell-side volume (aggressive sellers / downward pressure)
Thicker sections = higher traded volume at that price
POC line (purple) marks the price with the highest volume concentration
Value Area lines (yellow dashed) mark where ~70% of volume has traded
Bars extend outward to the right of price for a clean, unobstructed chart
Lookback setting controls how many candles the map is built from
Use it to quickly identify:
high-interest price zones
low-liquidity areas where price can move fast
likely reaction levels
where momentum may slow, reverse, or break through
Designed as a lightweight, open-source tool for anyone wanting a clean liquidity/volume map without complex settings.
Part of the VCAI Lite Series.

Candle POC [DemaK]Indicador de puntos de control de las velas
(No es tan preciso como en las plataformas, tenemos que entender que tradingview no toma la data por tick, pero puede servir de forma orientativa)
**"Candle Point of Control Indicator
(It’s not as precise as in dedicated platforms, since TradingView does not process true tick-by-tick data, but it can still be useful as a general reference.)"**

Composite Market Momentum Index (CMM)***The Composite Market Momentum Index (CMMI), developed by Alcides Davila, a Miami-based Business Consultant, functions as a specialized momentum oscillator within sophisticated technical frameworks such as the Composite Predictive Index (CPI-IGv5)***. Davila's background in volatile sectors informs CMMI's design, emphasizing resilient, multi-layered analysis to navigate market uncertainties. At its essence, CMMI synthesizes momentum from RSI and momentum indicators, serving as a key input to CPI-(IGv5's)*** probability engine for directional forecasts.
The primary purpose of CMMI is to assess market strength and potential shifts, helping traders identify high-probability opportunities while mitigating risks from isolated metrics. Integrated into CPI-IGv5, it bolsters the "probUp" metric—a probabilistic estimate of upward price action—by fusing complementary factors, yielding a claimed 68-80% trend-prediction accuracy in backtests. Productivity is moderate to high under trending conditions, where multi-indicator redundancy reduces false positives. Still, it may underperform in ranging or highly volatile markets, necessitating user-led backtesting to assess real-world efficacy.
Mathematically, CMMI originates from a 9-period momentum applied to a 14-period RSI, enhanced by a 3-period smoothed short RSI to create the base composite. It undergoes Z-score standardization over a 50-bar window for normalization, followed by a linear weighted sum with other elements (e.g., 0.10 allocation to momentum). Logical enhancements include using the hyperbolic tangent (tanh) for value bounding and cumulative distribution function (CDF) or logistic mappings to derive probabilities, ensuring outputs are statistically rigorous. Threshold logic governs signals: overbought alerts trigger on crossovers above 75 (normalized scale), oversold below 25, with strict pro filters at 0.55 (buy) and 0.45 (sell) on a 0-1 basis, often requiring confirmations from EMA slopes, POC crossovers, or volume deltas. This gated approach adds precision by filtering signals through base, strong, and ultra categories based on probUp thresholds, such as>0.68 for medium-term entries.
Versatility is evident in CMMI's multitimeframe adaptability, supporting modes from scalping (1-minute resolution, short multipliers) to long-term (daily, extended lookbacks up to 500 bars), dynamically adjusting via secure data requests to incorporate live and historical momentum. It accommodates diverse assets, including commodities—Davila's focus—equities, and forex, with customizable weights and manual inputs ( scale) for external variables like news impact (elevated to 0.20 for emphasis) or industry segments (0.05), allowing fine-tuning for macroeconomic or sector-specific contexts. Efficiency is achieved through real-time rolling sums, Z-windows, and resource optimizations (e.g., max 500 bars/lines/labels), minimizing computational overhead while enabling cooldowns to mitigate alert fatigue in high-frequency setups.
For enhanced application, pair with confirmatory indicators such as MACD ratios or VWAP, and use strategy modes to backtest signal viability across horizons. Target investors include day traders and scalpers seeking quick, data-driven entries, institutions focused on commodity analysis, and technically adept retail users, all of whom benefit from its probabilistic framework over rigid rules. While versatile, CMMI's closed-source aspects in Pine Script limit full transparency, underscoring the need for empirical testing.

LVN Smart Liquidity📊 LVN SMART LIQUIDITY
═════════════════════════════════════════════════════════════
─────────────────────────────────────────────────────────────
🎯 OVERVIEW
LVN Smart Liquidity is an advanced Market Profile-based indicator that automatically identifies Low Volume Nodes (LVN) across multiple timeframes. Unlike traditional volume-based indicators, this tool uses TPO (Time Price Opportunity) calculations to detect price levels where minimal trading activity occurred, revealing potential breakout zones and rapid price movement areas.
These LVN zones often behave similarly to Fair Value Gaps (FVG) in Smart Money Concepts, representing "thin air" areas where price tends to move quickly with minimal resistance. The indicator provides dynamic zone management with an immunity period system to prevent premature zone closure.
─────────────────────────────────────────────────────────────
🔬 HOW IT WORKS
MARKET PROFILE TPO METHODOLOGY:
The indicator analyzes each higher timeframe period by:
1. Dividing the price range into 20 equal levels
2. Counting how many bars touched each level (TPO count)
3. Identifying levels with TPO counts below the threshold (default 30% of maximum)
4. Creating horizontal zones that extend until price touches them
MULTI-TIMEFRAME ANALYSIS:
• Supports up to 5 independent timeframes simultaneously
• Each timeframe generates its own LVN zones with unique colors
• Auto-timeframe mode adapts to your chart period
• Zones project from historical sessions onto current price action
SMART ZONE MANAGEMENT:
• Immunity Period: New zones are protected for N bars after creation (default 20)
• This prevents zones from disappearing immediately when price is already within them
• Zones extend right until price touches them, then stop extending
• Historical zones remain visible for reference (optional)
─────────────────────────────────────────────────────────────
💡 WHY LVN ZONES MATTER
Low Volume Nodes represent price levels where:
✓ Price spent minimal time (rejection zones)
✓ Few market participants were active
✓ Inefficient price discovery occurred
✓ Similar to Fair Value Gaps in ICT/SMC methodology
TRADING APPLICATIONS:
• Breakout Acceleration: Price moves rapidly through LVN zones
• Profit Targets: Place targets beyond LVN zones where momentum slows
• Stop Loss Placement: Avoid placing stops inside LVN zones (price likely to continue)
• Confluence with FVG: LVN zones often align with Fair Value Gaps
• Retest Opportunities: When price revisits LVN, expect quick moves
─────────────────────────────────────────────────────────────
⚙️ KEY FEATURES
TIMEFRAME FLEXIBILITY:
• 5 independent timeframe slots with enable/disable toggles
• Auto-mode intelligently selects higher timeframes
• Preset options: 5m, 15m, 30m, 1H, 2H, 4H, D, W, 2W, M, 3M, 6M, 12M
VISUAL CUSTOMIZATION:
• Individual color settings for each timeframe
• Adjustable box transparency and border width
• Toggle timeframe labels and period dates on/off
• Four text size options: tiny, small, normal, large
ADVANCED CONTROLS:
• LVN Threshold: 0-50% (default 30%) - lower = fewer, stronger zones
• Immunity Period: 0-50 bars (default 20) - prevents premature closure
• Show/Hide old boxes for clean chart appearance
• Maximum 500 boxes supported per timeframe
PROFESSIONAL DISPLAY:
• Zones show timeframe label (5m, 1H, D, etc.)
• Optional period dates (dd.MM-dd.MM format)
• Boxes extend right dynamically until price touch
• Clean visual hierarchy with bordered zones
─────────────────────────────────────────────────────────────
📈 HOW TO USE
SETUP:
1. Add indicator to chart
2. Enable desired timeframes (TF1, TF2, etc.)
3. Adjust LVN threshold based on your trading style:
• 20-25% = Very selective (only thinnest zones)
• 30-35% = Balanced (recommended for most markets)
• 40-50% = More zones (higher sensitivity)
INTERPRETATION:
• RED/DARK ZONES = Low trading activity occurred here
• Price tends to move THROUGH these zones quickly
• Similar behavior to Fair Value Gaps (FVG) in Smart Money theory
• Expect acceleration when price enters LVN zones
TRADING STRATEGIES:
1. BREAKOUT TRADING:
- Wait for price to approach LVN zone
- Enter when price breaks into the zone
- Expect rapid movement through the zone
- Target next support/resistance beyond LVN
2. CONFLUENCE ANALYSIS:
- Combine with other SMC concepts (Order Blocks, FVG, Liquidity)
- LVN + FVG overlap = high-probability acceleration zone
- Use higher timeframe LVN as directional bias
3. MULTI-TIMEFRAME:
- Daily LVN = major breakout zones
- 4H LVN = intraday momentum areas
- 15m LVN = scalping opportunities
─────────────────────────────────────────────────────────────
⚠️ IMPORTANT NOTES
WHAT THIS INDICATOR IS:
✓ Market Profile TPO-based LVN detector
✓ Multi-timeframe zone identification tool
✓ Visual representation of low trading activity areas
✓ Complementary to Smart Money Concepts (SMC/ICT)
WHAT THIS INDICATOR IS NOT:
✗ Not a standalone trading system
✗ Not a guaranteed profit generator
✗ Not financial advice
✗ Requires confirmation from price action and other tools
LIMITATIONS:
• Works best on liquid markets with reliable data
• Lower timeframes may produce excessive zones
• Requires understanding of Market Profile concepts
• Performance depends on proper threshold calibration
BEST PRACTICES:
• Start with 1-2 timeframes, add more as needed
• Use higher timeframes for swing trading
• Combine with support/resistance, trendlines, order blocks
• Backtest on your specific instrument before live trading
• Adjust immunity period based on market volatility
─────────────────────────────────────────────────────────────
🔧 SETTINGS GUIDE
TIMEFRAME GROUPS (1-5):
Each group contains:
• Enable toggle - Turn timeframe on/off
• Timeframe selector - Choose period or Auto
• Box color - Zone fill color
• Border color - Zone outline color
GENERAL SETTINGS:
• LVN Threshold (%) - Percentage of max TPO to qualify as LVN
• Show Old LVN Boxes - Keep historical zones visible
• Box Border Width - Visual thickness (1-4)
• Immunity Period - Protection bars for new zones
• Show Timeframe - Display TF label in boxes
• Show Period - Display date range in boxes
• Text Size - Label size adjustment
─────────────────────────────────────────────────────────────
📊 ORIGINALITY & UNIQUENESS
This indicator is original because:
1. TPO-BASED CALCULATION: Uses Market Profile Time-Price-Opportunity methodology instead of traditional volume analysis, making it work on all markets including those without real volume data (Forex, some indices).
2. IMMUNITY SYSTEM: Unique protection mechanism prevents zones from disappearing immediately when price is already within zone boundaries at creation time.
3. TRUE MULTI-TIMEFRAME: Independent calculation for each timeframe with separate zone management, not simple higher timeframe projection.
4. SMART ZONE LIFECYCLE: Zones dynamically extend until price touch, then become static historical references.
5. FVG-LIKE BEHAVIOR: Bridges traditional Market Profile analysis with modern Smart Money Concepts by identifying zones that behave similarly to Fair Value Gaps.
Unlike existing LVN indicators that rely on volume data, this tool uses time-based analysis, making it universal across all market types and compatible with brokers that don't provide accurate volume information.
─────────────────────────────────────────────────────────────
📚 TECHNICAL BACKGROUND
MARKET PROFILE THEORY:
Developed by J. Peter Steidlmayer in the 1980s, Market Profile analyzes market behavior by examining price and time relationships. Low Volume Nodes in traditional profile represent areas where market participants showed minimal interest.
TPO (TIME PRICE OPPORTUNITY):
Instead of counting volume, TPO counts how many time periods (bars) touched each price level. This approach:
• Works on all markets regardless of volume data quality
• Reflects actual time-based market acceptance/rejection
• Reveals psychological price levels through time distribution
CONNECTION TO SMART MONEY CONCEPTS:
Fair Value Gaps (FVG) in ICT methodology represent similar inefficiencies:
• Areas where price moved too quickly
• Imbalances in buying/selling pressure
• Zones that price may revisit or accelerate through
• LVN zones often overlap with FVG locations
─────────────────────────────────────────────────────────────
🎓 RECOMMENDED RESOURCES
To maximize this indicator's effectiveness, study:
• Market Profile fundamentals (TPO, POC, Value Area)
• Smart Money Concepts (FVG, Order Blocks, Liquidity)
• Multi-timeframe analysis techniques
• Volume Profile comparison (understand the difference)
COMPANION INDICATOR:
Consider using "HVN Smart Liquidity" (opposite concept) to identify both high and low volume zones for complete Market Profile analysis.
─────────────────────────────────────────────────────────────
💬 SUPPORT & FEEDBACK
Questions or suggestions? Feel free to comment below or send a private message.
If you find this indicator useful, please boost and share with other traders!
⚠️ DISCLAIMER: This indicator is for educational purposes only. Trading involves risk. Always do your own research and use proper risk management.

AlphaNatt | FINAL REVELATION [Visual God]AlphaNatt | The Final Revelation
"Where Information Theory meets Market Geometery."
The AlphaNatt is a comprehensive market structure and volumetric analysis suite designed for the institutional-grade trader. It merges advanced quantitative concepts—specifically Shannon Entropy and Neural Pattern Filtering—with a "Holographic" visual interface that prioritizes clarity over clutter.
This is not just an indicator; it is a complete decision-support system that answers three critical questions:
Is the market chaotic or ordered? (Entropy Engine)
Where is the liquidity? (Volumetric Heatmap)
What is the true structure? (Fractal Geometry)
🌌 The Gen 100 Math Engine
At the core of this script lies a unique implementation of Information Theory.
1. Shannon Entropy (The Chaos Filter)
Most indicators fail because they try to predict "Noise". This script calculates the Entropy (in Bits) of the recent price action.
High Entropy: The market is in a "Random Walk" state. Visuals fade out, transparency increases, and signals are suppressed.
Low Entropy: The market is "Ordered" and approaching a singularity/decision point. Visuals glow brightly to indicate a high-probability environment.
2. Neural Pattern Recognition
The diamond signals (Cyan/Magenta) are not simple simple crossovers. They are driven by a composite logic simulating a neural filter:
Inputs: Normalised RSI + Momentum Divergence + Volatility State.
Logic: Signals only trigger when the market is statistically overextended AND showing signs of momentum decay.
💎 Holographic Features
🔥 Volumetric Heatmap
The script scans historical price action to build a Volume Profile Heatmap on the right side of the chart.
Purple/Blue Zones: These represent High Volume Nodes (HVNs). These act as "Gravity Wells" for price—often stopping trends or acting as launchpads for reversals.
POC (Point of Control): The bright green line indicates the price level with the absolute highest volume in the lookback period.
🌀 Fractal Structure Lines
Price action is often noisy. The script uses a Fractal Pivot Algorithm (Length 5) to identify the "True Highs" and "True Lows".
It connects these points with dashed "Neural Lines" to show the naked market skeleton.
This instantly reveals if you are in a trend of Higher Highs or a breakdown of Lower Lows.
🖥️ The Heads-Up Display (HUD)
A minimalist dashboard keeps you informed of the math underneath:
ENTROPY: The raw bit-score of market chaos.
REGIME: Tells you instantly if you are in "ORDER" (Tradeable) or "CHAOS" (Sit out).
STRUCT: Real-time status of the fractal structure (Breakout/Breakdown/Ranging).
⚙️ Settings & Configuration
Theme: Choose between "Cyber" (Neon), "Aeon" (Deep Blue), or "Gold" (Luxury).
Max Entropy: Adjust the sensitivity of the Chaos Filter. Lower values = stricter filtering (fewer trades).
Heatmap Depth: Control how far back the volume profile scans.
⚠️ Disclaimer
This tool is designed for educational market analysis. "Entropy" and "Neural" refer to the mathematical algorithms used to process price data and do not guarantee future performance. Always manage risk responsible.

Market Level Finder By Sultan of Multan)Market Level Finder is a premium visual tool designed to help traders clearly identify high-importance market levels in real time. It focuses purely on price levels and reactions, not complicated strategies — making it ideal for both beginners and advanced traders.
This indicator does not give blind buy/sell signals. Instead, it provides a structured environment where traders can make smart, disciplined, and level-based decisions.
⸻
✅ What This Indicator Shows
• Support & Resistance
• Liquidity Levels
• Fair Value Gaps (FVG)
• Order Blocks (OB)
• Previous Day High / Low (PDH / PDL)
• Volume Point of Control (POC)
• Fibonacci Levels
• Asian Session Range
• Psychological Round Numbers
• Dynamic Dashboard with Live Status
All important levels are visualised directly on the chart with a clean dashboard for quick decision-making.
⸻
📌 How to Use
• 🟢 Green zones = Buy areas
• 🔴 Red zones = Sell areas
• Only consider entries when:
• Price approaches a strong level
• Dashboard highlights it as active
• The more levels that overlap at one price, the stronger the zone
• 🚫 Avoid trading in the middle of the range
• ✅ Always wait for:
Level → Price Reaction → Confirmation
• ⏱️ Best performance during:
• London Session
• New York Session
⸻
🛡️ Risk Disclaimer
This indicator is not a financial advisory tool.
It is designed for educational and analytical purposes only.
• Always use Stop Loss
• Never risk money you cannot afford to lose
• Past performance does not guarantee future results
⸻
⭐ Who This Tool Is For
• Scalpers
• Intraday Traders
• Gold (XAUUSD) Traders
• Index & Crypto Traders
• Anyone who trades using levels and structure

Tesseract X-RayTesseract X-Ray — Smart Money Concept indicator that reveals hidden market structure.
Features:
• Fair Value Gaps (FVG) — imbalance zones where price tends to return
• Order Blocks (OB) — institutional supply/demand zones
• Volume Profile — POC, VAH, VAL levels
• High Volume Nodes (HVN) — liquidity clusters
Clean visualization with automatic zone detection and mitigation tracking.
Built-in alerts for key level touches.
by @TesseractCrypto

Opening Range & Session Liquidity [LTS]“Opening Range & Session Liquidity ” is an intraday planning tool that combines a configurable Opening Range box with session highs/lows and previous-day reference levels. It is designed to help you visualize where liquidity is likely to build up around the cash open and major global sessions, without making any forecasts or performance promises. It is designed with our signature attention to user customization and accessibility.
Opening Range & Bias
The script builds a configurable Opening Range (OR) in New York time (default 08:00–08:15 on a 15-minute basis), regardless of your chart timeframe (up to 1-hour). The high, low, and midline of this window are drawn as a transparent box and dashed midline that extend forward so you can see how the session trades around that range.
At a user-defined Bias Check Time (default 09:30–09:31 NY), the script classifies the OR as:
Bullish if price is above the OR high
Bearish if price is below the OR low
Neutral if price is still trading inside the OR
The box color updates to reflect the current bias if bias mode is enabled. All OR parameters (formation window, bias check, colors, maximum number of zones, etc.) are adjustable.
Entry Signal Logic
The indicator can optionally generate non-repainting visual signals when price interacts with the OR midline.
1. 9:30 Bias mode (trend-following)
A directional bias is locked in at the bias check time.
Signals trigger only when price trades through the OR midline inside the box, aligned with that bias:
Bullish bias → long signal when price touches the midline from below and closes inside the range.
Bearish bias → short signal when price touches the midline from above and closes inside the range.
Each “episode” can fire only once; signals are confirmed on the bar where the conditions first become true.
2. Entry Direction mode (reaction to first touch)
Instead of using a fixed 9:30 bias, the script detects from which side price first enters the OR (from above or from below).
That “entry direction” stays active until price fully exits and closes outside the OR again.
When price later touches the midline while the entry direction is defined, a single long or short signal is triggered based on the stored direction of entry.
In both modes, historical signals are plotted without using future data; only the real-time bar can change state until it closes.
Optional TP/SL Visualization
When a long or short signal appears, the script can draw simple take-profit/stop-loss boxes to illustrate a basic one-trade idea:
Stop-loss distance can be defined as:
A fixed number of points beyond the OR high/low, or
A percentage of ATR (configurable length and percent).
Take-profit is automatically placed at a user-defined risk-to-reward multiple of that stop distance.
The boxes extend forward bar by bar and stop updating once either TP or SL is touched, or when a new OR session resets the context.
These boxes are for visualization only and do not place or manage orders.
Session Liquidity & PDH/PDL
To help you map where liquidity frequently builds up, the script tracks three configurable intraday sessions in New York time:
Asian session (default 18:00–02:00)
London session (default 03:00–08:00)
New York session (default 09:30–16:00)
For each completed session, the indicator records the session high and low, then:
Draws solid horizontal lines and labels (e.g., “Asia Hi/Lo”, “London Hi/Lo”, “NY Hi/Lo”).
Extends these solid lines to the right as long as they remain untouched by price.
When price first trades through a level, the solid line is cut at that bar and replaced by a dashed line that extends only until the next session of the same type begins.
Older sessions are automatically removed according to the “Max Sessions to Display” setting to reduce chart clutter.
In addition, the indicator plots:
Previous Day High (PDH) & Previous Day Low (PDL)
Previous Day Point of Control (PDPoC) – an approximate volume-weighted price computed from intraday data using a simple binning approach on a user-chosen lower timeframe.
Like the session levels, PDH/PDL/PDPoC start as solid lines. After the first touch, each level switches to a dashed style and continues only until the following trading day, at which point the previous day’s dashed lines are stopped and new levels are created.
Info Table & Multi-Timeframe Logic
An optional on-chart info table summarizes the most recent Opening Range:
OR high, low, and midline
Current OR range in points
Active mode (9:30 Bias vs. Entry Direction)
Current bias or entry-direction status
Whether a signal is “Waiting”, “Armed”, or “Triggered”
Whether the OR was built from the chart timeframe or from a 15-minute higher-timeframe feed
If your chart timeframe is higher than the OR calculation timeframe, the script automatically uses multi-timeframe data to build a consistent OR, while enforcing a maximum chart timeframe of 1-hour for reliability.
How to Use This Tool
Use the OR box and bias to define your primary intraday context around the cash open.
Use session highs/lows and PDH/PDL/PDPoC as objective reference levels for where price may react or where stops and liquidity might cluster.
Treat the signal markers and TP/SL boxes as visual guides only. They can help you structure trade ideas, but they are not a trading system by themselves.
Always confirm levels and signals with your own analysis, risk management, and execution rules.
Limitations & Notes
The script is intended for intraday charts up to 1-hour. By the nature of the information being displayed, any time frame above that may result is undesirable visual clutter.
The POC calculation is an approximation based on lower timeframe bar-level volume and binning; it is not a tick-by-tick volume profile.
Signals and levels update in real time on the current forming bar. Once a bar closes, completed historical signals do not repaint, but the last live bar can change until it closes.
The indicator does not use lookahead or offset plotting into the past; it is not designed to predict the future or guarantee any particular trading result.
Always test settings on a demo environment first and manage risk according to your own plan.

Bayesian Order Flow Predictor📌 Bayesian Order Flow Predictor — Advanced Probability Engine for Nasdaq and Futures
This indicator is a next-generation probabilistic forecasting system designed for Nasdaq traders who rely on Order Flow, Auction Market Theory, Value Area dynamics, market structure, DOM imbalance, and Bayesian probability models.
It combines 7 professional-grade factors (DOM, CVD, RSI, EMA trend, ATR volatility, Market Structure, Value Area positioning) into a unified Bayesian probability panel that outputs a clean bullish/bearish probability curve with high-confidence reversal and trend-continuation signals.
Engineered for scalpers, day traders, futures traders, and ICT-style order flow technicians, it delivers real-time directional probability, session-aware signals, and optional news-filter exclusion.
⭐ Features
Bayesian Probability Model (0–100%)
DOM imbalance scoring across dynamic depth levels
Cumulative Volume Delta (CVD) scoring
Market structure detection (HH/LL micro-trend shifts)
RSI momentum and overbought/oversold scoring
EMA directional bias + ATR-normalized deviation
Value Area positioning (VAH / VAL / POC) with optional previous-session mode
Session filtering (only signals during active hours)
Automated news filter (exclude signals around scheduled macro events)
Bull/Bear probability zones with background coloring
Anti-repetition system (no double signals in same direction)
Designed for future scalping, futures order flow, and high-precision timing
🧠 Bayesian Probability Engine — How It Works
The model evaluates 7 independent market factors simultaneously:
DOM imbalance
CVD pressure
Market structure
RSI deviation
EMA trend
Value Area position
ATR volatility shift
Each factor is transformed into a normalized score, multiplied by its weighting parameter, and aggregated into a global score.
This score is then passed through a Bayesian logistic function to convert uncertainty into a smooth probability curve, giving traders a clean, mathematically stable, and noise-resistant forecast.
📈 Buy & Sell Signal Logic
Signals trigger when:
Bullish Probability crosses above the user threshold
Bearish Probability crosses below the opposite threshold
Session is active
No protected news event is occurring
This avoids noise, prevents over-signaling, and focuses only on high-confidence inflection points.
🎯Fully compatible with the indicator: ➡️ AI Probabilistic Orderflow scalper
Both indicators synchronize perfectly when used together:
Bayesian panel → trend probability
Scalper v1 → timing + TP/SL engine
Together they create a complete probability-driven revenue management system for scalping Future.
📘 How to Use
Add the indicator to your chart
Set your trading session (e.g., 09:30–16:00 EST)
Adjust weights depending on your style (Order Flow / Momentum / Value Area)
Watch the probability curve:
Above threshold → bullish bias
Below threshold → bearish bias
Take signals when the curve crosses thresholds, not when flat
Combine with "AI Probabilistic Orderflow scalper" indicator for execution timing
Avoid high-impact news using the News Filter
💎 Advantages
Professional-grade Bayesian model
Works in all volatility regimes
Noise-resistant and smoother than traditional oscillators
Integrates Order Flow + Auction Theory + Momentum + Volatility
Perfect for NQ scalpers seeking an AI-style probability dashboard
Reduces emotional decision-making
Compatible with any execution strategy
Optimized for high winrate scalping and sniper entries

Prime Market Profile [xontrades1uae]
Automatic or custom tick calibration for gold, indices, or forex.
Highlighted POC, Value Area, and Initial Balance Range.
Smart visual clustering to detect congestion, breakout zones, and key volume nodes.
Compatible with short timeframes (1m–15m) for scalpers and day traders.
