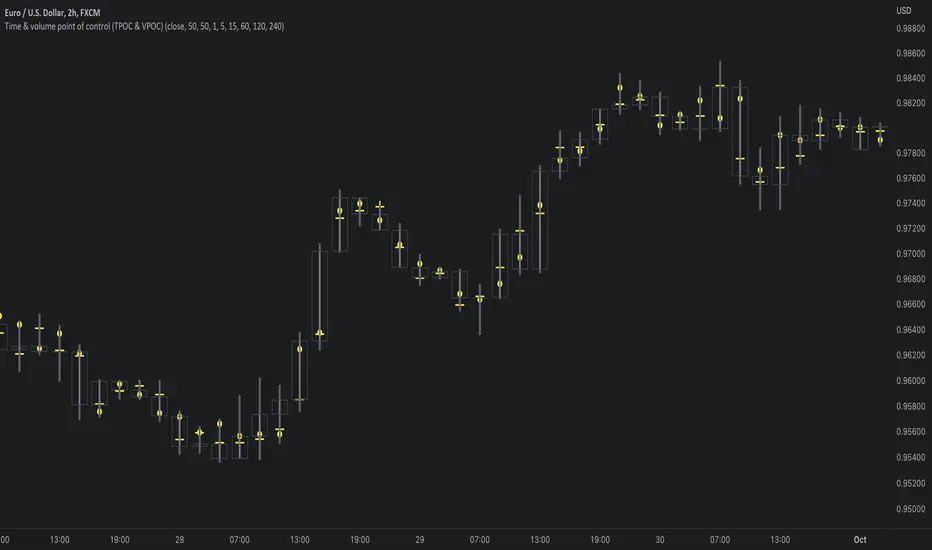
Time & volume point of control / quantifytoolsWhat are TPOC & VPOC?
TPOC (time point of control) and VPOC (volume point of control) are points in price where highest amount of time/volume was traded. This is considered key information in a market profile, as it shows where market participant interest was highest. Unlike full fledged market profile that shows total time/volume distribution, this script shows the points of control for each candle, plotted with a line (time) and a dot (volume). The script hides your candles/bars by default and forms a line in the middle representing candle range. In case of candles, borders will still be visible. This feature can be turned off in the settings.
Volume and time data are fetched from a lower timeframe that is automatically adjusted to fit the timeframe you're using. By default, the following settings are applied:
Charts <= 30 min: 1 minute timeframe
Charts > 30 min & <= 3 hours : 5 minute timeframe
Charts > 3 hours & <= 8 hours : 15 minute timeframe
Charts > 8 hours & <= 1D: 1 hour timeframe
Charts > 1D & <= 3D : 2 hour timeframe
Charts > 3D: 4 hour timeframe
Timeframe settings can be changed via input menu. The lower the timeframe, the more precision you get but with the cost of less historical data and slower loading time. Users can also choose which source to use for determining price for points of control, e.g. using close as source, the point of control is set to match the value of lower timeframe candle close. This could be replaced with OHLC4 for example, resulting in a point of control based on OHLC average.
To identify more profound points of market participant interest, TPOC & VPOC as percentage of total time/volume thresholds can be set via input menu. When a point of control is equal to or greater than the set percentage threshold, visual elements will be highlighted in a different color, e.g. 50% VPOC threshold will activate a highlight whenever volume traded at VPOC is equal to or greater than 50% of total volume. All colors are customizable.
VPOC is defined by fetching lower timeframe candle with the most amount of volume traded and using its close (by default) as a mark for point of control. For TPOC, each candle is divided into 10 lots which are used for calculating amount of closes taking place within the bracket values. The lot with highest amount of closes will be considered a point of control. This mark is displayed in the middle point of a lot:
How to utilize TPOC & VPOC
Example #1: Trapped market participants
One or both points of control at one end of candle range (wick tail) and candle close at the other end serves as an indication of market participants trapped in an awkward position. When price runs away further from these trapped participants, they are eventually forced to cover and drive price even further to the opposite direction:
Example #2: Trend initiation
A large move that leaves TPOC behind while VPOC is supportive serves as an indication of a trend initiation. Essentially, this is one way to identify an event where price traded sideways most of the time and suddenly moved away with volume:
Example #3: POC supported trend
A trend is healthy when it's supported by a point of control. Ideally you want to see either time or volume supporting a trend:
Search in scripts for "poc"
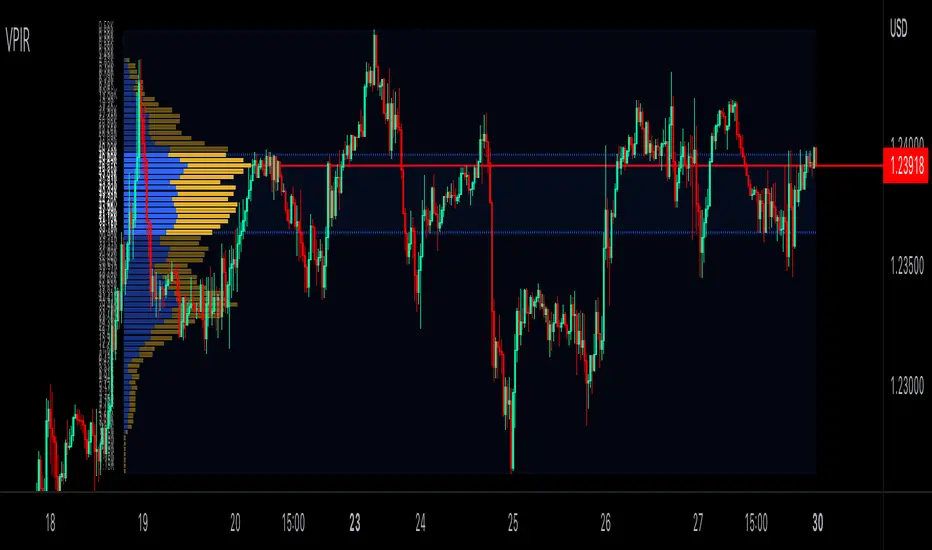
Volume Profile Interactive RangeVolume Profile Interactive Range (VPIR) is a brand new interactive VP enables you to analyze the market in depth.
Interactive mode lets you to set the duration(source) of VP intuitively.
PoC, VA(VAH&VAL) are fully supported.
VWAP Pack v1.00This script shows Volume Weighted Average Price (VWAP) from any TF in any TF chart. For example you can set 2 months VWAP in 30 minutes chart and see strong developing levels from higher TF. You can also switch on historical values. Together you can see 5 developing levels (POC, 2 first and 2 second standard deviation levels) and 5 historical levels from previous profile. Next levels you can use are Session open levels, which can be customized in any time you like (London open, NY open, ...) and you will see these periodicly on your chart. You can also fill the area between Point Of Control and Value Areas to see it more clearly. Last setting is High-Low of one session with changing Mean value in the middle.
send PM or visit website to get access

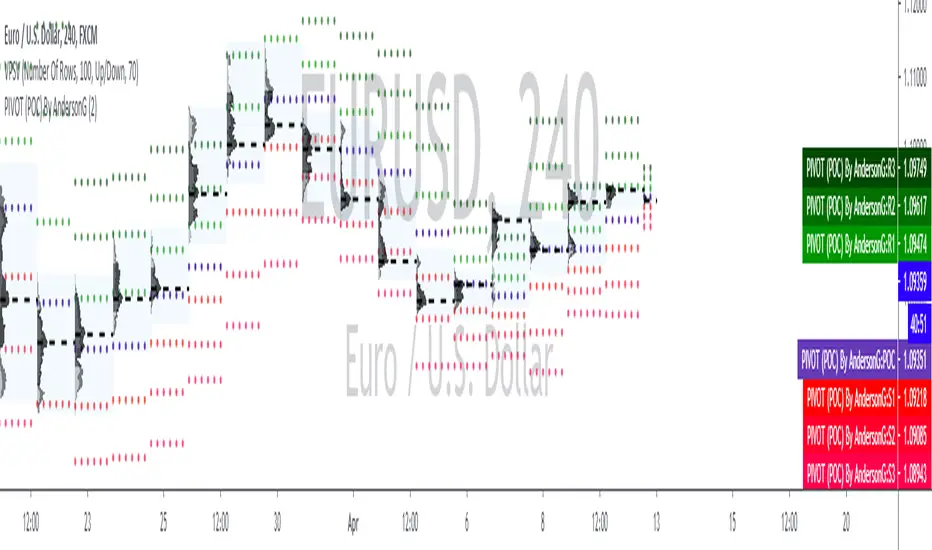
PIVOT (POC)By AndersonGPIVOT (POC) By AndersonG
DAILY...
The pivot point itself is simply the average of the high, low and closing prices from the previous trading day. On the subsequent day, trading above the pivot point is thought to indicate ongoing bullish sentiment, while trading below the pivot point indicates bearish sentiment.
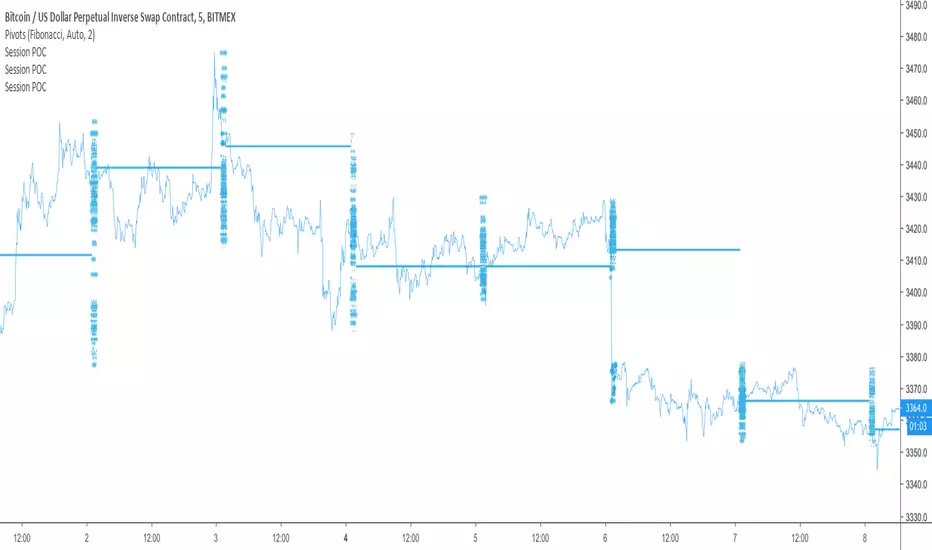
cPOC [Plot]This is a point of control script based between the length of two different conditions and the last time they were true (barssince() or whatever)
Been wanting to make this for a while simply because volume doesn't care about time, so why would a session based POC matter with that logic mind?
Will be improving on this more in time, just happy with the results of this prototype for now and figured it may be the first script I've ever made people will find useful so why not release it
This is the plots version (utilizing plot() instead of line.new) for longer lines and for the color change. Laggy if utilizing all the levels but my preferred version.
P.S. Thanks, Showerhead. You're finally cool

cPOC [Line]This is a point of control script based between the length of two different conditions and the last time they were true (barssince() or whatever)
Been wanting to make this for a while simply because volume doesn't care about time, so why would a session based POC matter with that logic mind?
Will be improving on this more in time, just happy with the results of this prototype for now and figured it may be the first script I've ever made people will find useful so why not release it
This is the lines version (utilizing line.new instead of plot()) for people who want a less laggy chart. Sacrifices the color flip for minimal lag and lines are much shorter.
P.S. Thanks, @paaax for the color switcher

Dynamic MP POC StrategyThis strategy is based on market profile poc changes- and money value zone relationship

Continuous Volume Profile v1.0This script is a continuous real time Volume Profile. Unlike the standard Volume Profile that focuses on fixed/visible range it will update and plot the following on every bar.
Point of Control (POC)
Value Area High (VAH)
Value Area Low (VAL)
You have the standard 3 parameters to configure:
Period Length
Number of Bins/Rows
Percent for Value Area
Please pm me if you would like to try the script.

PoCThis is a customized indicator that displays entries and stops directly on the chart:
The entries and stops are calculated using our Sublime Trading formula
The formula is unique to each instrument traded
poc by Jonathanhello community. welcome to my chat pattern detector. this is not a magic tool but a tool that you can use to analyse the market and also make sure you combine it with other indicators

POC-Candle-EMA-ATR-LongShadow-50percCandleThis is a script for those who trade based on volume and smart money strategies.
Some of the features of this script:
- Display "Time Price Opportunity Chart". These points help traders to identify price opportunities over time and have a better analysis of the market.
- Mark candles that have traded more volume than previous candles.
- Mark candles whose body is at least and not more than 50% of the total candle size, these candles can be found more easily in smart money strategies.
- Mark spike candles to find FVG faster
- Mark candles that have a shadow of at least more than 380 points and can be good reversal points.
- EMA indicator to check the market trend
- DonchianChannel indicator to check the price trend on the chart
Regards

POC bands 2.0 and other assorted goodiesI updated my old indicator that plotted a Kalman filter avg. of the bars inside a higher timeframe bar, to attempt to find the most frequent price in that bar's timespan.
It ended up being somewhat close, but not exact, but the result is that you get a pseudo-vwap without a need for volume data, that isn't cumulative and can indicate trend direction, or if the market's ranging.
This is very powerful information!
I highlight a trade setup we get here, derived from observing the indicator's slope and knowing how to read price action, assisted by rgmov and cci readings.
To get the code for the other indicator's you will have to click on share, and then on 'Make it mine' so you get the whole layout.
Good luck and hope you find these of use.
Cheers,
Ivan.

DeltaFlow Matrix═════════════════─────────
DELTAFLOW MATRIX - COMPLETE GUIDE
For 1-Minute Scalping
═════════════════─────────
───────────────────────────────────────
📊 VISUAL ELEMENTS EXPLAINED (What You See on the Chart)
───────────────────────────────────────
🟦🟥 RED/GREEN BARS ON THE RIGHT = Delta Flow Direction
The horizontal bars extending right from your chart show WHO controlled the price at each level. Green = bulls won, Red = bears won. Longer bars = more volume traded at that price. Example: If BTC is at $100,000 and you see a massive green bar, that means buyers aggressively absorbed all sell orders at that exact price level.
📊 GRADIENT BACKGROUND (Heat Map) = Volume Intensity
The colored background behind the bars shows volume concentration. Darker/more opaque = heavy trading, lighter/transparent = light trading. Example: A dark background at $99,800 means that's where most traders are positioned - it's a "magnet price" where BTC keeps returning.
🟩 GREEN BOX WITH BORDER = POC (Point of Control)
This is THE most important price on your chart - where the absolute highest volume traded. This is where the majority of traders are stuck. Example: POC at $99,950 means most BTC holders bought/sold there. Price will be magnetically pulled back to test this level repeatedly.
⬜ WHITE DOTTED LINES = VA High and VA Low (Value Area)
These lines contain 70% of all trading volume. Think of them as "fair price boundaries." Example: VA High at $100,200, VA Low at $99,700 means BTC's "fair value range" is $99,700-$100,200. Breakouts above/below these lines are significant moves.
💜 MAGENTA BORDER ON BARS = MICRO-SR (Micro Support/Resistance)
These magenta-outlined bars mark high-frequency support/resistance zones where price repeatedly bounced. These are your scalping zones. Example: MICRO-SR at $99,975 means BTC touched this price multiple times in the last 100 bars - it's a critical battle line for 1-minute scalpers.
🟡 GOLD TEXT "BULL EXHAUST" / "BEAR EXHAUST" = Exhaustion Zones
When one side dominated the volume BUT the trend is dying. This is where the big money got tired. Example: "BULL EXHAUST" at $100,100 means buyers pushed hard but are running out of steam - expect a reversal or consolidation soon.
🔵 CYAN TEXT "FLOW SHIFT ↑" / "FLOW SHIFT ↓" = Institutional Reversal
This is the holy grail - when delta completely flipped from bearish to bullish (or vice versa) with increasing volume. This marks where institutions changed their position. Example: "FLOW SHIFT ↑" at $99,900 means selling pressure just turned into aggressive buying - the big players reversed direction.
🟠 ORANGE TEXT "FAILED SHIFT ↑" / "FAILED SHIFT ↓" = Failed Institutional Reversal
When a FLOW SHIFT appears but then gets rejected by the opposite side within 3-10 bars. This means institutions TRIED to reverse but couldn't - the other side is defending hard. Example: "FAILED SHIFT ↑" at $99,900 means bulls attempted to take control but bears defended and stopped the reversal - this is a bearish sign, price likely continues down.
🟢 GREEN "COILED" LABEL BELOW PRICE = Bullish Compression Setup
When price is compressed below VA Low with 5+ MICRO-SR resistance levels stacked overhead AND bullish momentum is building. This is a spring-loaded long setup - price is coiled under resistance ready to explode upward. Example: BTC at $99,700, VA Low at $100,000, 7 MICRO-SR levels stacked from $100,100-$100,400, and delta shows +45 with bullish flow → "COILED" appears. This means price is compressed like a spring with bullish pressure building - when it breaks, it will rip through all those overhead levels fast.
🔴 RED "COILED" LABEL ABOVE PRICE = Bearish Compression Setup
When price is extended above VA High with 5+ MICRO-SR support levels stacked below AND bearish momentum is building. This is a spring-loaded short setup - price is coiled above support ready to crash downward. Example: BTC at $100,500, VA High at $100,200, 6 MICRO-SR levels stacked from $100,000-$99,700, and delta shows -52 with bearish flow → "COILED" appears. This means price is compressed with bearish pressure building - when it breaks down, it will slice through all those support levels.
🔴🟢 "REJECT" LABEL = Failed Breakout / Rejection
When price enters a cluster zone (resistance or support) but shows opposite momentum - the breakout attempt failed. Example: Price pushed up into overhead resistance at $100,200 but delta turns bearish (-38) → "REJECT" appears in red above price. This means the breakout attempt was rejected, bulls who entered are trapped, expect reversal down.
⚠️ "WALL ↑" / "WALL ↓" = Resistance/Support Wall Alert
When 5+ MICRO-SR levels are stacked together creating a "wall" of resistance or support. These are significant barriers where price will likely stall or reverse. Example: "WALL ↑ 7x" means there are 7 MICRO-SR resistance levels stacked above current price - breaking through this will be very difficult without strong momentum and volume.
🔴🟢 "BULL ATTACK" / "BEAR ATTACK" = Aggressive Momentum
One side is attacking with both high delta AND increasing volume. This is active warfare. Example: "BEAR ATTACK" at $100,050 means sellers are aggressively dumping with rising volume - price is likely to drop fast.
🛡️ "BULL DEFENSE" / "BEAR DEFENSE" = Holding the Line
One side has high delta but volume is flat or decreasing - they're defending a level, not pushing. Example: "BULL DEFENSE" at $99,850 means buyers are absorbing sells to prevent BTC from dropping further, but they're not strong enough to push up yet.
⚖️ "EQUILIBRIUM" / "ROTATION" = Balanced Market
Bulls and bears are equally matched - perfect for range trading, terrible for breakout trades. Example: "EQUILIBRIUM" at $100,000 means the market is perfectly balanced here - trade the range, don't chase breakouts.
📈📉 "UP" / "DN" ARROWS = Volume Trend
Small green "UP" or red "DN" labels show if volume is increasing or decreasing at that price level over time. Example: "UP" at $99,900 means more traders are entering positions at this price compared to earlier - this level is becoming more important.
⇈⇊ DOUBLE ARROWS = Delta Momentum Acceleration
These show when delta is accelerating rapidly - not just strong, but GETTING STRONGER. Example: ⇈ at $100,050 means bullish delta isn't just high, it's accelerating - expect explosive upward movement.
🟢🔴 VELOCITY BANDS (Horizontal bars far right) = Volume Acceleration
Thin horizontal bars extending from the profile show how fast volume is building. Green = volume accelerating up, Red = volume accelerating down. Example: Green velocity band at $100,100 means volume is spiking at this level right now - action is heating up.
💜 "x3.8" LABEL ABOVE CANDLE = Volume Spike Signal
Magenta text showing volume multiplier. Example: "x3.2" above a BTC candle means this candle had 3.2 times the average volume - something big just happened (news, liquidation cascade, whale entry).
🟢🔴 THICK LINE AT VA HIGH/LOW = Breakout with Momentum
When BTC breaks the VA line, the line changes:
- Thin line (width 2) = Weak breakout (<30Δ momentum)
- Medium line (width 3) = Medium breakout (30-60Δ)
- Thick dashed line (width 4) = STRONG breakout (>60Δ) - THIS IS THE FLASH
The label also changes: "VA High 72Δ V✓ STRONG" = 72 delta momentum, volume confirmed, strong breakout.
🔵 CYAN DASHED LINE AT POC = POC Bounce Flash
A short cyan dashed line appears when BTC bounces off the POC with a bullish reversal candle. This is your highest-probability long entry - the POC "magnet" just pulled price back and bulls are responding.
───────────────────────────────────────────────
🧠 PATTERN COMBINATIONS = Market Psychology (What Traders Are Thinking)
───────────────────────────────────────────────
🚀 PATTERN 1: "The Nitro Boost" (Highest Win Rate)
WHAT YOU SEE: FLOW SHIFT ↑ appears below current price + only MICRO-SR (magenta) levels above + Volume Spike (x2.5+)
PSYCHOLOGY: Big money just reversed from selling to buying. Retail still thinks it's going down. All the nearby resistance levels are weak (just micro-levels). The explosion in volume means someone BIG just entered.
EXAMPLE: BTC at $99,900, FLOW SHIFT ↑ just appeared, above you see MICRO-SR at $100,000, $100,050, $100,100 with no major resistance. Volume spike shows x3.1. → Institutions flipped bullish and the path of least resistance is UP. These MICRO-SR levels will be blown through like paper.
TRADE: Long immediately, targets at each MICRO-SR level, stop below the FLOW SHIFT price.
💎 PATTERN 2: "The Wall" (Reversal Setup)
WHAT YOU SEE: BULL/BEAR EXHAUST at a price level + Price approaching POC from above/below + Delta momentum arrows (⇊) pointing opposite to price movement
PSYCHOLOGY: One side pushed too hard and ran out of gas right as they're approaching the most important price level (POC). Delta momentum is reversing. The "wall" of volume at POC will reject them.
EXAMPLE: BTC pushed from $99,800 to $100,200, now "BULL EXHAUST" appears at $100,200. POC is at $100,000. You see ⇊ (bearish delta acceleration). → Bulls exhausted themselves pushing up, POC will act as resistance, bears are accelerating. Price will get rejected back down.
TRADE: Short at current price, target is POC at $100,000, stop above the exhaust level.
⚔️ PATTERN 3: "The War Zone" (Stay Out)
WHAT YOU SEE: BULL ATTACK and BEAR ATTACK labels alternating rapidly + EQUILIBRIUM or ROTATION at current price + VA lines very close together
PSYCHOLOGY: Bulls and bears are in full battle mode, neither side is winning. The market is chopping violently in a tight range. This is where retail gets destroyed by whipsaw.
EXAMPLE: BTC bouncing between $99,900-$100,100. "BULL ATTACK" at $100,000, "BEAR ATTACK" at $100,050, "EQUILIBRIUM" at $100,025. VA High at $100,100, VA Low at $99,900. → Pure chaos. Both sides throwing punches, nobody winning.
TRADE: STAY OUT. Wait for exhaustion or flow shift. If you must trade, use very tight ranges (buy at VA Low, sell at VA High, 5-tick stops).
🎯 PATTERN 4: "The Breakout Confirmation" (High Confidence)
WHAT YOU SEE: VA breakout with STRONG label + Volume spike (x2.0+) + FLOW SHIFT in breakout direction + No major resistance for 50+ ticks
PSYCHOLOGY: Every signal is aligned. Price broke the fair value range WITH strong momentum, WITH volume confirmation, WITH institutional flow reversal. This is the "perfect storm" breakout.
EXAMPLE: BTC breaks VA High at $100,200. Label changes to "VA High 68Δ V✓ STRONG" (thick dashed line). Volume spike shows x2.8. FLOW SHIFT ↑ appears at $100,210. Next resistance is MICRO-SR at $100,400. → This is as good as it gets. Institutions are buying, retail FOMO is coming, momentum is strong.
TRADE: Long on the breakout, targets at +100 ticks ($100,300), +200 ticks ($100,400), trail stop below the breakout candle.
🛡️ PATTERN 5: "The Failed Breakout" (Fade Setup)
WHAT YOU SEE: VA breakout with WEAK label + No volume spike + DEFENSE label appears (opposite side) + Delta momentum arrows pointing back into VA
PSYCHOLOGY: Price tried to break out but without conviction. No volume = no big players interested. The defending side is holding the line. Breakout traders are about to get trapped.
EXAMPLE: BTC breaks VA High at $100,200. Label shows "VA High 23Δ WEAK" (thin line). No volume spike. "BEAR DEFENSE" appears at $100,220. You see ⇊ (bearish acceleration). → Weak breakout, bears defending, momentum reversing. Bull breakout traders are trapped.
TRADE: Short the failed breakout, target is back inside VA (POC at $100,000), stop above the high.
🧲 PATTERN 6: "The POC Magnet" (Mean Reversion)
WHAT YOU SEE: Price far from POC (100+ ticks away) + Volume decreasing (DN arrows) + No ATTACK or FLOW SHIFT labels + MICRO-SR levels between current price and POC
PSYCHOLOGY: Price overextended from the most important level. No new aggressive volume is coming in. Market is tired. Like a rubber band, price will snap back to POC where most traders are positioned.
EXAMPLE: BTC at $100,350, POC at $100,000 (350 ticks away). "DN" arrows showing volume declining. "ROTATION" at current price. MICRO-SR at $100,300, $100,200, $100,100. → Overextended, running out of steam, POC will pull it back.
TRADE: Short with targets at each MICRO-SR level on the way down to POC, final target at POC itself.
💥 PATTERN 7: "The Liquidation Cascade" (Momentum Continuation)
WHAT YOU SEE: Multiple consecutive candles with volume spikes (x2.5+) + ATTACK label same direction + Delta momentum arrows same direction (⇈ or ⇊) + Breaking through MICRO-SR levels without stopping
PSYCHOLOGY: Liquidations are triggering more liquidations. Stop losses are getting hit, triggering more stop losses. This is a cascade - it won't stop until hitting POC or VA boundary. Retail is getting destroyed, institutions are feasting.
EXAMPLE: BTC drops from $100,200. Candles show x2.7, x3.1, x2.9 volume spikes. "BEAR ATTACK" at every level. ⇊ arrows accelerating. MICRO-SR levels at $100,100, $100,000, $99,900 all getting destroyed. POC at $99,750. → Liquidation cascade in progress. Won't stop until POC.
TRADE: If you're in the direction, hold until POC. If not in, wait for POC to enter counter-trend. DO NOT try to catch this knife early.
🔄 PATTERN 8: "The Reversal Confirmation" (Highest Probability Entry)
WHAT YOU SEE: POC Bounce Flash (cyan dashed line) + FLOW SHIFT in new direction + Volume spike + Price bouncing off POC with bullish/bearish engulfing candle
PSYCHOLOGY: Price hit the most important level (POC) and institutions just reversed direction. This is THE signal. The magnet worked, price came back to POC, and big money is now pushing it the other way.
EXAMPLE: BTC drops to POC at $100,000. Cyan dashed POC bounce flash appears. Bullish engulfing candle. "FLOW SHIFT ↑" appears. Volume spike x2.6. → Perfect reversal setup at the most important price level with institutional confirmation.
TRADE: Long at POC, target next MICRO-SR or VA High, stop below POC. This is your highest win-rate setup.
🎪 PATTERN 9: "The Fake-Out Trap" (Avoid or Fade)
WHAT YOU SEE: FLOW SHIFT appears + No volume spike + EXHAUST label appears within 3-5 candles same direction + Delta momentum arrows reverse
PSYCHOLOGY: Someone tried to fake a reversal (maybe a whale painting the tape) but there's no real follow-through. The move exhausted immediately. Traders who followed the FLOW SHIFT are about to get trapped.
EXAMPLE: "FLOW SHIFT ↑" appears at $99,950. No volume spike. Within 3 candles, "BULL EXHAUST" appears at $100,000. ⇊ arrows appear. → False reversal, trap set, traders entering longs are getting baited.
TRADE: Fade it. Short when exhaust appears, target back below the fake FLOW SHIFT level.
🏆 PATTERN 10: "The Perfect Storm Long" (All Systems Go)
WHAT YOU SEE: Price above POC + FLOW SHIFT ↑ + VA Low breakout with STRONG + Volume spike + Only MICRO-SR resistance above + BULL ATTACK label + ⇈ acceleration
PSYCHOLOGY: Everything aligned bullish. Institutions buying, momentum strong, volume confirming, path clear. This is when retail FOMO kicks in and you get the biggest moves.
EXAMPLE: BTC at $100,100. POC at $100,000 (above POC ✓). "FLOW SHIFT ↑" at $100,050 ✓. "VA Low 71Δ V✓ STRONG" breakout ✓. Volume x3.4 ✓. MICRO-SR at $100,300, $100,500 (weak resistance) ✓. "BULL ATTACK" ✓. ⇈ arrows ✓. → Every single bullish signal firing. This is the setup you wait for all day.
TRADE: Long with size, targets at +200 ticks minimum, trail aggressively, stop only if FLOW SHIFT reverses.
🎯 PATTERN 11: "The Coiled Spring" (High Probability Breakout)
WHAT YOU SEE: "COILED" label appears + 5-8 MICRO-SR levels stacked in breakout direction + Delta +30 or higher (for long) / -30 or lower (for short) + Price compressed below VA Low (long) or above VA High (short)
PSYCHOLOGY: Price is compressed in a weak position with heavy resistance/support overhead, BUT institutions are building momentum in the direction of the breakout. When it breaks, all those clustered MICRO-SR levels will be blown through rapidly because the spring is loaded. This is the setup where you get 100-200 tick moves in minutes.
EXAMPLE: BTC at $99,650. VA Low at $100,000. "COILED" (green) appears below price. WALL ↑ 8x showing 8 MICRO-SR levels from $100,100-$100,800. Delta shows +47. FLOW SHIFT ↑ just appeared. → Price is coiled below massive resistance wall with strong bullish momentum building. When VA Low breaks, the spring releases and price will rip through all 8 resistance levels.
TRADE: Long when price breaks VA Low with volume confirmation, targets at each MICRO-SR cluster (+100, +200, +300 ticks), trail stop below breakout candle. This is your "moonshot" setup.
🛑 PATTERN 12: "The Failed Shift Trap" (Fade Setup)
WHAT YOU SEE: "FAILED SHIFT ↑" or "FAILED SHIFT ↓" appears + Strong opposite momentum (⇊ for failed bull shift, ⇈ for failed bear shift) + No volume spike + Price back in original range
PSYCHOLOGY: Institutions attempted a reversal but the other side defended hard and rejected it. Traders who followed the FLOW SHIFT are now trapped. The failed reversal confirms the original trend will continue - the defending side is in control.
EXAMPLE: BTC pushed from $100,200 to $99,900. "FLOW SHIFT ↓" appeared at $100,100 signaling bearish reversal. Within 5 bars, bulls defended at $99,850, pushing price back to $100,000. "FAILED SHIFT ↓" now appears at $100,100 with ⇈ (bullish acceleration). → Bears tried to reverse trend but failed. Bulls defended successfully. Original uptrend continues.
TRADE: Fade the failed shift. If "FAILED SHIFT ↓" appears, go long (bulls won the battle). If "FAILED SHIFT ↑" appears, go short (bears won). Target is back to the other side of the range.
⚠️ PATTERN 13: "The Wall Collision" (High Risk, High Reward)
WHAT YOU SEE: "WALL ↑" or "WALL ↓" with 6+ levels + Price approaching wall with strong momentum (ATTACK label) + Volume spike + Delta accelerating (⇈ or ⇊)
PSYCHOLOGY: Unstoppable force meeting immovable object. Price is charging at a massive wall of resistance/support with strong momentum. Either it breaks through explosively OR it gets rejected violently. This is binary - huge win or huge loss.
EXAMPLE: BTC at $100,050 with "BULL ATTACK" and ⇈ arrows. Volume x3.2. Approaching "WALL ↑ 9x" at $100,200-$100,600. POC at $100,300 (inside the wall). → Bulls charging at massive resistance wall with strong momentum. If they break through, it's explosive. If rejected, crash back down.
TRADE: ADVANCED ONLY. Wait for the collision. If price breaks through wall with FLOW SHIFT confirmation + volume spike, go long immediately with tight stop. If price gets REJECTED (bearish delta appears at wall), short immediately targeting POC. DO NOT enter before knowing the outcome.
🔄 PATTERN 14: "The Rejection Reversal" (Counter-Trend Entry)
WHAT YOU SEE: "REJECT" label appears + Price in cluster zone + Opposite side DEFENSE or ATTACK label appears + Delta momentum reverses (⇈ to ⇊ or vice versa)
PSYCHOLOGY: The breakout failed, trapped traders are exiting, and the opposite side is now attacking the weak hands. This creates fast moves back in the original direction.
EXAMPLE: BTC breaks VA High to $100,250. Weak volume, delta only +22. Enters overhead MICRO-SR cluster. "REJECT" appears in red. "BEAR DEFENSE" appears at $100,280. ⇊ arrows appear. → Breakout failed, bulls trapped, bears attacking. Price will reverse fast.
TRADE: Counter-trend entry in direction of REJECT. Short when "REJECT" appears with bearish confirmation, target is back to POC or VA Low. Stop above the rejection high. Fast scalp.
───────────────────────────────────────────────────────────────────────────────
⚡ QUICK REFERENCE CHEAT SHEET
───────────────────────────────────────────────────────────────────────────────
SAFEST ENTRIES (Highest Win Rate):
✅ POC Bounce Flash + FLOW SHIFT (Pattern 8)
✅ FLOW SHIFT + Only MICRO-SR above + Volume Spike (Pattern 1)
✅ Strong VA Breakout + Volume Spike + FLOW SHIFT (Pattern 4)
✅ COILED label + Multiple stacked MICRO-SR + Delta >30 (Pattern 11)
DANGER ZONES (Stay Out):
⛔ BULL ATTACK + BEAR ATTACK alternating (Pattern 3)
⛔ FLOW SHIFT + No volume + Quick exhaust (Pattern 9)
⛔ EQUILIBRIUM at current price with tight VA range
⛔ WALL collision without clear direction (Pattern 13 - wait for outcome)
FADE/REVERSAL SETUPS:
🔄 EXHAUST at price level + Approaching POC (Pattern 2)
🔄 Weak VA Breakout + DEFENSE opposite side (Pattern 5)
🔄 Price far from POC + Volume declining (Pattern 6)
🔄 FAILED SHIFT appears + Opposite momentum (Pattern 12)
🔄 REJECT label + Opposite ATTACK/DEFENSE (Pattern 14)
HOLD/MOMENTUM CONTINUATION:
🚀 Multiple volume spikes + ATTACK label + ⇈/⇊ arrows (Pattern 7)
🚀 All bullish/bearish signals aligned (Pattern 10)
🚀 COILED spring release through wall (Pattern 11)
═══════════════════════════════════════════════════════════
Remember: The indicator shows you WHERE the big money is (POC), WHAT they're doing (FLOW SHIFT), and HOW HARD they're doing it (volume spikes, momentum). Your job is to follow the big money, not fight them. When institutions shift, you shift. When they exhaust, you fade. When they're in a war, you stay out. Trade with the whales, not against them.
════════════════════════════════════════════════════════════
═══════════════════════════════════════════════════════════════════════════════
ENHANCED DELTA VOLUME PROFILE - TECHNICAL CALCULATIONS GUIDE
How Each Element is Actually Calculated
═══════════════════════════════════════════════════════════════════════════════
───────────────────────────────────────────────────────────────────────────────
🧮 CORE CALCULATIONS (The Math Behind What You See)
───────────────────────────────────────────────────────────────────────────────
📊 VOLUME BINS = Price range divided into 40 horizontal slices
The indicator takes the last 100 candles (configurable), finds the highest and lowest price touched, then divides that range into 40 equal "bins" (horizontal price levels). Each bin collects volume from candles that touched that price range. Example: BTC ranged from $99,500 to $100,500 in the last 100 bars. That's $1,000 range ÷ 40 bins = $25 per bin. Bin 1 = $99,500-$99,525, Bin 2 = $99,525-$99,550, etc.
🟦🟥 DELTA CALCULATION = (Bull Volume - Bear Volume) / Total Volume × 100
For each bin, the indicator separates bullish candles (close > open) from bearish candles (close < open). Delta = ((bull volume - bear volume) / total volume) × 100. This gives you a percentage from -100% (pure selling) to +100% (pure buying). Example: At $100,000, if 70 BTC was traded on green candles and 30 BTC on red candles, delta = ((70-30)/100) × 100 = 40% bullish.
🎨 GRADIENT COLOR = Delta converted to color spectrum
The delta percentage (-100 to +100) is mapped to a color gradient. -100% = pure bearish color (orange/red), 0% = neutral, +100% = pure bullish color (cyan/blue). The color you see on each bar directly represents the delta. Example: A bright cyan bar = high positive delta (strong buying), orange bar = high negative delta (strong selling), gray bar = balanced (delta near 0%).
🟩 POC (Point of Control) = Bin with the absolute highest total volume
The indicator sums up all volume in each of the 40 bins, then finds which bin has the most. That's your POC. Example: Bin 15 (around $100,000) collected 1,250 BTC of volume, which is more than any other bin. Bin 15 is your POC. This is where the most trading happened and where most traders are positioned.
⬜ VALUE AREA (VA) = The bins containing 70% of total volume, centered on POC
Starting from the POC, the indicator expands up and down, adding bins one at a time (choosing the bin with more volume each time) until it has captured 70% of all volume. The top of this range = VA High, bottom = VA Low. Example: POC at $100,000. Expanding out captures 70% of volume from $99,700 to $100,300. VA Low = $99,700, VA High = $100,300.
📈📉 VOLUME TREND = (Recent Volume - Old Volume) / Total Volume
The indicator splits your 100-bar lookback into three periods: Recent (last 15 bars), Mid (bars 15-30), and Older (last 15 bars of the 100). For each bin, it compares recent volume to older volume. If recent > older, trend is UP. If recent < older, trend is DOWN. Example: At $100,000, recent 15 bars had 80 BTC volume, older 15 bars had 40 BTC. Trend = (80-40)/(80+40) = 0.33 = UP. This shows volume is increasing at this level.
💜 MICRO-SR DETECTION = High volume (>60% of max) + High hits (>20% of max) + Active volume trend
A bin becomes MICRO-SR if: (1) Its volume is at least 60% of the highest-volume bin, (2) Price touched it frequently (at least 20% as many times as the most-touched bin), (3) Volume trend isn't flat (absolute trend > 0.05). Example: Bin at $99,975 has 750 BTC (75% of max), was hit 45 times (30% of max hits), volume trend = 0.08. = MICRO-SR (magenta border).
🟡 EXHAUSTION DETECTION = Extreme delta (>65%) + Declining volume trend (<-0.15) OR Extreme delta + Volume spike (>1.5× average)
Two ways to detect exhaustion: (1) One side dominated (delta > 65% or < -65%) BUT volume is decreasing (trend < -0.15), meaning participation is dropping. (2) Extreme delta WITH a huge volume spike (>1.5× average for that bin), meaning climactic volume. Example: At $100,200, delta = 72% bullish, but volume trend = -0.22 (declining). = BULL EXHAUST. Bulls won but are running out of steam.
🔵 FLOW SHIFT DETECTION = Delta changed sign (+ to - or - to +) + Delta change >40% + Volume trend increasing (>0.1)
Compares each bin's delta to the previous bin's delta. If delta flipped from negative to positive (or vice versa) by more than 40%, AND volume is increasing, = FLOW SHIFT. Example: Previous bin at $99,950 had -35% delta (bearish). Current bin at $100,000 has +45% delta (bullish). Change = 80% (flipped + exceeded 40%), volume trend = +0.15. = FLOW SHIFT ↑.
⇈⇊ DELTA MOMENTUM = Current delta - Average delta of last 3 bins
For each bin, the indicator looks at the previous 3 bins, calculates their average delta, then compares current delta to that average. If current delta is significantly higher/lower than the 3-bin average, momentum arrows appear. Example: Last 3 bins had deltas of 20%, 25%, 30% (average = 25%). Current bin delta = 55%. Momentum = 55 - 25 = +30 = ⇈ (strong bullish acceleration).
🟢🔴 VOLUME ACCELERATION = Rate of change of volume trend across three periods
Compares how volume changed from Old→Mid vs Mid→Recent. If Recent increased MORE than Mid did compared to Old, = positive acceleration. Formula: ((Recent-Mid) - (Mid-Old)) / |Mid-Old|. Example: Old=100, Mid=120, Recent=160. Mid increased by 20, Recent increased by 40. Acceleration = (40-20)/20 = 1.0 = strong acceleration (green velocity band).
⚖️ BALANCE SCORE = Combines volume balance, price range balance, and hit frequency
Three factors weighted equally: (1) How balanced is bull vs bear volume? (1 - |bull-bear|/total). (2) How tight is the price range? (1 - avgRange/maxRange). (3) How frequently was it hit? (hits/maxHits). Multiply these together. Score >0.7 = EQUILIBRIUM. Example: Volume is 55% bull / 45% bear = 0.9 balance. Range is tight = 0.8. Hit frequently = 0.85. Score = 0.9 × 0.8 × 0.85 = 0.61 = ROTATION.
📊 BULL/BEAR ATTACK/DEFENSE = Delta threshold (>60% or <-60%) + Volume trend direction
ATTACK = High delta (>60% either direction) + Volume trend increasing (>0.15). DEFENSE = High delta (>60% either direction) + Volume trend NOT increasing (≤0.15). Example: Delta = 68% bullish, volume trend = 0.22 = BULL ATTACK (buying with increasing volume). Delta = 68% bullish, volume trend = 0.05 = BULL DEFENSE (buying but volume not increasing).
───────────────────────────────────────────────────────────────────────────────
🎯 SIGNAL CALCULATIONS (The New Features)
───────────────────────────────────────────────────────────────────────────────
💜 VOLUME SPIKE = Current bar volume / 20-bar average volume
Takes the current candle's volume and divides it by the simple moving average of the last 20 candles' volume. If ratio >2.0 (configurable), spike detected. The label shows the exact multiplier. Example: Current candle = 450 BTC volume. 20-bar average = 140 BTC. Ratio = 450/140 = 3.21 = "x3.2" label appears in magenta above the candle.
🟢🔴 VA BREAKOUT MOMENTUM = POC bin's delta (absolute value)
When price breaks VA High or VA Low, the indicator looks at the POC bin's delta to measure momentum strength. Uses absolute value (ignore direction). <30 = WEAK, 30-60 = MED, >60 = STRONG. Line thickness and style change based on this. Example: BTC breaks VA High. POC bin delta = 72%. Momentum = 72 = STRONG. Line = width 4 (thick), dashed (flash effect), label shows "VA High 72Δ V✓ STRONG".
📊 BREAKOUT LINE THICKNESS = Momentum-based dynamic sizing
- Momentum <30: Line width = 2 (thin), solid line
- Momentum 30-60: Line width = 3 (medium), solid line
- Momentum >60: Line width = 4 (thick), dashed line (creates flash effect)
Example: Breakout with 45% momentum = width 3 solid line. Breakout with 75% momentum = width 4 dashed line (flashing).
✓ VOLUME CONFIRMATION = Current volume / 20-bar average >1.5
Checks if the breakout candle has strong volume. If current volume is at least 1.5× the 20-bar average, adds "V✓" to the label. Example: Breakout candle has 280 BTC volume, 20-bar average is 160 BTC. Ratio = 280/160 = 1.75 > 1.5 = "V✓" appears in label.
🔵 POC BOUNCE DETECTION = Price within 0.5 bin-step of POC + Bullish reversal candle + Previous candle was bearish
Three conditions must all be true: (1) Current close price is within half a bin's height from POC price. (2) Current candle is bullish (close > open). (3) Previous candle was bearish (close < open). If all true = POC bounce, cyan dashed flash line appears. Example: POC at $100,000, bin step = $25. Current close = $100,008 (within $12.50 of POC ✓). Current candle green ✓. Previous candle red ✓. = POC Bounce Flash.
───────────────────────────────────────────────────────────────────────────────
⚙️ TECHNICAL PARAMETERS (What You Can Adjust)
───────────────────────────────────────────────────────────────────────────────
🔢 LOOKBACK PERIOD (Default: 100 bars) = How much history to analyze
The number of candles backwards from current that get analyzed. More bars = more stable but slower to react. Fewer bars = more reactive but noisier. For 1-minute BTC scalping, 100 bars = last 100 minutes = 1 hour 40 minutes of data. Example: Setting to 50 bars makes it more reactive to recent action but less stable. Setting to 200 bars makes it smoother but slower to show new developments.
🎚️ NUMBER OF BINS (Default: 40) = Resolution of price levels
How many horizontal slices to divide the price range into. More bins = finer resolution but more noise. Fewer bins = smoother but less precise. 40 bins for 1-minute = good balance. Example: With $1,000 range, 40 bins = $25 per level. 20 bins would be $50 per level (less precise). 60 bins would be $16.67 per level (more precise but noisier).
📏 DISPLAY OFFSET (Default: 10 bars) = How far right the profile extends
How many bars to the right of current candle the volume profile displays. Purely visual - doesn't affect calculations. Example: Offset = 10 means the profile extends 10 bars to the right. Offset = 30 means it extends further right (more separation from candles).
📊 VOLUME TREND PERIOD (Default: 15 bars) = How many recent bars define "recent"
The number of bars considered "recent" vs "old" when calculating volume trends. Shorter = more sensitive to very recent changes. Longer = smoother trends. Example: 15 bars means "recent" = last 15 candles (last 15 minutes on 1m chart). Setting to 5 would make it hyper-reactive to the last 5 minutes. Setting to 30 would make it smoother.
🎯 EXHAUSTION THRESHOLD (Default: 65%) = How extreme delta must be for exhaustion
The minimum delta percentage to trigger exhaustion detection. Higher = more selective (only extreme cases). Lower = more signals but more false positives. Example: 65% means delta must be >65% or <-65% to qualify. Setting to 75% would only catch the most extreme exhaustion. Setting to 55% would catch more cases.
💜 MICRO-LEVEL THRESHOLD (Default: 60%) = How strong a level must be for MICRO-SR
The minimum volume percentage (relative to max) required for MICRO-SR detection. Higher = fewer, stronger levels. Lower = more levels but weaker. Example: 60% means bin must have at least 60% of the max bin's volume. Setting to 70% would show only the strongest levels. Setting to 50% would show more levels.
⚡ DELTA MOMENTUM PERIOD (Default: 3 bars) = How many bins to average for momentum
How many previous bins to average when calculating delta momentum. Shorter = more sensitive acceleration signals. Longer = smoother, less noisy. Example: 3 bins means compares current to average of last 3. Setting to 5 would smooth out momentum detection. Setting to 2 would make it more reactive.
🌊 FLOW SHIFT SENSITIVITY (Default: 40%) = Minimum delta change for flow shift
How much delta must change between consecutive bins to trigger FLOW SHIFT. Lower = more flow shift signals (more sensitive). Higher = fewer, stronger signals. Example: 40% means delta must flip by at least 40% (e.g., from -20% to +20% or from +10% to -30%). Setting to 60% would only catch major reversals. Setting to 25% would catch smaller shifts.
💥 VOLUME SPIKE THRESHOLD (Default: 2.0x) = Multiplier to trigger spike signal
How many times above average volume must be to show the spike label. Higher = fewer spikes shown (only extreme). Lower = more spikes shown. Example: 2.0× means current volume must be at least double the 20-bar average. Setting to 3.0× would only show massive spikes. Setting to 1.5× would show more moderate spikes.
🚀 BREAKOUT MOMENTUM MINIMUM (Default: 20%) = Minimum delta for breakout signal
How much delta momentum required at POC for VA breakout to trigger. Higher = fewer breakout signals (more selective). Lower = more signals but more false positives. Example: 20% means POC delta must be at least 20% (or -20%) when price breaks VA. Setting to 30% would only show strong breakouts. Setting to 10% would show weaker breakouts too.
───────────────────────────────────────────────────────────────────────────────
🔬 ADVANCED TECHNICAL DETAILS
───────────────────────────────────────────────────────────────────────────────
📐 BIN POSITIONING = Price-to-bin mapping formula
For any price P, its bin index = floor((P - MinPrice) / BinStep). BinStep = (MaxPrice - MinPrice) / NumBins. Example: Range $99,000-$100,000, 40 bins. BinStep = $1,000/40 = $25. Price $99,550 → Bin 22: (99,550 - 99,000) / 25 = 22.
📊 VOLUME DISTRIBUTION = Proportional allocation across bins
When a candle spans multiple bins, its volume is distributed proportionally based on how much of the candle's range overlapped each bin. Example: Candle from $99,950 to $100,050 (range = $100) with 50 BTC volume. Bin 1 ($99,950-$99,975) gets 25% of range = 12.5 BTC. Bin 2 ($99,975-$100,000) gets 25% = 12.5 BTC. Bin 3 ($100,000-$100,025) gets 25% = 12.5 BTC. Bin 4 ($100,025-$100,050) gets 25% = 12.5 BTC.
🎨 COLOR GRADIENT MAPPING = Delta to RGB conversion
Delta percentage is normalized to 0-1 scale (from -100/+100 range), then mapped to RGB gradient. -100% (0.0) = Full bearish color RGB. 0% (0.5) = Neutral gray. +100% (1.0) = Full bullish color RGB. Example: Delta = 60% → Normalized = 0.8 → 80% towards full bullish color (bright cyan).
⚖️ BALANCE SCORE FORMULA = Weighted geometric mean
BalanceScore = (VolumeBalance^w) × (PriceBalance^w) × (HitBalance^w), where w=weight (default 1.0). VolumeBalance = 1 - |BullVol - BearVol|/TotalVol. PriceBalance = 1 - AvgRange/MaxRange. HitBalance = Hits/MaxHits. Example: Vol=0.9, Price=0.8, Hit=0.7 → Score = 0.9 × 0.8 × 0.7 = 0.504.
🔄 DELTA HISTORY TRACKING = Rolling array per bin
Each bin maintains an array of its last N delta values (where N = delta momentum period). When calculating momentum, current delta is compared to the average of this array. Example: Bin's delta history = . Average = 25%. Current = 55%. Momentum = 55 - 25 = 30.
📈 VOLUME VELOCITY = Second derivative of volume
Measures acceleration of volume change. Recent change = (Recent - Mid). Old change = (Mid - Old). Acceleration = (Recent change - Old change) / |Old change|. Positive = accelerating. Negative = decelerating. Example: Old=100, Mid=150, Recent=220. Recent change = 70. Old change = 50. Accel = (70-50)/50 = 0.4 = 40% acceleration.
🎯 VA EXPANSION ALGORITHM = Greedy breadth-first from POC
Start at POC bin. While accumulated volume < 70% of total: Look at bin above and bin below POC boundary. Choose whichever has more volume. Add that bin to VA. Repeat. Example: POC at bin 20. Bin 21 (above) has 80 BTC, Bin 19 (below) has 95 BTC. Add bin 19. Now VA = bins 19-20. Next: Bin 21 has 80, Bin 18 has 70. Add bin 21. VA = bins 19-21. Continue until 70% captured.
⏱️ REAL-TIME UPDATES = Recalculates on every new bar close
The entire profile recalculates when barstate.islast = true (current bar). All 40 bins are cleared and rebuilt from scratch using the last N candles. This ensures the profile is always accurate to the current market state. Example: On 1-minute chart, the profile fully recalculates every 60 seconds when the new candle opens.
🎨 RENDERING OPTIMIZATION = 500-bar future limit management
TradingView limits drawing objects to 500 bars into the future. The indicator calculates safe offsets: maxFutureBar = bar_index + 499, then caps all box/line/label positions to stay under this limit. Example: Current bar_index = 1000. Max future = 1499. Display offset wanted = 200. Safe offset = min(200, 400 - 100) = min(200, 300) = 200 ✓ safe.
───────────────────────────────────────────────────────────────────────────────
💡 INTERPRETATION TIPS
───────────────────────────────────────────────────────────────────────────────
🔢 Understanding Percentages:
- Delta 0-30%: Weak bias, essentially balanced
- Delta 30-60%: Moderate bias, one side has control
- Delta 60-85%: Strong bias, one side dominated
- Delta 85-100%: Extreme bias, one-sided market (exhaustion likely)
📊 Volume Trend Interpretation:
- Trend -1.0 to -0.3: Strong decline in participation
- Trend -0.3 to -0.1: Moderate decline
- Trend -0.1 to +0.1: Stable/flat volume
- Trend +0.1 to +0.3: Moderate increase
- Trend +0.3 to +1.0: Strong increase in participation
🎯 Balance Score Ranges:
- 0.0-0.3: Heavily imbalanced, strong directional bias
- 0.3-0.5: Moderate imbalance, rotation forming
- 0.5-0.7: Balanced rotation zone
- 0.7-1.0: Perfect equilibrium, range-bound
⚡ Momentum Thresholds:
- <10: Negligible momentum change
- 10-20: Moderate acceleration
- 20-40: Strong acceleration (arrow appears)
- >40: Extreme acceleration (very rare, very significant)
═══════════════════════════════════════════════════════════════════════════════
Understanding these calculations helps you know WHY the indicator is showing what it's showing. When you see "FLOW SHIFT ↑", you now know it calculated a >40% delta flip with increasing volume. When you see MICRO-SR, you know that level has >60% of max volume, >20% of max hits, and active participation. When you see ⇈, you know delta jumped significantly above its 3-bin average. Use this knowledge to trust the signals and understand their strength.
═══════════════════════════════════════════════════════════════════════════════

OutsiderEdge – Node Breach Engine (NBE)Overview – What is the Node Breach Engine (NBE)?
NBE is a swing/session volume-profile engine that builds profiles between pivots (or per session), tracks closed & developing POC, and prints breach signals when price challenges the control node. It quantifies node strength, buy/sell composition (CVD) at the POC and the entire profile, Value Area levels (VAH/VAL), VWAP distance, time at price, and introduces a PoV (Point of Void; the LVN located inside the Value Area): to highlight low-participation corridors where rotations or rejections often form. A lightweight EMA smoothed trend can optionally filter signals by prevailing bias.
Use it to answer fast: How strong is this node? Is the profile buy- or sell-led? Are we accepting/rejecting control? Is the developing POC migrating? Is the VA’s LVN (PoV) about to rotate back to POC or reject?
🔹 FEATURES
Volume Profile Core (Swing or Session)
Build pivot-to-pivot or session profiles with configurable row density and Value Area %.
Draw VAH/VAL with optional VA fill and optional profile window background.
Control Node (POC) – Closed & Developing
Closed POC highlighted on finished windows.
Developing POC path stitched bar-by-bar on the active segment (visual migration of control).
Optional POC row highlight and extend-until-touch behavior.
PoV – Point of Void
Detects the lowest-volume row within the current VA band (between VAL and VAH).
Plots a PoV anchor/line you can use as a rotation target or rejection boundary:
Rotations: VAH ↔ PoV (LVN) ↔ POC ↔ VAL.
Rejections: Thin participation at PoV often flips acceptance back toward POC.
Works alongside POC/VA to map acceptance vs. rejection with finer granularity than a single control node.
Node Context Tooltip (Deep Dive)
Compact tooltips on closed profiles: POC price, Node Strength % (POC/Total), CVD split (Buy%/Sell%), VWAP distance %, bars at price.
Profile Buy/Sell Overview (Stacked Bars)
Two stacked horizontal bars (Buy ▲ / Sell ▼) whose width matches the histogram and thickness is configurable.
Auto-placed above or below the profile using swing H/L logic.
Available for closed and developing profiles.
CVD at POC and Full-Profile
Quick labels for Buy% / Sell% at the POC.
Stacked bars summarize full-profile pressure at a glance.
Trend Context
Gradient EMA base vs. smoothed EMA wave for bull/bear bias.
Filter signals to trend direction (only ▲ in uptrend, only ▼ in downtrend).
Breach Signals with Practical Filters
Signals print when price touches/rejects the POC.
Filters: rejection close, ATR momentum guard, wick confirmation, ± margin tolerance, session time filter.
One-shot per bar; coded with object-limit hygiene.
Swing % Change Labels
Small labels at swing H/L showing % move across the last swing window.
Alerts
POC Breach Signal alert for automation/notifications.
🔹 USAGE
In the examples below, you see chart snapshot with labeled alerts/points of POV and POC rejections.
1 — Bearish POC Rejection (▼)
Price tags POC and closes below; ATR guard; EMA wave is bearish. Treat as trend-aligned continuation, reversals or risk tighten on longs.
2 — Bearish POV (LVN) Rejection (▼)
Price probes POV and fails to accept; low participation at PoV flips acceptance. Useful for rotation setups or partials.
3 — Bullish POV Rejection (▲)
Price tags POV and closes above; ATR guard; EMA wave is bullish. Treat as trend-aligned continuation, reversals or risk tighten on shorts.
Treat every signal as context, not as a command. The edge comes from combining location (POC/VA/PoV) with pressure (Node Strength/CVD/VWAP distance) and your structure/timing rules.
🔹 NAVIGATING MARKET CONDITIONS
Trending markets
Expect POC drift with trend; breaches tend to follow-through. Favor trend-aligned breaches; use PoV and VA for add/trim decisions.
Ranges
Frequent VA rotations VAH ↔ PoV ↔ POC ↔ VAL. Fades can work with tight invalidation; lean on PoV to avoid fighting acceptance near POC.
Regime shifts
Repeated failed breaches, PoV rejections, and developing POC re-anchoring are early tells. Adjust filters (ATR guard, wick) and window density as volatility changes.
🔹 SETTINGS SUMMARY
Profile Type: Swing / Session
Window: Present (developing) or Closed Profiles
Rows, lookback cap, Value Area %, optional background
Show POC (closed/developing), POC row highlight
VAH/VAL visibility, optional VA fill
Enable PoV detection (LVN inside VA).
Style controls; optional display with VA/POC.
Rejection close, ATR × multiplier, Wick % threshold, ± Margin %, Session time (trade inside/skip inside)
Enable EMA wave; lengths & smoothing
Toggle CVD; thickness (rows); colors; label text
Swing % change, tooltips, color controls
POC and POV Breach Alerts
🔹 GOOD PRACTICES
Think location + pressure: POC/VA/POV (where) × Node Strength/CVD/VWAP distance (how strong).
Align with HTF structure and liquidity; let POC/POV/VA act as decision levels (initiate, add, reduce, invalidate).
Calibrate row density per symbol/TF; too coarse = blind spots, too fine = noise.
Keep filters honest—if you must loosen them to force a trade, the setup isn’t there.
🔹 LIMITATIONS / DISCLAIMER
NBE does not use lookahead and does not repaint, but no indicator guarantees outcomes.
Node Strength, CVD, PoV, and thresholds are contextual, not signals on their own.
Use independent validation, position sizing, and strict risk management.
Trading involves substantial risk. This tool is for educational purposes only and is not financial advice. Past performance does not guarantee future results. You are solely responsible for your trading decisions and risk management.
Release Notes
v1.1 — PoV (Point of Void) & Profile CVD Bars
Added PoV = LVN inside Value Area as a dedicated anchor/line.
Added stacked profile Buy/Sell bars for closed & developing profiles (width-matched, thickness configurable).
Improved developing VA line/fill updates and object cleanup.
v1.0 — Initial invite-only
Swing/Session profiles; VAH/VAL + optional VA fill
Closed POC highlight + Developing POC path
Node Context Tooltip (POC price, Node Strength, CVD, VWAP distance, bars at price)
EMA wave (trend filter) + breach filters (rejection, ATR guard, wick, time, ± margin)
POC Breach Signal alert & price-panel markers

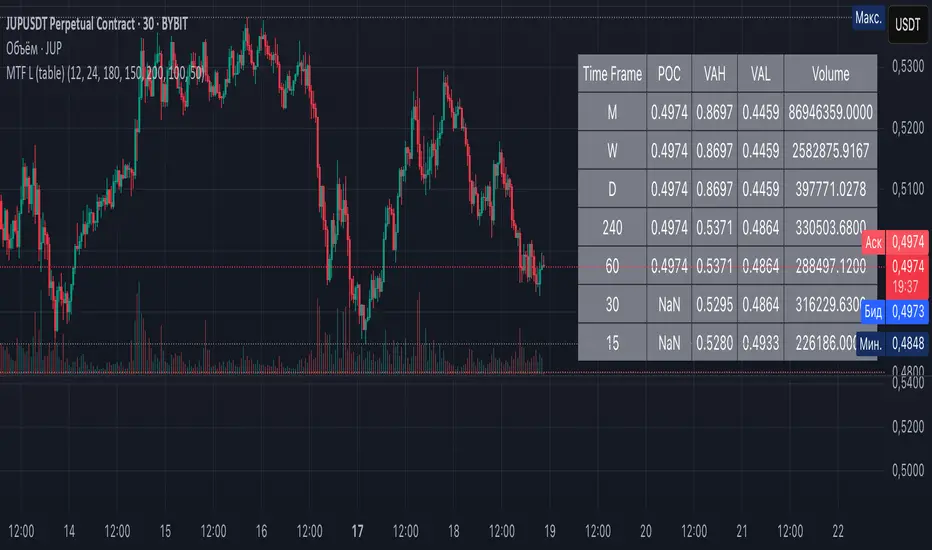
Multi-Timeframe Liquidity Zones V6 (Table)Multi-Timeframe Liquidity Zones V6 (Table) Indicator: Functionality and Uses
Overview: The Multi-Timeframe Liquidity Zones V6 (Table) indicator is a technical analysis tool that highlights key volume-based support and resistance levels across multiple timeframes. It leverages volume profile concepts – specifically the Point of Control (POC) and Value Area High/Low (VAH/VAL) – to identify “liquidity zones” where trading activity was heaviest . Unlike a standard single-timeframe volume profile, this indicator compiles data from several timeframes (e.g. monthly, weekly, daily, intraday) and displays the results in a convenient table format on the chart. The goal is to give traders a consolidated view of important price levels (derived from volume concentrations) across different horizons, helping them plan trades with a broader market perspective.
Purpose and Functionality of the Indicator
Multi-Timeframe Analysis: The primary objective of this indicator is to simplify multi-timeframe analysis of volume distribution. Rather than manually checking volume profiles on separate charts for each timeframe, the tool automatically calculates the key levels for each selected timeframe and presents them together. This includes higher-level perspectives (like monthly or weekly volume hotspots) alongside shorter-term levels (daily or hourly), ensuring that traders don’t miss significant zones from any timeframe . By offering a broader perspective on support and resistance levels, multi-timeframe tools help improve risk management and signal confirmation , and this indicator is designed to provide that volume-based perspective at a glance.
Table Format Display: Multi-Timeframe Liquidity Zones V6 (Table) specifically presents the information as a table (as opposed to plotting lines on the chart). Each row in the table typically corresponds to a timeframe (for example, Monthly, Weekly, Daily, 4H, 1H, 30M, 15M), and the columns list the calculated POC, VAH, VAL, and possibly the average volume for that timeframe’s look-back period. By structuring the data in a table, traders can quickly read off the exact price levels of these liquidity zones without having to visually trace lines. This format makes it easy to compare levels across timeframes or note where multiple timeframes’ levels cluster near the same price – a sign of especially strong support/resistance. The indicator uses a user-defined number of bars or length of history for each timeframe to calculate these values (so you can adjust how far back it looks to define the volume profile for each period).
Objective: In summary, the functionality is geared toward identifying high-liquidity price zones across multiple time scales and presenting them clearly. These high-liquidity zones often coincide with areas where price reacts (stalls, reverses, or accelerates) because a lot of trading activity (hence, orders and volume) took place there in the past. The indicator’s objective is to alert the trader to those areas in advance. It effectively answers questions like: “Where are the major volume concentration levels on the 1-hour, daily, and weekly charts right now?” and “Are there overlapping volume-based support/resistance levels from different timeframes around the current price?” By compiling this information, the indicator helps traders incorporate context from multiple timeframes in their decision-making, without needing to flip through numerous charts.
Identifying Liquidity Zones with POC, VAH, and VAL
Liquidity Zones Defined: In market terms, a “liquidity zone” is an area of the chart where a significant amount of trading occurred, meaning high liquidity (many buyers and sellers exchanged volume there). These zones often act as support or resistance because past heavy trading indicates consensus or interest around those price levels. This indicator identifies liquidity zones through volume profile analysis on each timeframe’s recent price action. Essentially, it looks at the distribution of trading volume at different prices over the specified period and finds the value area – the range of prices that encompassed the majority of that volume (commonly around 70% of the total volume ). Within that value area, it pinpoints the Point of Control (POC), which is the single price level that had the highest traded volume (the peak of the volume profile) . The upper and lower boundaries of that high-volume range are marked as Value Area High (VAH) and Value Area Low (VAL) respectively . Together, the VAH and VAL define the liquidity zone where the market spent most of its time and volume, and POC highlights the most traded price in that zone.
• Point of Control (POC): The POC is the price level with the greatest volume traded for the given period. It represents the price at which the most liquidity was exchanged – effectively the market’s “center of gravity” for that timeframe’s trading activity . The indicator calculates the POC for each selected timeframe by scanning the volume at each price; the price with maximum volume is flagged as that timeframe’s POC. In the table, the POC might be highlighted or listed as a key level (sometimes traders color-code it or mark it for emphasis). Because so many positions were opened or closed at the POC, it often serves as a strong support/resistance. For example, if price falls to a major POC from above, traders expect buyers may step in there (since it was a popular buy/sell level historically), potentially causing a bounce. Conversely, if price breaks through a POC decisively, it may signal a significant shift in market acceptance.
• Value Area High (VAH) and Low (VAL): The VAH and VAL are the price boundaries of the value area, which is typically defined to contain about 70% of the total traded volume for the period . In other words, between VAH and VAL is where the “bulk” of trading occurred, and outside this range is where relatively less volume traded. The indicator derives VAH/VAL by accumulating volume from the highest-volume price (POC) outward until ~70% of volume is covered (this is a common method for volume profile value area). VAH is the top of this high-volume region and VAL is the bottom. These levels are important because they often act like support/resistance boundaries: when price is inside the value area, it’s in a high-liquidity zone and tends to oscillate between VAH and VAL; when price moves above VAH or below VAL, it’s leaving the high-volume zone, which can indicate a potential trend or imbalance (price entering a lower-liquidity area where it might move faster until finding the next liquidity zone). Traders watch VAH/VAL for signs of rejection or acceptance: for instance, a price rally that falters at VAH suggests that level is acting as resistance (sellers defending that high-volume area), whereas if price pushes above VAH, it may continue until the next timeframe’s zone or until it finds new interest. The Multi-Timeframe Liquidity Zones V6 indicator gives the VAH and VAL for each timeframe, essentially mapping out the upper and lower bounds of key liquidity zones at those scales.
How the Indicator Identifies These: Under the hood, the indicator likely uses historical price and volume data for each timeframe’s lookback window. For each timeframe (say the last 20 weekly bars for a weekly profile, last 100 daily bars for a daily profile, etc.), it constructs a volume profile (a histogram of volume at each price). From that distribution, it finds the POC (highest volume bin) and calculates VAH/VAL around it. The output is a set of numbers (price levels) that mark where those zones lie. In practice, if using the Lines version of this indicator, those levels are drawn as horizontal lines on the chart and labeled by timeframe (e.g., a line at 1.2345 labeled “D POC” for Daily POC) . In the Table version, those values are instead listed in text form. Either way, the identification process is the same – it’s finding the high-volume price regions on each timeframe and calling them out. By doing this for multiple timeframes concurrently, the indicator reveals how these liquidity zones from different periods relate to each other. For example, you might discover that a daily-chart value area overlaps with a weekly-chart POC, creating a particularly strong zone of interest. This kind of insight is hard to get from a single timeframe analysis alone.
Volume Profile Data Across Multiple Timeframes
Multiple Timeframes in One View: One of the biggest advantages of this indicator is the ability to see volume profile information from various timeframes side by side. Traders often perform multiple timeframe analysis to get a fuller picture — for instance, checking monthly or weekly levels for long-term context while planning a trade on a 4-hour chart. This indicator automates that process for volume-based levels. The table will typically list each chosen timeframe (which could be preset or user-selected). For each timeframe, you get the POC, VAH, VAL, and possibly an average volume metric. The “average volume” likely refers to the average volume per bar or the average volume traded over the profile’s duration for that timeframe, which gives a sense of how significant that period’s activity is. For example, a weekly profile might show an average volume of say 500k per week, versus a daily profile average of 80k per day – indicating the scale of trading on weekly vs daily. High average volume on a timeframe means its liquidity zones were formed with a lot of participation, possibly making them more reliable support/resistance. By comparing these, traders can gauge which timeframes had unusually high or low activity recently. The table format makes such comparisons straightforward.
Identification of Confluence: Because all the data is presented together, traders can quickly spot confluence or overlaps between timeframes. If two different timeframes show liquidity zones at similar price levels, that price becomes extremely noteworthy. For instance, suppose the indicator shows: a 1-hour POC at 1.1300, a 4-hour VAL at 1.1280, and a daily VAL at 1.1290. These are all in a tight range – effectively indicating a multi-timeframe liquidity zone around 1.1280–1.1300. A trader seeing this cluster in the table will recognize that as a strong support area, since multiple profiles from intraday to daily all suggest heavy trading interest there. Similarly, overlaps of VAH (resistance zone) from different timeframes could signal a strong ceiling. The multi-timeframe view prevents a trader from, say, going long into a major weekly POC above, or shorting when there’s a huge monthly value-area low just below – situations where awareness of higher timeframe volume structure can make the difference between a good and bad trade.
User Customization: The indicator is flexible in that you can typically adjust which timeframes to include and how many bars to use for each timeframe’s calculation. For example, one might configure it to calculate monthly levels using the past 12 monthly bars (1 year of data), weekly levels using the past 20 weeks, daily using 100 days, etc., depending on preference. By tuning the “bars count” or period length , the trader can focus on recent liquidity zones or incorporate more history if desired. Shorter lookback might catch more recent shifts in volume distribution (important if the market structure changed recently), while longer lookback gives more established levels. This customization ensures the indicator’s output can be tailored to different trading styles (short-term vs swing vs long-term investing). Regardless of settings, the multi-timeframe table allows simultaneous visibility of the chosen timeframes’ volume landscape. This comprehensive view is the core strength: it consolidates data that normally requires flipping through multiple charts.
Using the Liquidity Zones Data for Trading Decisions
Traders can use the information from the MTF Liquidity Zones V6 (Table) indicator in several practical ways to enhance their decision-making:
• Identify Support and Resistance: Each liquidity zone acts as a potential support or resistance area. For example, if the table shows a daily VAH at a certain level above the current price, that level might serve as resistance if the price rallies up to it (since it marks the top of a high-volume region where sellers might step in). Conversely, a weekly VAL below current price could act as support on a dip. By noting these levels in the table, a trader planning an entry or exit can anticipate where the price might stall or reverse. Essentially, you get a map of high-interest price levels from different timeframes, which you can mark on your trading chart for guidance.
• Plan Entries and Exits Around Key Levels: Many traders incorporate volume profile levels into their strategies, for instance: buying near VAL (betting that the value area will hold and price will revert upward), or selling/shorting near VAH (expecting the top of value to hold as resistance), or trading breakouts when price moves outside the value area. With the multi-timeframe table, one can refine these tactics by also considering higher timeframe levels. Suppose you see that on the 1-hour chart the price is just above its 1H POC, but the table indicates that just slightly above, there’s also the daily POC. You might delay a long entry until price clears that daily POC, because that could be a stronger intraday barrier. Or if you intend to take profit on a long trade, you might choose a target just below a weekly VAH since price may struggle to climb past that on the first attempt. The indicator thus acts as a guide for precision in entry/exit decisions, aligning them with where liquidity is high.
• Gauge Trend Strength and Directional Bias: By observing where current price is relative to these volume zones, traders can infer certain market conditions. For instance, if price is trading above the VAH of multiple timeframes’ value areas, it suggests the market is in a more bullish or overextended territory (price accepted above prior value), whereas if price is below multiple VALs, it’s in bearish or undervalued territory relative to recent history. If the price stays around a POC, it indicates consolidation or equilibrium (market comfortable at that price). Traders can use this context for bias – e.g., if price is above the weekly VAH, you might lean bullish but watch for potential pullbacks to that VAH level (now a support). If price is below the monthly VAL, you might avoid longs until it re-enters that value area. In essence, the liquidity zones provide context of value vs. price: is price trading within the high-volume areas (implying range-bound behavior) or outside them (implying a breakout or trending move)? This can prevent chasing trades at poor locations.
• Combine with Other Indicators/Analysis: It’s generally advised to not use any single indicator in isolation, and this holds true here. The liquidity zones from this indicator are best used alongside price action or other technical signals for confirmation . For example, if a bullish candlestick reversal pattern forms right at a confluence of a 4H VAL and Daily POC, that’s a stronger buy signal than the pattern alone. Or if an oscillator shows overbought exactly as price hits a weekly VAH, it adds conviction to a possible short. The indicator’s table basically gives you a shortlist of critical price levels; you can then watch how price behaves at those levels (via candlesticks, order flow, etc.) to make the final trade decision. Traders might set alerts for when price approaches one of the listed levels, or they might drop down to a lower timeframe to fine-tune an entry once a key zone is reached. By integrating this volume-based insight with trend analysis, chart patterns, or momentum indicators, one can make more informed and high-probability decisions rather than trading in the dark.
• Risk Management and Stop Placement: High-liquidity zones can also inform stop-loss placement. Ideally, you want your stop on the other side of a strong support/resistance. If you go long near a VAL, you might place your stop just below the VAL (since a move beyond that suggests the high-volume zone didn’t hold). If you short near a VAH, a stop just above the VAH or POC could be logical. Moreover, if multiple timeframes show overlapping zones, a stop beyond all of them could be even safer (albeit at the cost of a wider stop). The indicator helps identify those spots. It also warns you of where not to put a stop – for example, placing a stop-loss right at a POC might be unwise because price could gravitate to that POC repeatedly (due to its magnetic effect as a high-volume price). Instead, a trader might choose a stop beyond the far side of the value area. By using the table’s information, you can align your risk management with areas of high liquidity, reducing the chance of being whipsawed by normal volatility around heavily traded levels .
Benefits of the Multi-Timeframe Liquidity Zones Indicator
Using the Multi-Timeframe Liquidity Zones V6 (Table) indicator offers several key benefits for traders, ultimately aiming to streamline analysis and improve decision quality:
• Consolidated Key Levels: It provides a clear, consolidated view of crucial volume-driven levels from multiple timeframes all at once . This saves time and ensures you always account for major support/resistance zones that come from higher or lower timeframe volume clusters. You won’t accidentally overlook a significant weekly level while focused on a 15-minute chart, for example.
• Enhanced Multi-Timeframe Insight: By aligning information from long-term and short-term periods, the indicator helps traders see the “bigger picture” while still operating on their preferred timeframe. This multi-scale awareness can improve trade timing and confidence. You’re effectively doing multi-timeframe analysis with volume profiles in an efficient manner, which can confirm or caution your trade ideas (e.g., a trend looks strong on the 1H, but the table shows a huge monthly VAH just overhead – a reason to be cautious or take profit early).
• Improved Decision Making and Precision: Knowing where liquidity zones lie allows for more precise entries, exits, and stop placements. Traders can make informed decisions such as waiting for a pullback to a value area before entering, or taking profits before price hits a major POC from a higher timeframe. These decisions are grounded in objectively important price levels, potentially leading to higher probability trades and better risk-reward setups. It essentially enhances your strategy by adding a layer of volume context – you’re trading with an awareness of where the market’s interest is heaviest.
• Volume-Based Confirmation: Price alone can sometimes be deceptive, but volume tells the true story of participation. The liquidity zones indicator provides volume-based confirmation of support/resistance. If a price level is identified by this tool, it’s because significant volume happened there – adding weight to that level’s importance. This can help filter out false support/resistance levels that aren’t backed by volume. In other words, it highlights high-quality levels that many traders (and possibly institutions) have shown interest in.
• Adaptable to Different Trading Styles: Whether one is a scalper looking at intraday (15M, 5M charts) or a swing trader focusing on daily/weekly, the indicator can be configured to those needs. You choose which timeframes and how much data to consider. This means the concept of liquidity zones can be applied universally – from spotting intraday pivot levels with volume, to seeing long-term value zones on an investment. The consistent methodology of POC/VAH/VAL across scales provides a common framework to analyze any market and timeframe.
• Informed Risk Management: As discussed, the knowledge of multi-timeframe volume zones aids in risk management. By placing stops beyond major liquidity areas or avoiding trades that run into strong volume walls, traders can reduce the likelihood of whipsaw losses. It’s an extra layer of defense to ensure your trade plan accounts for where the market has historically found lots of interest (hence likely friction). This level of informed planning can be the difference between a well-managed trade and an avoidable loss.
In conclusion, the Multi-Timeframe Liquidity Zones V6 (Table) indicator serves as a powerful analytical aid, giving traders a structured view of where price is likely to encounter support or resistance based on volume concentrations across timeframes. Its functionality centers on identifying those liquidity zones (via POC, VAH, VAL) and presenting them in an easy-to-read format, while its ultimate purpose is to help traders make more informed decisions. By integrating this tool into their workflow, traders can more confidently navigate price action, knowing the objective volume-based landmarks that lie ahead. Remember that while these volume levels often coincide with strong S/R zones, it’s best to use them in conjunction with other technical or fundamental analysis for confirmation . When used appropriately, the indicator can streamline multi-timeframe analysis and enhance your overall trading strategy , giving you an edge in identifying where the market’s liquidity (and opportunity) resides.
Volume Profile VisionVolume Profile Vision - Complete Description
Overview
Volume Profile Vision (VPV) is an advanced volume profile indicator that visualizes where trading activity has occurred at different price levels over a specified time period. Unlike traditional volume indicators that show volume over time, this indicator displays volume distribution across price levels, helping traders identify key support/resistance zones, fair value areas, and potential reversal points.
What Makes This Indicator Original
Volume Profile Vision introduces several unique features not found in standard volume profile tools:
Dual-Direction Histogram Display:
Unlike conventional volume profiles that only show bars extending in one direction, VPV displays volume bars extending both left (into historical candles) and right (as a traditional histogram). This bi-directional approach allows traders to see exactly where historical price action intersected with high-volume nodes.
Real-Time Candle Highlighting: The indicator dynamically highlights volume bars that intersect with the current candle's price range, making it immediately obvious which volume levels are currently in play.
Four Professional Color Schemes: Each color scheme uses distinct gradient algorithms and visual encoding systems:
Traffic Light: Uses red (POC), green (VA boundaries), yellow (HVN), with grayscale gradients outside the value area
Aurora Glass: Modern cyan-to-magenta gradient with hot magenta POC highlighting
Obsidian Precision: Professional dark theme with white POC and electric cyan accents
Black Ice: Monochromatic cyan family with graduated intensity
Adaptive Transparency System: Automatically adjusts bar transparency based on position relative to value area, with special handling for each color scheme to maintain visual clarity.
Core Concepts & Calculations
Volume Distribution Analysis
The indicator divides the visible price range into user-defined price levels (default: 80 levels) and calculates the total volume traded at each level by:
Scanning back through the specified lookback period (customizable or visible range)
For each historical bar, determining which price levels the bar's high/low range intersects
Accumulating volume for each intersected price level
Optionally filtering by bullish/bearish volume only
Point of Control (POC)
The POC is the price level with the highest traded volume during the analyzed period. This represents the "fairest" price where most traders agreed on value. The indicator marks this with distinct coloring (red in Traffic Light, magenta in Aurora Glass, white in Obsidian Precision, cyan in Black Ice).
Trading Significance: POC acts as a strong magnet for price - markets tend to return to fair value. When price is away from POC, traders watch for:
Mean reversion opportunities when price is far from POC
Rejection signals when price tests POC from above/below
Breakout confirmation when price breaks through and holds beyond POC
Value Area (VA)
The Value Area encompasses the price range where a specified percentage (default: 68%) of all volume traded. This represents the range of "accepted value" by market participants.
Calculation Method:
Start at the POC (highest volume level)
Expand upward and downward, adding adjacent price levels
Always add the level with higher volume next
Continue until accumulated volume reaches the VA percentage threshold
Value Area High (VAH): Upper boundary of accepted value - acts as resistance
Value Area Low (VAL): Lower boundary of accepted value - acts as support
Trading Significance:
Price spending time inside VA indicates market equilibrium
Breakouts above VAH suggest bullish momentum shift
Breakdowns below VAL suggest bearish momentum shift
Returns to VA boundaries often provide high-probability entry zones
High Volume Nodes (HVN)
Price levels with volume exceeding a threshold percentage (default: 80%) of POC volume. These represent areas of strong agreement and consolidation.
Trading Significance:
HVNs act as strong support/resistance zones
Price tends to consolidate at HVNs before making directional moves
Breaking through an HVN often signals strong momentum
Low Volume Nodes (LVN)
Price levels within the Value Area with volume ≤30% of POC volume. These are zones price moved through quickly with minimal consolidation.
Trading Significance:
LVNs represent areas of rejection - price finds little acceptance
Price tends to move rapidly through LVN zones
Useful for setting stop-losses (below LVN for longs, above for shorts)
Can identify potential gaps or "air pockets" in the market structure
Grayscale POC Detection
A secondary POC detection system identifies the highest volume level outside the Value Area (with a 2-level buffer to avoid confusion). This helps identify significant volume accumulation zones that exist beyond the main value area.
How to Use This Indicator
Setup
Choose Lookback Period:
Enable "Use Visible Range" to analyze only what's on your chart
Or set "Fixed Range Lookback Depth" (default: 200 bars) for consistent analysis
Adjust Profile Resolution:
"Number of Price Levels" (default: 80) - higher = more granular analysis, lower = broader zones
Select Color Scheme:
Traffic Light: Best for clear POC/VA/HVN identification
Aurora Glass: Modern aesthetic for dark charts
Obsidian Precision: Professional trader preference
Black Ice: Minimalist single-color family
Visual Customization
Left Extension: How far back the left-side histogram extends into historical candles (default: 490 bars)
Right Extension: Width of the traditional histogram bars on the right (default: 50 bars)
Right Margin: Space between current price bar and histogram (default: 0 for flush alignment)
Left Profile Gap: Space between left-side histogram and candles (default: 0)
Trading Strategies
Strategy 1: Value Area Mean Reversion
Wait for price to move outside the Value Area (above VAH or below VAL)
Look for rejection signals (wicks, bearish/bullish candles)
Enter trades toward the POC
Take profits as price returns to POC or opposite VA boundary
Strategy 2: Breakout Confirmation
Identify when price is consolidating within the Value Area
Wait for a strong close above VAH (bullish) or below VAL (bearish)
Enter on the breakout or on first pullback to the VA boundary
Target previous HVNs or swing highs/lows outside the VA
Strategy 3: POC Support/Resistance
Watch for price approaching the POC level
If approaching from below, look for bullish reversal patterns at POC (support)
If approaching from above, look for bearish reversal patterns at POC (resistance)
Trade in the direction of the bounce with stops beyond the POC
Strategy 4: LVN Fast Movement Zones
Identify LVN zones within the Value Area (marked with "LVN" label)
When price enters an LVN, expect rapid movement through the zone
Avoid entering trades within LVNs
Use LVNs as confirmation of directional momentum
Alert System
The indicator includes 7 customizable alert conditions:
POC Touch: Alerts when price comes within 0.5 ATR of POC
VAH/VAL Touch: Alerts at Value Area boundaries
VA Breakout: Alerts on breakouts above VAH or below VAL
HVN Touch: Alerts when price contacts High Volume Nodes
LVN Entry: Alerts when entering Low Volume zones
POC Shift: Alerts when POC moves to a new price level
Reading the Profile
Price Labels (shown on the right side):
POC: Point of Control - highest volume price level
VAH: Value Area High - upper boundary of accepted value
VAL: Value Area Low - lower boundary of accepted value
LVN: Low Volume Node - expect fast movement through this zone
Color Intensity Interpretation:
Brighter colors = higher volume concentration
Dimmer colors = lower volume
Abrupt color changes = transition between volume zones
Gaps in the histogram = price levels with no trading activity
Technical Details
Volume Accumulation Logic:
For each bar in lookback period:
For each price level:
If bar's high/low range intersects price level:
Add bar's volume to that price level's total
Gradient Algorithm:
Traffic Light: Dual-range piecewise gradient (0-50% and 50-100% volume intensity)
Aurora Glass: Linear cyan-to-magenta interpolation
Obsidian Precision: Dark blue gradient with cyan highlights
Black Ice: Three-stage cyan intensity progression
Real-Time Updates:
The profile recalculates on every bar, including real-time tick data, ensuring the volume distribution always reflects current market structure.
Best Practices
Timeframe Selection: Use higher timeframes (4H, Daily) for swing trading, lower timeframes (5min, 15min) for day trading
Combine with Price Action: Volume profile shows WHERE, price action shows WHEN
Multiple Timeframe Analysis: Check daily VP for major levels, then drill down to intraday for entries
Volume Type Selection: Use "Bullish" volume in uptrends, "Bearish" in downtrends, or "Both" for complete picture
Adjust VA Percentage: 68% (default) captures one standard deviation; try 70% for tighter or 60% for broader value areas
Performance Notes
Maximum bars back: 5000 (handles deep historical analysis)
Maximum boxes: 500 (handles complex profiles)
Optimized calculation: Only recalculates on last bar for efficiency
Real-time capable: Updates as new ticks arrive

Hanzo Strategy - Volume & Smart Money📊 HANZO STRATEGY - Complete Description
## 🎯 Strategy Overview
The **Hanzo Strategy** is an advanced institutional trading system that combines Volume Profile analysis, Smart Money Concepts, and Price Action patterns to identify high-probability trade setups. This strategy is specifically designed for trading Gold (XAUUSD), NAS100, and US30 on the 15-minute timeframe.
---
## 🧠 Core Trading Philosophy
The Hanzo Strategy operates on the principle that **institutional money leaves footprints** in the market through:
- Volume accumulation at key price levels
- Liquidity sweeps and stop hunts
- Order block formations
- Strategic wick rejections at support/resistance
By identifying these institutional behaviors and combining them with precise volume analysis, the strategy aims to trade **with** the smart money, not against it.
---
## 🔑 Key Components
### 1️⃣ **Fixed Range Volume Profile (FRVP)**
- **What it does:** Analyzes the last 2 days of price action and calculates where the most volume traded
- **Point of Control (POC):** The price level with the highest trading volume - acts as a magnet for price
- **How we use it:** Price tends to revert to POC. When price is far from POC and starts moving toward it, we prepare for entries
- **Visual:** Yellow cross line on the chart marking the POC
### 2️⃣ **Wick Cluster Detection**
- **What it does:** Automatically identifies price levels where multiple candle wicks have rejected (2-6+ wicks)
- **Why it matters:** Multiple rejections at the same level indicate strong institutional support/resistance
- **Upper wick clusters:** Resistance zones where price was rejected downward
- **Lower wick clusters:** Support zones where price was rejected upward
- **Visual:** Dashed lines (red for resistance, green for support)
### 3️⃣ **Session Volatility Boxes**
- **London Session (8:00-16:00 UTC+3):** Captures European market volatility range
- **New York Session (13:30-20:00 UTC+3):** Captures US market volatility range
- **How we use it:** These ranges often act as support/resistance for the rest of the day
- **Visual:** Blue box for London, Orange box for New York
### 4️⃣ **Smart Money Zones**
**Order Blocks:**
- Strong institutional areas where banks and hedge funds placed large orders
- **Bullish Order Block:** Area where smart money bought heavily before a strong upward move
- **Bearish Order Block:** Area where smart money sold heavily before a strong downward move
- **Visual:** Green/Red filled boxes with "Bull OB" or "Bear OB" labels
**Liquidity Sweeps:**
- Price breaks above recent high or below recent low, then quickly reverses
- This is a "stop hunt" - institutions triggering retail stops before moving in the real direction
- **Bullish Sweep:** Price dips below support, grabs stops, then reverses up
- **Bearish Sweep:** Price pops above resistance, grabs stops, then reverses down
- **Visual:** Triangle markers (green up = bullish, red down = bearish)
### 5️⃣ **Engulfing Pattern Recognition**
- **Bullish Engulfing:** Large green candle fully engulfs the previous red candle - shows strong buying pressure
- **Bearish Engulfing:** Large red candle fully engulfs the previous green candle - shows strong selling pressure
- **How we use it:** Confirmation signal when combined with other factors
- **Visual:** Small circles below/above candles
### 6️⃣ **Trend Bias Indicator**
- Dynamically calculates market bias based on price position relative to POC
- **Bullish:** Price > 0.2% above POC
- **Neutral:** Price within 0.2% of POC
- **Bearish:** Price > 0.2% below POC
- **Visual:** Label at top of chart showing current bias
---
## 📈 Entry Signal Logic
The strategy generates **LONG** and **SHORT** signals based on confluence of multiple factors:
### 🟢 LONG ENTRY CONDITIONS:
1. **POC Break:** Price crosses above POC from below + Trend Bias is Bullish
**OR**
2. **Support Bounce:** Price touches a lower wick cluster + Bullish Engulfing pattern forms
3. **Additional Filter:** Trend Bias must NOT be Bearish
### 🔴 SHORT ENTRY CONDITIONS:
1. **POC Break:** Price crosses below POC from above + Trend Bias is Bearish
**OR**
2. **Resistance Rejection:** Price touches an upper wick cluster + Bearish Engulfing pattern forms
3. **Additional Filter:** Trend Bias must NOT be Bullish
---
## 🎯 Risk Management
### Stop Loss:
- **Calculation:** 2 × ATR(14) from entry price
- **Logic:** Uses Average True Range to adapt to current market volatility
- **Example:** If ATR = 10 points, stop loss is 20 points away
### Take Profit:
- **Calculation:** 3 × ATR(14) from entry price
- **Risk:Reward Ratio:** 1:1.5 (risking 2 ATR to make 3 ATR)
- **Example:** If ATR = 10 points, take profit is 30 points away
### Position Sizing:
- **Default:** 2% of account equity per trade
- **Adjustable:** Can be modified in strategy settings
---
## ⚙️ Strategy Settings & Customization
### Volume Profile Settings:
- **Lookback Days:** How many days to analyze (default: 2)
- **Profile Rows:** Resolution of volume calculation (default: 24)
- **POC Distance Threshold:** Minimum distance from POC for "far from POC" status (default: 0.3%)
### Wick Cluster Settings:
- **Min Wicks for Cluster:** How many wicks needed to form a cluster (default: 3)
- **Lookback Bars:** How far back to search for wicks (default: 50)
- **Tolerance %:** How close wicks must be to cluster together (default: 0.15%)
### Session Settings:
- **London Session:** 08:00-16:00 (adjustable)
- **New York Session:** 13:30-20:00 (adjustable)
- **UTC Offset:** Timezone adjustment (default: +3)
### Smart Money Settings:
- **Order Block Lookback:** How far back to search for order blocks (default: 20)
- **Toggle On/Off:** Can enable/disable order blocks and liquidity sweeps independently
---
## 📊 Performance Metrics Display
The strategy includes a real-time **Information Table** (top-right corner) showing:
| Metric | Description |
|--------|-------------|
| **Trend Bias** | Current market direction (Bullish/Neutral/Bearish) |
| **POC Price** | Current Point of Control price level |
| **Distance from POC** | How far current price is from POC (%) |
| **ATR (14)** | Current volatility measurement |
| **High Wick Clusters** | Number of resistance clusters detected |
| **Low Wick Clusters** | Number of support clusters detected |
| **Current Signal** | Active signal (LONG/SHORT/None) |
---
## 🚨 Alert System
The strategy can send alerts for:
1. **LONG Signal Triggered** - When all conditions met for long entry
2. **SHORT Signal Triggered** - When all conditions met for short entry
3. **Price Touching Support Cluster** - Warning that price at key support
4. **Price Touching Resistance Cluster** - Warning that price at key resistance
**Alert Frequency:** Once per bar (prevents spam)
---
## 📅 Best Trading Timeframes & Instruments
### ✅ Recommended Timeframes:
- **Primary Entry:** 15-minute chart
- **Trend Confirmation:** 30-minute or 1-hour chart
- **Higher Timeframe Filter:** 4-hour for major trend direction
### ✅ Recommended Instruments:
1. **Gold (XAUUSD)** - High volatility, respects key levels well
2. **NAS100 (US Tech 100)** - Strong trends, good liquidity
3. **US30 (Dow Jones)** - Reliable institutional participation
4. **EUR/USD, GBP/USD** - Can work on major forex pairs with adjustments
### ⏰ Best Trading Sessions:
- **London Open (08:00-12:00 UTC+3)** - High volatility, clear directional moves
- **New York Open (13:30-17:00 UTC+3)** - Strongest moves, highest volume
- **Overlap (13:30-16:00 UTC+3)** - Best liquidity and movement
### ⚠️ Avoid Trading:
- Asian session (low volatility)
- Major news events (first 15 minutes after high-impact news)
- Sundays and holidays (low liquidity)
---
## 💡 Pro Trading Tips
### 1. **Multiple Timeframe Confirmation**
- Check 1-hour chart for overall trend before taking 15-minute signals
- Only take LONG signals if 1-hour is bullish
- Only take SHORT signals if 1-hour is bearish
### 2. **POC Strategy**
- Best entries occur when price returns to POC after being far away
- Wait for POC touch + confirmation pattern (engulfing, order block)
- POC acts as support in uptrends, resistance in downtrends
### 3. **Wick Cluster Strategy**
- Strongest signals occur when wick clusters align with POC
- Look for 4+ wicks at the same level for highest probability
- Recent clusters (formed in last 2 days) are stronger than old ones
### 4. **Order Block Strategy**
- Fresh order blocks (just formed) are more powerful
- Wait for price to return to order block zone before entering
- Best when order block + wick cluster occur at same level
### 5. **London/NY Box Strategy**
- If price breaks above session high → look for LONG pullback entries
- If price breaks below session low → look for SHORT pullback entries
- Price often returns to session mid-point before continuing
### 6. **Risk Management Rules**
- **Never risk more than 2% per trade**
- **Don't trade more than 3 positions simultaneously**
- **If 2 losses in a row, reduce size to 1% or stop for the day**
- **Move stop to breakeven after 1:1 profit reached**
### 7. **High-Probability Setups**
Look for **CONFLUENCE** - the more factors aligned, the better:
✅ **BEST LONG SETUP:**
- Price at lower wick cluster (support)
- Price at/near POC
- Bullish order block present
- Bullish engulfing pattern forms
- Trend Bias = Bullish
- 1-hour chart = uptrend
✅ **BEST SHORT SETUP:**
- Price at upper wick cluster (resistance)
- Price at/near POC
- Bearish order block present
- Bearish engulfing pattern forms
- Trend Bias = Bearish
- 1-hour chart = downtrend
---
## 📈 Performance Expectations
### Typical Win Rate:
- **Conservative Trading (high confluence only):** 55-65% win rate
- **Moderate Trading (good setups):** 45-55% win rate
- **Aggressive Trading (all signals):** 35-45% win rate
### Typical Risk:Reward:
- **Average R:R:** 1:1.5 (with 2 ATR stop and 3 ATR target)
- **Breakeven adjusted:** Often improves to 1:2+ when stop moved to BE
### Monthly Trade Frequency (15M chart):
- **Gold:** 60-100 signals per month
- **NAS100:** 50-80 signals per month
- **US30:** 40-70 signals per month
---
## 🎓 Strategy Philosophy Summary
The Hanzo Strategy is built on three core principles:
1. **Follow the Volume** - Trade where institutions are active
2. **Respect the Levels** - Key support/resistance zones matter
3. **Confirm with Price Action** - Wait for confirmation before entering
This is NOT a holy grail - it requires:
- ✅ Discipline to wait for proper setups
- ✅ Patience to let trades play out
- ✅ Risk management to protect capital
- ✅ Emotional control to handle losses
---
## 🛠️ How to Use This Strategy
### Step 1: Initial Setup
1. Add strategy to 15-minute chart
2. Check that all components are visible (POC, clusters, boxes, etc.)
3. Adjust colors if needed for your chart theme
### Step 2: Daily Routine
1. **Pre-Market (before 8:00 AM):**
- Check POC location
- Note wick clusters from previous days
- Mark London/NY session boxes from yesterday
2. **London Session (8:00-16:00):**
- Watch for POC interactions
- Monitor for order blocks forming
- Wait for confluence setups
3. **NY Session (13:30-20:00):**
- Highest activity period
- Best signal quality
- More aggressive entries allowed
### Step 3: Trade Execution
1. Wait for signal label (LONG or SHORT) to appear
2. Check confluence factors (minimum 3)
3. Enter immediately or on next candle
4. Set stop loss at 2 × ATR from entry
5. Set take profit at 3 × ATR from entry
6. Move stop to breakeven at +1.5 ATR profit
### Step 4: Trade Management
- **Don't move stop closer** (let trade breathe)
- **Can trail stop** after 2:1 profit reached
- **Can take partial profits** at 1.5:1 and let rest run
- **Journal every trade** for future improvement
---
## ⚠️ Important Disclaimers
1. **Past performance does not guarantee future results**
2. **This strategy involves risk** - only trade with money you can afford to lose
3. **Backtest thoroughly** on your specific instruments before live trading
4. **Start small** - test with minimum position sizes first
5. **Market conditions change** - what works today may not work tomorrow
6. **Use proper risk management** - this is the #1 key to long-term success
---
## 🎯 Quick Reference Checklist
Before taking any trade, ask yourself:
- ✅ Is there a clear LONG or SHORT signal?
- ✅ Are we in London or NY session?
- ✅ Is price at/near POC or wick cluster?
- ✅ Is trend bias aligned with my direction?
- ✅ Is there an order block or engulfing pattern?
- ✅ Is my risk:reward at least 1:1.5?
- ✅ Am I risking no more than 2% of my account?
**If 5+ are YES → Take the trade!**
**If 3 or fewer YES → Skip and wait for better setup!**
---
## 🚀 Final Words
The Hanzo Strategy is a professional-grade trading system that combines institutional analysis with precise technical execution. Success comes not from taking every signal, but from taking only the **highest probability setups** with proper risk management.
**Trade smart. Trade safe. Trade like an institution.**
📊 **Good luck and profitable trading!** 📊

Dual Volume Profiles: Session + Rolling (Range Delineation)Dual Volume Profiles: Session + Rolling (Range Delineation)
INTRO
This is a probability-centric take on volume profile. I treat the volume histogram as an empirical PDF over price, updated in real time, which makes multi-modality (multiple acceptance basins) explicit rather than assumed away. The immediate benefit is operational: if we can read the shape of the distribution, we can infer likely reversion levels (POC), acceptance boundaries (VAH/VAL), and low-friction corridors (LVNs).
My working hypothesis is that what traders often label “fat tails” or “power-law behavior” at short horizons is frequently a tail-conditioned view of a higher-level Gaussian regime. In other words, child distributions (shorter periodicities) sit within parent distributions (longer periodicities); when price operates in the parent’s tail, the child regime looks heavy-tailed without being fundamentally non-Gaussian. This is consistent with a hierarchical/mixture view and with the spirit of the central limit theorem—Gaussian structure emerges at aggregate scales, while local scales can look non-Gaussian due to nesting and conditioning.
This indicator operationalizes that view by plotting two nested empirical PDFs: a rolling (local) profile and a session-anchored profile. Their confluence makes ranges explicit and turns “regime” into something you can see. For additional nesting, run multiple instances with different lookbacks. When using the default settings combined with a separate daily VP, you effectively get three nested distributions (local → session → daily) on the chart.
This indicator plots two nested distributions side-by-side:
Rolling (Local) Profile — short-window, prorated histogram that “breathes” with price and maps the immediate auction.
Session Anchored Profile — cumulative distribution since the current session start (Premkt → RTH → AH anchoring), revealing the parent regime.
Use their confluence to identify range floors/ceilings, mean-reversion magnets, and low-volume “air pockets” for fast traverses.
What it shows
POC (dashed): central tendency / “magnet” (highest-volume bin).
VAH & VAL (solid): acceptance boundaries enclosing an exact Value Area % around each profile’s POC.
Volume histograms:
Rolling can auto-color by buy/sell dominance over the lookback (green = buying ≥ selling, red = selling > buying).
Session uses a fixed style (blue by default).
Session anchoring (exchange timezone):
Premarket → anchors at 00:00 (midnight).
RTH → anchors at 09:30.
After-hours → anchors at 16:00.
Session display span:
Session Max Span (bars) = 0 → draw from session start → now (anchored).
> 0 → draw a rolling window N bars back → now, while still measuring all volume since session start.
Why it’s useful
Think in terms of nested probability distributions: the rolling node is your local Gaussian; the session node is its parent.
VA↔VA overlap ≈ strong range boundary.
POC↔POC alignment ≈ reliable mean-reversion target.
LVNs (gaps) ≈ low-friction corridors—expect quick moves to the next node.
Quick start
Add to chart (great on 5–10s, 15–60s, 1–5m).
Start with: bins = 240, vaPct = 0.68, barsBack = 60.
Watch for:
First test & rejection at overlapping VALs/VAHs → fade back toward POC.
Acceptance beyond VA (several closes + growing outer-bin mass) → traverse to the next node.
Inputs (detailed)
General
Lookback Bars (Rolling)
Count of most-recent bars for the rolling/local histogram. Larger = smoother node that shifts slower; smaller = more reactive, “breathing” profile.
• Typical: 40–80 on 5–10s charts; 60–120 on 1–5m.
• If you increase this but keep Number of Bins fixed, each bin aggregates more volume (coarser bins).
Number of Bins
Vertical resolution (price buckets) for both rolling and session histograms. Higher = finer detail and crisper LVNs, but more line objects (closer to platform limits).
• Typical: 120–240 on 5–10s; 80–160 on 1–5m.
• If you hit performance or object limits, reduce this first.
Value Area %
Exact central coverage for VAH/VAL around POC. Computed empirically from the histogram (no Gaussian assumption): the algorithm expands from POC outward until the chosen % is enclosed.
• Common: 0.68 (≈“1σ-like”), 0.70 for slightly wider core.
• Smaller = tighter VA (more breakout flags). Larger = wider VA (more reversion bias).
Max Local Profile Width (px)
Horizontal length (in pixels) of the rolling bars/lines and its VA/POC overlays. Visual only (does not affect calculations).
Session Settings
RTH Start/End (exchange tz)
Defines the current session anchor (Premkt=00:00, RTH=your start, AH=your end). The session histogram always measures from the most recent session start and resets at each boundary.
Session Max Span (bars, 0 = full session)
Display window for session drawings (POC/VA/Histogram).
• 0 → draw from session start → now (anchored).
• > 0 → draw N bars back → now (rolling look), while still measuring all volume since session start.
This keeps the “parent” distribution measurable while letting the display track current action.
Local (Rolling) — Visibility
Show Local Profile Bars / POC / VAH & VAL
Toggle each overlay independently. If you approach object limits, disable bars first (POC/VA lines are lighter).
Local (Rolling) — Colors & Widths
Color by Buy/Sell Dominance
Fast uptick/downtick proxy over the rolling window (close vs open):
• Buying ≥ Selling → Bullish Color (default lime).
• Selling > Buying → Bearish Color (default red).
This color drives local bars, local POC, and local VA lines.
• Disable to use fixed Bars Color / POC Color / VA Lines Color.
Bars Transparency (0–100) — alpha for the local histogram (higher = lighter).
Bars Line Width (thickness) — draw thin-line profiles or chunky blocks.
POC Line Width / VA Lines Width — overlay thickness. POC is dashed, VAH/VAL solid by design.
Session — Visibility
Show Session Profile Bars / POC / VAH & VAL
Independent toggles for the session layer.
Session — Colors & Widths
Bars/POC/VA Colors & Line Widths
Fixed palette by design (default blue). These do not change with buy/sell dominance.
• Use transparency and width to make the parent profile prominent or subtle.
• Prefer minimal? Hide session bars; keep only session VA/POC.
Reading the signals (detailed playbook)
Core definitions
POC — highest-volume bin (fair price “magnet”).
VAH/VAL — upper/lower bounds enclosing your Value Area % around POC.
Node — contiguous block of high-volume bins (acceptance).
LVN — low-volume gap between nodes (low friction path).
Rejection vs Acceptance (practical rule)
Rejection at VA edge: 0–1 closes beyond VA and no persistent growth in outer bins.
Acceptance beyond VA: ≥3 closes beyond VA and outer-bin mass grows (e.g., added volume beyond the VA edge ≥ 5–10% of node volume over the last N bars). Treat acceptance as regime change.
Confluence scores (make boundary/target quality objective)
VA overlap strength (range boundary):
C_VA = 1 − |VA_edge_local − VA_edge_session| / ATR(n)
Values near 1.0 = tight overlap (stronger boundary).
Use: if C_VA ≥ 0.6–0.8, treat as high-quality fade zone.
POC alignment (magnet quality):
C_POC = 1 − |POC_local − POC_session| / ATR(n)
Higher C_POC = greater chance a rotation completes to that fair price.
(You can estimate these by eye.)
Setups
1) Range Fade at VA Confluence (mean reversion)
Context: Local VAL/VAH near Session VAL/VAH (tight overlap), clear node, local color not screaming trend (or flips to your side).
Entry: First test & rejection at the overlapped band (wick through ok; prefer close back inside).
Stop: A tick/pip beyond the wider of the two VA edges or beyond the nearest LVN, a small buffer zone can be used to judge whether price is truly rejecting a VAL/VAH or simply probing.
Targets: T1 node mid; T2 POC (size up when C_POC is high).
Flip: If acceptance (rule above) prints, flip bias or stand down.
2) LVN Traverse (continuation)
Context: Price exits VA and enters an LVN with acceptance and growing outer-bin volume.
Entry: Aggressive—first close into LVN; Conservative—retest of the VA edge from the far side (“kiss goodbye”).
Stop: Back inside the prior VA.
Targets: Next node’s VA edge or POC (edge = faster exits; POC = fuller rotations).
Note: Flatter VA edge (shallower curvature) tends to breach more easily.
3) POC→POC Magnet Trade (rotation completion)
Context: Local POC ≈ Session POC (high C_POC).
Entry: Fade a VA touch or pullback inside node, aiming toward the shared POC.
Stop: Past the opposite VA edge or LVN beyond.
Target: The shared POC; optional runner to opposite VA if the node is broad and time-of-day is supportive.
4) Failed Break (Reversion Snap-back)
Context: Push beyond VA fails acceptance (re-enters VA, outer-bin growth stalls/shrinks).
Entry: On the re-entry close, back toward POC.
Stop/Target: Stop just beyond the failed VA; target POC, then opposite VA if momentum persists.
How to read color & shape
Local color = most recent sentiment:
Green = buying ≥ selling; Red = selling > buying (over the rolling window). Treat as context, not a standalone signal. A green local node under a blue session VAH can still be a fade if the parent says “over-valued.”
Shape tells friction:
Fat nodes → rotation-friendly (fade edges).
Sharp LVN gaps → traversal-friendly (momentum continuation).
Time-of-day intuition
Right after session anchor (e.g., RTH 09:30): Session profile is young and moves quickly—treat confluence cautiously.
Mid-session: Cleanest behavior for rotations.
Close / news: Expect more traverses and POC migrations; tighten risk or switch playbooks.
Risk & execution guidance
Use tight, mechanical stops at/just beyond VA or LVN. If you need wide stops to survive noise, your entry is late or the node is unstable.
On micro-timeframes, account for fees & slippage—aim for targets paying ≥2–3× average cost.
If acceptance prints, don’t fight it—flip, reduce size, or stand aside.
Suggested presets
Scalp (5–10s): bins 120–240, barsBack 40–80, vaPct 0.68–0.70, local bars thin (small bar width).
Intraday (1–5m): bins 80–160, barsBack 60–120, vaPct 0.68–0.75, session bars more visible for parent context.
Performance & limits
Reuses line objects to stay under TradingView’s max_lines_count.
Very large bins × multiple overlays can still hit limits—use visibility toggles (hide bars first).
Session drawings use time-based coordinates to avoid “bar index too far” errors.
Known nuances
Rolling buy/sell dominance uses a simple uptick/downtick proxy (close vs open). It’s fast and practical, but it’s not a full tape classifier.
VA boundaries are computed from the empirical histogram—no Gaussian assumption.
This script does not calculate the full daily volume profile. Several other tools already provide that, including TradingView’s built-in Volume Profile indicators. Instead, this indicator focuses on pairing a rolling, short-term volume distribution with a session-wide distribution to make ranges more explicit. It is designed to supplement your use of standard or periodic volume profiles, not replace them. Think of it as a magnifying lens that helps you see where local structure aligns with the broader session.
How to trade it (TL;DR)
Fade overlapping VA bands on first rejection → target POC.
Continue through LVN on acceptance beyond VA → target next node’s VA/POC.
Respect acceptance: ≥3 closes beyond VA + growing outer-bin volume = regime change.
FAQ
Q: Why 68% Value Area?
A: It mirrors the “~1σ” idea, but we compute it exactly from empirical volume, not by assuming a normal distribution.
Q: Why are my profiles thin lines?
A: Increase Bars Line Width for chunkier blocks; reduce for fine, thin-line profiles.
Q: Session bars don’t reach session start—why?
A: Set Session Max Span (bars) = 0 for full anchoring; any positive value draws a rolling window while still measuring from session start.
Changelog (v1.0)
Dual profiles: Rolling + Session with independent POC/VA lines.
Session anchoring (Premkt/RTH/AH) with optional rolling display span.
Dynamic coloring for the rolling profile (buying vs selling).
Fully modular toggles + per-feature colors/widths.
Thin-line rendering via bar line width.

Point of Control + Momentum CandlesPOINT OF CONTROL + MOMENTUM CANDLES
A comprehensive technical analysis indicator combining volume-based Point of Control detection, momentum-graded candle coloring, higher timeframe buy/sell signals, and order block identification.
━━━━━━━━━━━━━━━━━━━━━━━━━━━━━━━━━━━━━━━━━━━━━━━━━━━━━━━━━━━━━━━━━━
WHAT THIS INDICATOR DOES
This indicator identifies key price levels where the most trading activity has occurred (Point of Control), colors candles based on momentum strength, generates buy/sell signals from a user-selected timeframe, and detects order blocks that may act as future support/resistance zones.
━━━━━━━━━━━━━━━━━━━━━━━━━━━━━━━━━━━━━━━━━━━━━━━━━━━━━━━━━━━━━━━━━━
FEATURES
1. POINT OF CONTROL (POC)
The POC represents the price level with the highest traded volume over a lookback period. This indicator calculates a volume profile by distributing volume across price levels and identifying where the most activity occurred.
- Orange horizontal line shows the current POC level
- Yellow box highlights the candles used in the POC calculation
- Break detection identifies when price closes decisively beyond the POC
- Rejection detection identifies when price tests but fails to break the POC
2. MOMENTUM CANDLE COLORING
Candles are colored based on a 6-level momentum system using EMA positioning and RSI values:
Bullish Levels (price above both EMAs):
- Bull Level 3 (Royal Blue): Strong momentum, RSI above 70
- Bull Level 2 (Cyan): Medium momentum, RSI above 60
- Bull Level 1 (Green): Weak momentum, above EMAs
Bearish Levels (price below both EMAs):
- Bear Level 1 (Yellow): Weak momentum, below EMAs
- Bear Level 2 (Orange): Medium momentum, RSI below 40
- Bear Level 3 (Red): Strong momentum, RSI below 30
Neutral (White): No clear directional momentum
3. BUY/SELL SIGNALS
Signals are generated from a user-selectable timeframe (default: 10 minutes) and appear on your current chart. This allows you to see higher timeframe signals while trading on lower timeframes.
Buy Signal Conditions:
- EMA crossover (fast crosses above slow) OR RSI exits oversold
- Bullish candle on the signal timeframe
- Close above both EMAs
Sell Signal Conditions:
- EMA crossunder (fast crosses below slow) OR RSI exits overbought
- Bearish candle on the signal timeframe
- Close below both EMAs
4. ORDER BLOCKS
Order blocks identify potential institutional entry zones that may act as future support or resistance.
- Bullish Order Block (Green zone): The last bearish candle before a bullish impulse move
- Bearish Order Block (Red zone): The last bullish candle before a bearish impulse move
- Blocks automatically extend forward and can be set to delete when mitigated (price closes through the zone)
5. DASHBOARD
A customizable info panel displays:
- Current POC price
- Distance from POC (percentage)
- Position relative to POC (Above/Below/At)
- Lookback period
- Current RSI value
- Current momentum level
- Signal timeframe
- Active order block count
━━━━━━━━━━━━━━━━━━━━━━━━━━━━━━━━━━━━━━━━━━━━━━━━━━━━━━━━━━━━━━━━━━
HOW TO USE
POC Trading:
- Watch for breaks above POC for potential long entries
- Watch for breaks below POC for potential short entries
- Rejections at POC can indicate reversal opportunities
Momentum Reading:
- Use candle colors to gauge trend strength at a glance
- Level 3 colors indicate strong momentum (potential continuation)
- Level 1 colors indicate weakening momentum (potential reversal)
- Neutral/white candles suggest consolidation or indecision
Signal Confirmation:
- Use buy/sell signals from a higher timeframe to confirm entries on your trading timeframe
- Combine signals with POC breaks/rejections for higher probability setups
Order Block Strategy:
- Look for price to return to bullish order blocks for potential long entries
- Look for price to return to bearish order blocks for potential short entries
- Mitigated blocks (price closes through) lose their significance
━━━━━━━━━━━━━━━━━━━━━━━━━━━━━━━━━━━━━━━━━━━━━━━━━━━━━━━━━━━━━━━━━━
SETTINGS OVERVIEW
POC Settings:
- Lookback Period: Number of bars for POC calculation (default: 20)
- Volume Resolution: Price level granularity (default: 50)
- Recalculation Frequency: How often POC updates (default: every 3 bars)
Break/Rejection Detection:
- Break Threshold: Minimum percentage move to confirm a break (default: 0.3%)
- Rejection Wick Ratio: Minimum wick-to-body ratio for rejections (default: 0.5)
Momentum Settings:
- Fast/Slow EMA lengths for trend determination
- RSI length and threshold levels for momentum grading
Buy/Sell Signals:
- Signal Timeframe: The timeframe used for signal calculation
- Separate EMA and RSI parameters for signal generation
Order Blocks:
- Order Block Timeframe: Timeframe for OB detection
- Max Blocks Per Side: Limits displayed order blocks
- Delete Mitigated: Automatically removes invalidated blocks
All visual elements (colors, sizes, line styles) are fully customizable.
━━━━━━━━━━━━━━━━━━━━━━━━━━━━━━━━━━━━━━━━━━━━━━━━━━━━━━━━━━━━━━━━━━
ALERTS
10 alert conditions are available:
- Bullish/Bearish POC Break
- Bullish/Bearish POC Rejection
- Any POC Break
- Any POC Rejection
- Buy Signal
- Sell Signal
- Bullish Order Block Formed
- Bearish Order Block Formed
━━━━━━━━━━━━━━━━━━━━━━━━━━━━━━━━━━━━━━━━━━━━━━━━━━━━━━━━━━━━━━━━━━
NOTES
- The indicator uses request.security() to fetch data from the signal and order block timeframes. This is designed to work when viewing charts at timeframes equal to or lower than your selected signal/OB timeframes.
- POC calculations are based on the visible volume data. Assets with limited volume data may produce less reliable POC levels.
- Order blocks are detected using a simplified algorithm based on candle patterns and displacement. They represent potential zones of interest, not guaranteed support/resistance levels.
━━━━━━━━━━━━━━━━━━━━━━━━━━━━━━━━━━━━━━━━━━━━━━━━━━━━━━━━━━━━━━━━━━
DISCLAIMER
This indicator is provided for educational and informational purposes only. It does not constitute financial advice or a recommendation to buy or sell any security. Trading involves substantial risk of loss. Past performance is not indicative of future results. Always conduct your own analysis and consider your risk tolerance before making trading decisions. Use this tool as part of a comprehensive trading strategy, not as a standalone signal generator.

Momentum Master v1# Momentum Master v1 - Multi-Strategy Trading System
## SCRIPT OVERVIEW
Momentum Master v1 is a multi-strategy trading system that integrates 6 distinct trading methodologies (EMA Crossover, RSI Mean Reversion, Breakout, MACD Crossover, Bollinger Bands, Volume Breakout) through a shared risk management pipeline. This script implements a proprietary integration framework that creates synergistic value beyond what individual indicators provide, combining advanced technical analysis techniques with institutional flow analysis.
## TECHNICAL METHODOLOGY
### Multi-Strategy Signal Generation Framework
The script operates on a shared execution framework where all six trading strategies share the same risk management system, but each strategy uses its own unique entry logic:
1. **EMA Crossover System**: Detects momentum shifts using configurable fast/slow EMA periods (Standard 9/21, Fast 7/17, Slow 13/26, or Custom)
2. **RSI Mean Reversion**: Identifies overbought/oversold conditions for counter-trend opportunities
3. **Breakout Detection**: Captures price breakouts from consolidation zones
4. **MACD Crossover**: Uses MACD line crossovers to confirm trend changes
5. **Bollinger Bands**: Trades bounces from band extremes and breakouts
6. **Volume Breakout**: Confirms moves with above-average volume
**Why This Integration Creates Unique Value:**
This is not a simple indicator mashup. The proprietary integration framework creates synergistic value through:
- **Shared Risk Management**: All strategies share ATR-based stop loss calculation and multiple take profit levels (TP1-TP6 with ratios 1:2, 1:4, 1:6, 1:8, 1:10, 1:12)
- **Adaptive Confidence Scoring**: The system evaluates market context from multiple perspectives simultaneously
- **Shared Filter System**: Optional filters (RSI extremes, ADX trend strength, Volume confirmation, POC proximity) apply uniformly across all strategies
## FLOW ANALYSIS INTEGRATION
### Fair Value Gap (FVG) Retracement Validation
The script implements proprietary FVG detection with retracement validation logic:
- **200-bar lookback** with **20% ATR tolerance** for gap identification
- **Retracement confirmation**: Signals can require price to retrace into a recent FVG before entry (optional filter)
- **Size filtering**: Only displays FVGs above minimum ATR threshold (configurable)
- **Visual tracking**: Shows last N FVGs with color-coded boxes (bullish green, bearish red)
**How FVG Integration Enhances Strategy Signals:**
When a strategy generates a signal, the FVG system validates whether price has recently retraced into an institutional order flow gap. This adds a layer of confirmation that the move is supported by institutional activity, not just retail momentum.
### Order Block Detection with Directional Alignment
- **Institutional accumulation/distribution zones**: Identifies the last bullish/bearish candle before a significant move
- **Directional filter**: Optional setting to only allow trades aligned with the most recent order block direction
- **ATR-based size filtering**: Filters out noise by requiring minimum order block size
- **Visual display**: Shows order blocks as colored boxes extending N bars forward
**Integration Logic:**
Order blocks represent areas where institutions accumulated or distributed positions. When a strategy signal occurs near an order block, it indicates higher probability that the move will continue in the block's direction.
### Multi-Timeframe POC (Point of Control) Analysis
The script calculates and displays POC levels from multiple timeframes:
- **Volume Profile POC**: Highest volume price over last N bars (configurable lookback)
- **Session POC**: Point of control for current trading session
- **Daily POC**: Daily volume-weighted average price
- **Weekly POC**: Weekly volume-weighted average price (optional)
**POC Proximity Filtering:**
Optional filters allow signals only when price is within X ATR of a POC level. This ensures entries occur at statistically significant price levels where liquidity is concentrated.
## FIBONACCI EXTENSION SYSTEM
### Dynamic Fibonacci Calculation
- **Swing-based detection**: Automatically identifies swing highs and lows using configurable lookback period
- **Extension levels**: Calculates Fibonacci extension levels (0.618, 0.786, 1.0, 1.272, 1.414, 1.618, 2.0, 2.618)
- **Retracement levels**: Shows standard retracement levels (0.236, 0.382, 0.5, 0.618, 0.786)
- **Negative levels**: Optional negative Fibonacci levels (-0.27, -0.618) for extended targets
**How Fibonacci Enhances Risk Management:**
Take profit levels are automatically calculated using Fibonacci extension mathematics. The system identifies the swing structure and projects potential reversal zones, allowing traders to set targets based on mathematical probability rather than arbitrary price levels.
## LIQUIDITY ZONE DETECTION
### Buy and Sell Side Liquidity
- **Swing-based liquidity zones**: Identifies recent swing highs (sell-side liquidity) and swing lows (buy-side liquidity)
- **Configurable lookback**: Adjustable period for liquidity zone detection
- **Visual display**: Horizontal lines extending N bars forward to show liquidity targets
- **Maximum zones**: Limits display to most recent N zones to avoid chart clutter
**Trading Application:**
Liquidity zones represent areas where stop losses are likely clustered. Price often moves to "sweep" these liquidity zones before reversing, creating high-probability entry opportunities.
## RISK MANAGEMENT SYSTEM
### ATR-Based Stop Loss Calculation
- **Dynamic stop placement**: Stop loss calculated using ATR (Average True Range) with configurable multiplier
- **Adaptive to volatility**: Stop loss automatically adjusts to current market volatility conditions
- **Configurable ATR period**: Default 14-period ATR, adjustable from 5-30 periods
- **SL multiplier**: Adjustable from 0.5x to 10x ATR for different risk profiles
### Multiple Take Profit Levels
The system supports up to 6 take profit levels with fixed risk-reward ratios:
- **TP1**: 1:2 risk-reward ratio
- **TP2**: 1:4 risk-reward ratio
- **TP3**: 1:6 risk-reward ratio
- **TP4**: 1:8 risk-reward ratio (optional)
- **TP5**: 1:10 risk-reward ratio (optional)
- **TP6**: 1:12 risk-reward ratio (optional)
**Why Multiple TP Levels:**
This allows partial profit-taking at key Fibonacci extension levels while letting winners run. The system tracks win rates for each TP level, helping traders optimize their exit strategy.
## SIGNAL FILTERS (OPTIONAL ENHANCEMENTS)
### RSI Extreme Filter
- **Avoid overbought/oversold extremes**: Prevents entries when RSI is in extreme zones (default: >70 overbought, <30 oversold)
- **Configurable thresholds**: Adjustable RSI levels and calculation period
- **Purpose**: Reduces false signals in exhausted moves
### ADX Trend Strength Filter
- **Avoid choppy markets**: Only allows trades when ADX indicates trending conditions (default: ADX > 20)
- **Configurable threshold**: Adjustable ADX minimum value (10-50)
- **Purpose**: Filters out low-probability trades in ranging markets
### Volume Confirmation
- **Volume multiplier**: Requires volume above X times average (default: 1.1x)
- **Purpose**: Ensures moves are supported by institutional participation
### POC Proximity Filters
- **Volume POC filter**: Only enter when price is near Volume Profile POC
- **Session POC filter**: Only enter when price is near Session POC
- **Daily POC filter**: Only enter when price is near Daily POC
- **Weekly POC filter**: Only enter when price is near Weekly POC
- **Proximity threshold**: Configurable ATR multiplier for "near" definition (default: 2.0x ATR)
---
## DIVERGENCE DETECTION
### MFI (Money Flow Index) Divergence
- **Bullish divergence**: Price makes lower low, MFI makes higher low (potential reversal up)
- **Bearish divergence**: Price makes higher high, MFI makes lower high (potential reversal down)
- **Configurable lookback**: Adjustable period for divergence detection (default: 100 bars)
- **Minimum bars between divergences**: Prevents duplicate signals (default: 10 bars)
- **Advanced thresholds**: Separate thresholds for RSI, price, and MFI divergence strength
**Note**: Divergence detection is visual-only and does not filter trades. It provides additional market context for discretionary traders.
## MARKET CONTEXT TOOLS
### Session High/Low Lines
- **Recent session extremes**: Displays horizontal lines for session high and low
- **Configurable lookback**: Adjustable period for session calculation (default: 10 bars)
- **Purpose**: Identifies key intraday support/resistance levels
### Swing Point Detection
- **Automatic swing identification**: Marks significant swing highs and lows
- **Visual reference**: Helps identify market structure and trend direction
### Signal Overview Table
Real-time technical analysis overview:
- **Current RSI**: Relative Strength Index value
- **ATR**: Current Average True Range
- **ADX**: Average Directional Index (trend strength)
- **EMA status**: Current fast/slow EMA relationship (Bullish/Bearish/Neutral)
- **POC levels**: Current price relative to POC levels
- **Confidence score**: Calculated confidence percentage based on confluence
- **Volume trend**: Current volume trend direction
## CHART DISPLAY OPTIONS
### Entry/SL/TP Lines
- **Visual trade management**: Displays entry price, stop loss, and all take profit levels as horizontal lines
- **Configurable length**: Lines extend N bars forward (default: 30 bars)
- **Color-coded**: Different colors for entry, stop loss, and each TP level
### Win/Loss Labels
- **Trade verification**: Displays up to 500 individual win/loss labels on chart
- **Visual feedback**: Green labels for wins, red labels for losses
- **Performance tracking**: Helps verify strategy performance visually
## USAGE INSTRUCTIONS
### Initial Setup
1. **Select Strategy Mode**: Choose your preferred trading strategy from the dropdown (EMA Crossover, RSI Mean Reversion, Breakout, MACD Crossover, Bollinger Bands, Volume Breakout, or Disabled)
2. **Configure Risk Management**:
- Set ATR Length for stop loss calculation (default: 14)
- Set SL ATR Multiplier (default: 1.0)
- Enable additional TP levels if desired (TP4-TP6 are optional)
3. **Adjust Strategy Parameters**: Each strategy has its own settings group. Configure EMA periods, RSI settings, MACD parameters, etc., based on your selected strategy.
### Recommended Settings by Market Type
**Forex/Crypto (High Volatility)**:
- EMA Mode: Fast (7/17) or Custom (3/21)
- SL ATR Multiplier: 1.5-2.0
- Enable FVG retracement filter
- Enable Order Block directional filter
**Stocks (Moderate Volatility)**:
- EMA Mode: Standard (9/21)
- SL ATR Multiplier: 1.0-1.5
- Enable ADX filter to avoid choppy markets
- Enable Volume confirmation
**Indices (Lower Volatility)**:
- EMA Mode: Slow (13/26)
- SL ATR Multiplier: 0.8-1.2
- Enable POC proximity filters
- Enable RSI extreme filter
### Advanced Configuration
1. **Enable Optional Filters**: Navigate to "Signal Filters" section and enable filters that match your trading style
2. **Configure Market Analysis Tools**: Adjust FVG, Order Block, Fibonacci, and POC settings in their respective sections
3. **Customize Display**: Toggle chart display options to show/hide various elements based on your preference
---
## WHY THIS INDICATOR COMBINATION CREATES UNIQUE VALUE
### Multi-Layered Confluence Analysis
This script is not a simple indicator mashup. It implements a proprietary integration framework that creates synergistic value through three layers of analysis:
**Layer 1: Fibonacci Mathematics**
- Golden Zone identification (61.8%-78.6% retracement zone) using three-point trend-based calculation
- Extension targets based on swing structure mathematics
- Statistically significant retracement areas where price is likely to reverse
**Layer 2: Institutional Flow Analysis**
- Fair Value Gaps (FVGs) identify order flow gaps where price must return
- Order Blocks mark institutional accumulation/distribution zones
- Multi-timeframe POC analysis shows where liquidity is concentrated
- Liquidity zones identify where stop losses cluster
**Layer 3: Multi-Strategy Signal Generation**
- Six different entry methodologies provide multiple perspectives
- Shared risk management ensures consistent position sizing
- Adaptive confidence scoring evaluates confluence from all three layers
- Optional filters allow customization for different market conditions
### Proprietary Integration Framework
The unique value comes from how these components work together:
1. **Strategy generates signal** → 2. **FVG/Order Block validates institutional support** → 3. **POC confirms liquidity level** → 4. **Fibonacci provides target zones** → 5. **Risk management calculates optimal SL/TP placement**
This creates a complete trading system, not just a collection of indicators.
---
## TECHNICAL SPECIFICATIONS
- **Pine Script Version**: v6
- **Chart Type**: Overlay (displays on price chart)
- **Max Bars Back**: 5000 (for historical analysis)
- **Max Labels**: 500 (for win/loss tracking)
- **Compatibility**: Works on all timeframes and instruments
- **Performance**: Optimized for real-time execution
---
## DISCLAIMER
This script is a technical analysis tool and does not constitute financial, investment, trading, or other types of advice. Past performance does not guarantee future results. Always use proper risk management and never risk more than you can afford to lose. The script's signals are based on mathematical calculations and should be used in conjunction with your own analysis and risk management practices.
---
## SUPPORT AND ACCESS
This is an invite-only script. To request access:
1. Visit: www.pinescriptedge.com
2. Include your TradingView username and brief trading experience
3. Access will be reviewed and granted within 24 hours
**Note**: TradingView does NOT recommend paying for or using a script unless you fully trust its author and understand how it works. You may also find free, open-source alternatives in our community scripts.
---
## VERSION INFORMATION
**Momentum Master v1** - Initial release with multi-strategy framework and institutional flow analysis integration.
For updates and new features, follow the script or check the author's profile for version announcements.

YM Ultimate SNIPER# YM Ultimate SNIPER - Documentation & Trading Guide
## 🎯 Unified GRA + DeepFlow | YM-Optimized for Low Volatility
**TARGET: 3-7 High-Confluence Trades per Day**
> **Philosophy:** *YM's lower volatility is not a weakness—it's our edge. Predictability + precision = consistent profits.*
---
## ⚡ QUICK REFERENCE CARD
```
┌─────────────────────────────────────────────────────────────────────────────┐
│ YM ULTIMATE SNIPER - QUICK REFERENCE │
├─────────────────────────────────────────────────────────────────────────────┤
│ │
│ 💰 YM BASICS: │
│ ═════════════ │
│ • 1 tick = 1 point = $5/contract │
│ • Typical daily range: 150-400 points │
│ • 30-40% less volatile than NQ │
│ • More institutional, less retail noise │
│ │
├─────────────────────────────────────────────────────────────────────────────┤
│ │
│ 🎯 TIER THRESHOLDS (YM-OPTIMIZED): │
│ ══════════════════════════════════ │
│ S-TIER: 50+ pts = $250+/contract → HOLD (Institutional sweep) │
│ A-TIER: 25-49 pts = $125-245/contract → SWING (Strong momentum) │
│ B-TIER: 12-24 pts = $60-120/contract → SCALP (Quick grab) │
│ │
├─────────────────────────────────────────────────────────────────────────────┤
│ │
│ ⏰ SESSION WINDOWS: │
│ ═══════════════════ │
│ LDN → 3:00-5:00 AM ET (European flow) │
│ NY → 9:30-11:30 AM ET (US opening drive) │
│ PWR → 3:00-4:00 PM ET (End-of-day rebalancing) │
│ │
│ Expected Trades: 1-2 LDN | 2-3 NY | 1-2 PWR = 4-7 total │
│ │
├─────────────────────────────────────────────────────────────────────────────┤
│ │
│ 📊 CONFLUENCE SCORING (MAX 10 POINTS): │
│ ═══════════════════════════════════════ │
│ Tier Signal: S=3, A=2, B=1 points │
│ In Active Zone: +2 points │
│ POC Aligned: +1 point (POC at body extreme) │
│ Imbalance Support:+1 point (supporting IMB nearby) │
│ Strong Volume: +1 point (2x+ average) │
│ Strong Delta: +1 point (70%+ dominance) │
│ CVD Momentum: +1 point (CVD trending with signal) │
│ │
│ MINIMUM SCORE: 5/10 to show signal (adjustable) │
│ IDEAL SCORE: 7+/10 for highest probability │
│ │
├─────────────────────────────────────────────────────────────────────────────┤
│ │
│ 🚨 SIGNAL TYPES: │
│ ═════════════════ │
│ S🎯 / A🎯 / B🎯 → GRA Tier Signals (Full confluence) │
│ Z🎯 → Zone Entry (At DFZ zone + delta + volume) │
│ SP → Single Print (Institutional impulse) │
│ │
├─────────────────────────────────────────────────────────────────────────────┤
│ │
│ ✓ ENTRY CHECKLIST: │
│ ═══════════════════ │
│ □ Signal appears (check Score ≥5) │
│ □ Session active (LDN!/NY!/PWR!) │
│ □ Table: Vol GREEN, Delta colored, Body GREEN │
│ □ CVD arrow (▲/▼) matches direction │
│ □ Note stop/target lines on chart │
│ □ Check Zone status (bonus if IN ZONE) │
│ □ Execute at signal candle close │
│ │
├─────────────────────────────────────────────────────────────────────────────┤
│ │
│ 🎯 POSITION SIZING BY TIER: │
│ ═══════════════════════════ │
│ S-TIER (50+ pts): Full size, hold 2-5 min, target 2.5:1 R:R │
│ A-TIER (25-49): 75% size, hold 1-3 min, target 2.0:1 R:R │
│ B-TIER (12-24): 50% size, hold 30-90 sec, target 1.5:1 R:R │
│ │
├─────────────────────────────────────────────────────────────────────────────┤
│ │
│ ⛔ DO NOT TRADE WHEN: │
│ ════════════════════ │
│ ✗ Session shows "---" │
│ ✗ Score < 5/10 │
│ ✗ Vol shows RED (<1.8x) │
│ ✗ Delta < 62% │
│ ✗ Multiple conflicting signals │
│ ✗ Just before major news (FOMC, NFP, etc.) │
│ │
└─────────────────────────────────────────────────────────────────────────────┘
```
---
## 📋 WHY YM? LEVERAGING LOW VOLATILITY
### The YM Advantage
Most traders avoid YM because "it doesn't move enough." This is precisely why it's perfect for precision scalping:
| Factor | NQ | YM | Advantage |
|--------|----|----|-----------|
| **Daily Range** | 300-600 pts | 150-400 pts | More predictable moves |
| **Tick Value** | $5/tick (4 ticks/pt) | $5/tick (1 tick/pt) | Simpler math |
| **Retail Noise** | High | Low | Cleaner signals |
| **Whipsaws** | Frequent | Rare | Fewer fakeouts |
| **Trend Persistence** | Short | Long | Easier holds |
| **Fill Quality** | Variable | Consistent | Better execution |
### Why 3-7 Trades is the Sweet Spot
```
YM SESSION BREAKDOWN:
════════════════════
LONDON (3-5 AM ET): 1-2 trades
├── Why: European institutions positioning for US open
├── Character: Slow build-up, clean trends
└── Best signals: Zone entries + A/B tier
NY OPEN (9:30-11:30 AM ET): 2-3 trades
├── Why: Highest volume, most institutional activity
├── Character: Initial balance formation, breakouts
└── Best signals: S/A tier, zone confluence
POWER HOUR (3-4 PM ET): 1-2 trades
├── Why: End-of-day rebalancing, MOC orders
├── Character: Mean reversion or trend acceleration
└── Best signals: Zone entries, B tier quick scalps
TOTAL: 4-7 high-quality setups per day
```
---
## 🔧 YM-SPECIFIC OPTIMIZATIONS
This unified indicator has been specifically tuned for YM's characteristics:
### Tier Thresholds
| Tier | NQ (Original) | YM (Optimized) | Rationale |
|------|---------------|----------------|-----------|
| S-Tier | 100 pts | **50 pts** | YM's daily range is ~50% of NQ |
| A-Tier | 50 pts | **25 pts** | Proportional scaling |
| B-Tier | 20 pts | **12 pts** | Still 5%+ of typical daily range |
### Filter Adjustments
| Filter | NQ Value | YM Value | Why |
|--------|----------|----------|-----|
| Volume Ratio | 1.5x | **1.8x** | Higher bar = less retail noise |
| Delta Threshold | 60% | **62%** | Tighter for cleaner signals |
| Body Ratio | 70% | **72%** | More conviction required |
| Range Multiplier | 1.3x | **1.4x** | Bigger move = real signal |
| Gap ATR% | 30% | **25%** | Smaller gaps still significant |
| Zone Age | 50 bars | **75 bars** | Zones last longer in slow market |
### Why These Changes Work
1. **Higher Volume Bar**: YM has more institutional flow. Requiring 1.8x volume ensures we're catching real moves, not retail chop.
2. **Tighter Delta**: With less noise, we can demand clearer buyer/seller dominance before entering.
3. **Longer Zone Life**: YM trends persist longer. A zone that would be stale in NQ is still viable in YM.
4. **Smaller Gap Threshold**: YM gaps are naturally smaller. 25% of ATR in YM is significant institutional activity.
---
## 📊 CONFLUENCE SCORING SYSTEM
The unified indicator uses a 10-point confluence scoring system to filter for only the highest-probability setups:
### Score Breakdown
```
CONFLUENCE SCORE CALCULATION:
═════════════════════════════
BASE POINTS (Tier):
├── S-Tier signal: +3 points
├── A-Tier signal: +2 points
└── B-Tier signal: +1 point
BONUS POINTS:
├── Inside Active Zone (DFZ): +2 points
│ └── Price within bull/bear zone = institutional level
│
├── POC Alignment: +1 point
│ └── POC at body extreme = strong conviction
│
├── Imbalance Support: +1 point
│ └── Supporting imbalance within 1 ATR
│
├── Strong Volume (2x+): +1 point
│ └── Exceptional institutional participation
│
├── Strong Delta (70%+): +1 point
│ └── Clear one-sided aggression
│
└── CVD Momentum: +1 point
└── CVD trending with signal direction
MAXIMUM POSSIBLE: 10 points
```
### Score Interpretation
| Score | Quality | Action | Expected Win Rate |
|-------|---------|--------|-------------------|
| 8-10 | 🥇 Elite | Full size, hold for target | 75-80% |
| 6-7 | 🥈 Strong | Standard size, manage actively | 65-70% |
| 5 | 🥉 Valid | Reduced size, quick scalp | 55-60% |
| <5 | ⚫ Filtered | No signal shown | N/A |
### Adjusting Minimum Score
- **Conservative (Score ≥6)**: Fewer trades, higher win rate
- **Standard (Score ≥5)**: Balanced approach, 3-7 trades/day
- **Aggressive (Score ≥4)**: More trades, requires active management
---
## 📐 SIGNAL TYPES EXPLAINED
### 1. GRA Tier Signals (S🎯, A🎯, B🎯)
These are the primary signals from the merged GRA system:
```
TIER SIGNAL REQUIREMENTS:
═══════════════════════════
ALL must be TRUE:
├── ✓ Point movement meets tier threshold
├── ✓ Volume ≥ 1.8x average
├── ✓ Delta ≥ 62% (buy or sell dominance)
├── ✓ Body ≥ 72% of candle range
├── ✓ Range ≥ 1.4x average
├── ✓ Small opposite wick (<50% of body)
├── ✓ CVD confirms direction (if enabled)
├── ✓ Active session (LDN/NY/PWR)
└── ✓ Confluence Score ≥ minimum (default 5)
```
### 2. Zone Entry Signals (Z🎯)
When price enters a DeepFlow zone with confirmation:
```
ZONE ENTRY REQUIREMENTS:
═══════════════════════════
ALL must be TRUE:
├── ✓ Price inside fresh/tested zone (not broken)
├── ✓ Delta ≥ 62% in zone direction
├── ✓ Volume ≥ 1.5x average
└── ✓ Active session
NOTE: Z🎯 only appears when NOT already showing tier signal
(prevents duplicate signals on same candle)
```
### 3. Single Print Markers (SP)
Mark institutional impulse candles for future S/R:
```
SINGLE PRINT REQUIREMENTS:
═══════════════════════════
ALL must be TRUE:
├── ✓ Range ≥ 1.6x average
├── ✓ Body ≥ 72% of range
├── ✓ Volume ≥ 1.8x average
├── ✓ Delta ≥ 62% confirms direction
└── ✓ Active session
USE: Horizontal lines at high/low act as future S/R
```
---
## 🎯 TRADING STRATEGIES
### Strategy 1: Zone + Tier Confluence (Highest Probability)
```
THE ULTIMATE YM SETUP:
═══════════════════════
Setup:
1. Active DeepFlow zone exists (green box below for long)
2. Price pulls back INTO the zone
3. Tier signal fires INSIDE the zone (S🎯/A🎯)
4. Score shows 7+/10
Entry: Signal candle close
Stop: Below zone bottom (for longs)
Target: Based on tier (1.5-2.5:1 R:R)
Why It Works:
• Zone = institutional limit orders
• Tier signal = momentum confirmation
• Double confirmation = high probability
Expected Win Rate: 70-75%
```
### Strategy 2: Pure Tier Signal with POC Stop
```
SNIPER TIER TRADE:
══════════════════
Setup:
1. Tier signal appears (preferably A or S)
2. Score ≥ 5/10
3. Note POC level on signal candle
4. Red/green stop/target lines appear
Entry: Signal candle close
Stop: Beyond POC (shown on chart)
Target: Auto-calculated based on tier
Key: POC placement matters
• POC near candle bottom (longs) = STRONG
• POC in middle = weaker signal
• POC at extreme = possible exhaustion
Expected Win Rate: 60-65%
```
### Strategy 3: Zone Bounce (Continuation)
```
ZONE BOUNCE TRADE:
══════════════════
Setup:
1. Fresh zone created during session
2. Price leaves zone, moves in zone direction
3. Price returns to test zone (within 15 bars)
4. Z🎯 signal appears or rejection candle forms
Entry: At CE line (middle of zone)
Stop: Beyond zone edge
Target: Previous swing high/low
Why It Works:
• Zones represent unfilled orders
• First retest often finds support/resistance
• Lower volatility = cleaner bounces
Expected Win Rate: 55-60%
```
### Strategy 4: Single Print Scalp
```
SINGLE PRINT SCALP:
═══════════════════
Setup:
1. Single Print (SP) marker appears
2. Note the gold/purple lines at high/low
3. Wait for price to return to SP level
4. Look for rejection or tier signal at level
Entry: At SP line with confirmation
Stop: Beyond the SP line
Target: Quick 1:1 or to next structure
Why It Works:
• SP = price moved too fast, orders unfilled
• Price often returns to "fill" these levels
• YM's slower pace makes retests likely
Expected Win Rate: 55-60%
```
---
## 📊 TABLE LEGEND
| Field | Reading | Color Meaning |
|-------|---------|---------------|
| **Pts** | Current candle points | Gold/Green/Yellow = Tiered |
| **Tier** | S/A/B/X | Tier color or white |
| **Vol** | Volume ratio | 🟢 ≥1.8x, 🔴 <1.8x |
| **Delta** | Buy/Sell % | 🟢 Buy dom, 🔴 Sell dom |
| **Body** | Body % of range | 🟢 ≥72%, 🔴 <72% |
| **CVD** | Trend direction | ▲ Bullish, ▼ Bearish |
| **Sess** | Active session | 🟡 LDN!/NY!/PWR!, ⚫ --- |
| **POC** | Point of Control | 🟡 Gold price level |
| **Zone** | Zone position | 🟢 BUY⬚, 🔴 SELL⬚, ⚫ --- |
| **Zones** | Active zone count | #B/#S format |
| **Score** | Confluence score | 🟢 7+, 🟡 5-6, ⚫ <5 |
| **IMB** | Recent imbalances | Count in last 10 bars |
| **R:R** | Risk/Reward | 🟢 On signal, ⚫ No signal |
---
## ⏰ SESSION-SPECIFIC PLAYBOOKS
### London Session (3:00-5:00 AM ET)
```
CHARACTER: Slow, methodical, trend-building
VOLUME: Medium (50-70% of NY)
BEST SETUPS: Zone entries, A/B tier with zones
PLAYBOOK:
• Enter on zone retests
• Expect 15-25 pt moves
• Don't fight early direction
• Watch for pre-NY positioning
TYPICAL TRADES: 1-2
```
### NY Open (9:30-11:30 AM ET)
```
CHARACTER: Fast, volatile, high-conviction
VOLUME: Highest of day
BEST SETUPS: S/A tier, zone confluence
PLAYBOOK:
• First 15 min: Observe Initial Balance
• 9:45-10:15: Best setups form
• S-tier signals = ride the wave
• Be aggressive on high scores
TYPICAL TRADES: 2-3
```
### Power Hour (3:00-4:00 PM ET)
```
CHARACTER: Rebalancing, MOC orders
VOLUME: Medium-high (70-80% of NY)
BEST SETUPS: B tier scalps, zone entries
PLAYBOOK:
• Watch for mean reversion setups
• Quick scalps around POC levels
• Don't hold through close
• Take profits at 1:1 R:R
TYPICAL TRADES: 1-2
```
---
## 🔧 RECOMMENDED SETTINGS
### Conservative (Fewer, Better Trades)
| Setting | Value | Notes |
|---------|-------|-------|
| Min Confluence Score | 6 | Only strong setups |
| Min Volume Ratio | 2.0 | Higher bar |
| Delta Threshold | 65% | Stricter dominance |
| Max Zones | 8 | Less clutter |
### Standard (Balanced)
| Setting | Value | Notes |
|---------|-------|-------|
| Min Confluence Score | 5 | Default |
| Min Volume Ratio | 1.8 | Default |
| Delta Threshold | 62% | Default |
| Max Zones | 12 | Default |
### Aggressive (More Opportunities)
| Setting | Value | Notes |
|---------|-------|-------|
| Min Confluence Score | 4 | More signals |
| Min Volume Ratio | 1.5 | Lower bar |
| Delta Threshold | 60% | Looser |
| Max Zones | 15 | More context |
---
## 🚨 ALERT SETUP
Configure these alerts in TradingView:
| Alert | Priority | Action |
|-------|----------|--------|
| 🎯 YM S-TIER LONG/SHORT | 🔴 CRITICAL | Drop everything, check immediately |
| 🎯 YM A-TIER LONG/SHORT | 🟠 HIGH | Evaluate within 15 seconds |
| 🎯 YM B-TIER LONG/SHORT | 🟡 MEDIUM | Check if available |
| 🎯 YM ZONE BUY/SELL | 🟢 STANDARD | Good context entry |
| 📦 NEW ZONE | 🔵 INFO | Mark on mental map |
| ⭐ SINGLE PRINT | 🔵 INFO | Note for future S/R |
| SESSION OPEN | ⚪ INFO | Prepare to trade |
### Alert Message Format
```
🎯 YM A-LONG | YM1! @ 42,150 | 68%B | Score: 7/10 | IN ZONE | POC: 42,125 | Stop: 42,098 | SWING
```
---
## ⚠️ COMMON MISTAKES TO AVOID
| Mistake | Why It's Bad | Solution |
|---------|-------------|----------|
| Trading outside sessions | Low volume = noise | Wait for LDN/NY/PWR |
| Ignoring score | Low scores = low probability | Require ≥5/10 |
| Fighting the zone | Zones are institutional | Trade WITH zones |
| Oversizing B-tier | Quick scalps, not holds | 50% size max |
| Holding through news | Volatility spike | Exit before FOMC, NFP |
| Chasing after signal | Entry on close only | Miss it = wait for next |
| Ignoring POC position | Middle POC = indecision | Strong = extreme POC |
---
## 📈 DAILY TRADE JOURNAL TEMPLATE
```
DATE: ___________
SESSION: □ LDN □ NY □ PWR
TRADE 1:
├── Time: _______
├── Signal: S🎯 / A🎯 / B🎯 / Z🎯
├── Score: ___/10
├── Entry: _______
├── Stop: _______
├── Target: _______
├── In Zone: □ Yes □ No
├── Result: +/- ___ pts ($_____)
└── Notes: _______________________
TRADE 2:
DAILY SUMMARY:
├── Total Trades: ___
├── Win Rate: ___%
├── Net P/L: $_____
├── Best Setup: _______
└── Improvement: _______________________
```
---
## 🏆 GOLDEN RULES FOR YM
> **"YM rewards patience. Wait for the confluence—it's worth it."**
> **"Low volatility means you can size up. One good trade beats five forced trades."**
> **"Score 7+ is your edge. Anything less is gambling."**
> **"The zone + tier combo is your bread and butter. Master it."**
> **"Leave every trade with money. YM gives you time to manage."**
---
## 📊 VISUAL GUIDE
```
PERFECT YM SNIPER SETUP:
═══════════════════════════════════════════════════════════════════
│ Current Price
│
┌─────────────────────────┴────────────────────────────┐
│ BEARISH ZONE (Red) │
│- - - - - - - CE Line (Entry for shorts) - - - - - - │
│ │
└──────────────────────────────────────────────────────┘
│
══════════════════╪══════════════════ SP High (Purple)
│
┌─────────────────────┤
│█████████████████████│ ← A🎯 LONG Signal
│█████████████████████│ Score: 8/10
│ ●──────────────────│ ← POC (Gold) near bottom = STRONG
│█████████████████████│
│█████████████████████│
└─────────────────────┤
│
══════════════════╪══════════════════ SP Low (Purple)
│
┌─────────────────────────┴────────────────────────────┐
│ BULLISH ZONE (Green) │
│- - - - - - - CE Line (Entry for longs) - - - - - - -│
│██████████████████████████████████████████████████████│
└──────────────────────────────────────────────────────┘
│
Stop Loss
CONFLUENCE CHECK:
✓ A-Tier signal (+2)
✓ At edge of bullish zone (+2)
✓ POC at bottom of candle (+1)
✓ Strong volume 2.3x (+1)
✓ Delta 72% buyers (+1)
✓ CVD bullish (+1)
TOTAL: 8/10 = ELITE SETUP
ACTION: Full size LONG at signal candle close
STOP: Below zone bottom
TARGET: 2:1 R:R (auto-calculated)
```
---
## 🔧 TROUBLESHOOTING
| Issue | Cause | Fix |
|-------|-------|-----|
| No signals appearing | Score too high | Lower min score to 4-5 |
| Too many signals | Score too low | Raise min score to 6+ |
| Zones cluttering chart | Max zones high | Reduce to 8-10 |
| POC not showing | Tiered filter on | Check "POC Only Tiered" |
| Session not highlighting | Wrong timezone | Verify timezone setting |
| Alerts not firing | Not configured | Set up in TradingView alerts |
---
## 📝 PINE SCRIPT V6 TECHNICAL NOTES
This indicator uses advanced features:
- **User Defined Types (UDT)**: Clean state management for zones/imbalances
- **`request.security_lower_tf()`**: Intrabar volume analysis
- **Dynamic Array Management**: Efficient memory for drawings
- **Confluence Scoring Engine**: Multi-factor signal qualification
- **Auto Stop/Target**: Dynamic risk management calculation
**Minimum TradingView Plan:** Pro (for intrabar data access)
---
*© Alexandro Disla - YM Ultimate SNIPER*
*Pine Script v6 | TradingView*
*Unified GRA v5 + DeepFlow Zones | YM-Optimized*

Aggressive VS Passive Orders Depletion @MaxMaserati 3.0Aggressive VS Passive Orders Depletion Indicator
Overview
This institutional-grade order flow analysis tool identifies and tracks limit order accumulation zones where significant buy and sell orders are placed in the market. It combines Highest Volume Candle Profile analysis with Market Structure detection to reveal where institutional traders have positioned their orders, and monitors in real-time whether these orders are being absorbed (depleted) or defended.
Core Concept: Order Block Detection & Depletion
This tool tracks the actual limit orders at key price levels and shows you:
Where institutional orders are placed (Buy Order Blocks vs Sell Order Blocks)
How strong these order zones are (original volume strength as %)
Real-time order flow activity (aggressive buyers vs aggressive sellers)
Depletion status (are the orders being consumed or defended?)
How It Works: Dual-Engine System
Engine 1: Volume Profile Analysis - Point of Control (POC) Detection
Divides price range into 25 horizontal levels (configurable)
Analyzes the last 120 bars (configurable lookback)
Distributes volume across price levels based on where each bar traded
Identifies the Point of Control (POC) - the price level with highest traded volume
Determines market bias: Bullish if price above POC, Bearish if below
Purpose: Shows where the majority of volume has been traded, indicating institutional accumulation zones and fair value areas.
Engine 2: Market Structure Analysis (PHL - Pivot High/Low)
Uses fractal pivot detection (configurable strength)
Identifies swing highs and lows that create market structure
Tracks Break of Structure (BOS) - price breaks recent swing in trend direction
Tracks Market Structure Shift (MSS) - price breaks swing points against trend
Maintains a trailing price at the most recent significant swing point
Purpose: Identifies where smart money is likely defending key structural levels with limit orders.
Key Innovation #1: Dynamic Confluence Zone Detection
When the Volume Profile POC and Market Structure trail price align within a configurable sensitivity threshold (default 1.0%), the indicator creates an Order Block Zone.
The Algorithm:
Monitors both engines continuously
Creates zones ONLY when POC is within X% of the structural swing point
Both engines must agree on the significance of the price level
Optional volume confirmation filter
This dual-confirmation approach filters out weak levels and highlights only the highest-probability zones where institutional orders are likely clustered.
Zone Types:
🟢 Buy Order Blocks (Support) - Created when confluence occurs with price above the zone. Represents accumulated buy limit orders waiting to support price.
🔴 Sell Order Blocks (Resistance) - Created when confluence occurs with price below the zone. Represents accumulated sell limit orders waiting to resist price.
Key Innovation #2: Real-Time Aggressive VS Passive Order Flow Analysis
The indicator performs sophisticated order flow decomposition on each candle that interacts with a zone, separating market activity into distinct categories:
Order Flow Categories:
1. Aggressive Orders - Market orders that consume liquidity
Aggressive Buy Volume: Market buys hitting sell limits (taking offers)
Aggressive Sell Volume: Market sells hitting buy limits (hitting bids)
Marked with (AGG) label when detected
Indicates urgent traders willing to pay the spread
2. Passive Orders - Limit orders adding liquidity
Passive Buy Volume: New buy limits being placed (making bids)
Passive Sell Volume: New sell limits being placed (making offers)
Shows patient traders providing liquidity
3. New Order Flow - Fresh buying/selling pressure
New Buyers: Total new buying activity (aggressive + passive)
New Sellers: Total new selling activity (aggressive + passive)
Net pressure indicator for zone health
Key Innovation #3: Advanced Order Flow Decomposition Algorithm
The indicator uses a proprietary candle analysis formula to separate aggressive from passive orders based on two key metrics:
Key Metrics:
Body Strength = |Close - Open| / (High - Low)
Close Position = (Close - Low) / (High - Low)
Bullish Candle Analysis:
Strong Aggressive Buying (Close Position ≥ 0.8 AND Body Strength ≥ 0.7):
90% aggressive buying, 10% passive selling, 90% new buyers
Moderate Aggressive Buying (Close Position ≥ 0.6 AND Body Strength ≥ 0.5):
70% aggressive buying, 20% passive selling, 80% new buyers, 20% new sellers
Weak Bullish (Close Position ≥ 0.5):
0-30% aggressive buying, 20-30% passive selling, 60% new buyers, 40% new sellers
Very Weak Bullish (Close Position < 0.5):
0% aggressive buying, 40% passive selling, 40% new buyers, 60% new sellers
Bearish Candle Analysis:
Strong Aggressive Selling (Close Position ≤ 0.2 AND Body Strength ≥ 0.7):
90% aggressive selling, 10% passive buying, 90% new sellers
Moderate Aggressive Selling (Close Position ≤ 0.4 AND Body Strength ≥ 0.5):
70% aggressive selling, 20% passive buying, 80% new sellers, 20% new buyers
Weak Bearish (Close Position ≤ 0.5):
0-30% aggressive selling, 20-30% passive buying, 60% new sellers, 40% new buyers
Very Weak Bearish (Close Position > 0.5):
0% aggressive selling, 40% passive buying, 40% new sellers, 60% new buyers
What This Reveals:
High close position + strong body = Aggressive buying overwhelming sellers
Low close position + strong body = Aggressive selling overwhelming buyers
Mid-range close = Battle between buyers and sellers
Small body = Passive orders dominating (limit orders being placed, not filled)
Key Innovation #4: Dynamic Depletion System with Intelligent Thresholds
The indicator adapts depletion thresholds based on zone strength:
High Liquidity Zones (>300% volume strength):
Depletion at 40% consumption - Massive clusters considered broken early because partial depletion indicates institutional withdrawal
Medium Liquidity Zones (150-300% volume strength):
Depletion at 60% consumption - Standard institutional behavior, majority must be consumed
Normal Liquidity Zones (75-150% volume strength):
Depletion at 80% consumption - Retail and smaller institutional zones need near-complete absorption
Low Liquidity Zones (<75% volume strength):
Depletion at 100% consumption - Weak zones must be fully absorbed before marked depleted
Why This Matters:
Strong zones failing early = powerful reversal signal (institutions gave up)
Weak zones holding = hidden strength (more orders being added)
Adaptive logic prevents false signals from fixed thresholds
Depletion Formula:
For Buy Order Zones:
Zone Liquidity % = (Original Buy Volume / Average Volume) × 100
Consumed % = (Sell Volume Absorbed / Average Volume) × 100
If Consumed Volume > Dynamic Threshold → Zone DEPLETED
For Sell Order Zones:
Zone Liquidity % = (Original Sell Volume / Average Volume) × 100
Consumed % = (Buy Volume Absorbed / Average Volume) × 100
If Consumed Volume > Dynamic Threshold → Zone DEPLETED
Key Innovation #5: Absorption Detection & Battle Analysis
The indicator identifies when one side is overwhelming the other using a configurable Absorption Threshold (default 1.5x = 50% more volume).
Battle States for Buy Order Blocks:
New Buyers Dominating (New Buyers > New Sellers × 1.5):
Label: ↑ New Buyers: +X% - Buy orders successfully defended
Sellers Attacking (New Sellers > New Buyers × 1.5):
Label: ↓ Sellers Attack: +X% (AGG) - Sell orders overwhelming the zone
Active Battle (Both active, <1.5x ratio):
Label: Battle: B+X% vs S+Y% - Active two-way order flow
Quiet Zone (Minimal activity):
Label: ↔ Quiet: X% - Zone untested or ignored
Battle States for Sell Order Blocks:
New Sellers Dominating (New Sellers > New Buyers × 1.5):
Label: ↓ New Sellers: +X% - Sell orders successfully defended
Buyers Absorbing (New Buyers > New Sellers × 1.5):
Label: ↑ Buyers Absorb: +X% (AGG) - Buy orders overwhelming the zone
Active Battle (Both active, <1.5x ratio):
Label: Battle: S+X% vs B+Y% - Active two-way order flow
Quiet Zone (Minimal activity):
Label: ↔ Quiet: X% - Zone untested or ignored
The (AGG) Marker:
Appears when aggressive market orders are detected (high body strength + extreme close position). Indicates institutional-sized urgency—someone is willing to pay market price NOW. Often precedes breakouts or strong continuations.
Label System Explained
No Label = Untested Zone
When a zone is first created, you see ONLY the colored box with NO label. This means:
Price has NOT yet reached this order block
The limit orders are still pending/resting
The zone is a future area of interest
Labels only appear after first price contact
Label Format (After First Touch):
Line 1: ● XX% Order Type
Line 2: Flow Analysis
Example Labels:
Buy Order Blocks:
● 150% Buy Orders + ↑ New Buyers: +85%
● 150% Buy Orders + ↑ New Buyers: +120% (AGG)
● 150% Buy Orders + Battle: B+45% vs S+38%
● 150% Buy Orders + ↓ Sellers Attack: +95% (AGG)
● 150% Buy Orders + ↓ Sellers Attack: +95% (AGG)
● 150% Buy Orders
Sell Order Blocks:
● 200% Sell Orders + ↓ New Sellers: +110%
● 200% Sell Orders + ↓ New Sellers: +140% (AGG)
● 200% Sell Orders + Battle: S+62% vs B+41%
● 200% Sell Orders + ↑ Buyers Absorb: +88% (AGG)
● 200% Sell Orders + ↑ Buyers Absorb: +88% (AGG)
● 200% Sell Orders
Status Indicators:
- Price penetrated through the zone
- Orders fully consumed, zone exhausted
Gray color - Zone no longer active
Directional Arrows:
↑ - Upward pressure (buyers stronger)
↓ - Downward pressure (sellers stronger)
↔ - Balanced/quiet (low activity)
↗ / ↘ - Mixed battle with bias
Point of Control (POC) Sub-Level Analysis
Each order block contains advanced volume distribution tracking:
Multi-Level Analysis (default 5 levels): Zones subdivided into horizontal price levels
Volume Distribution: Every candle's volume distributed across sub-levels based on price overlap
Buy/Sell Separation: Each level tracks buy vs sell volume independently
Dynamic POC Line: Marks the price level with highest traded volume within the zone
Real-Time Updates: POC adjusts as new volume enters, showing where "fairest price" is migrating
Style Options: Solid, Dashed, or Dotted lines (configurable width 1-5)
POC Trading Significance:
Represents the most accepted price within the order block
Often the best entry price for limit orders (highest liquidity)
POC migration shows whether zone is being "worked higher" or "worked lower"
Breaking through POC often signals zone failure
Key Settings
Volume Profile:
Lookback Period: 120 bars (historical period for POC)
Price Rows: 25 levels (granularity of volume distribution)
Volume Confirmation: Require structure breaks to align with volume bias
Market Structure:
Pivot Strength: 1 (swing detection sensitivity)
Show Trail: Optional trailing price visualization
Confluence Detection:
Sensitivity: 1.0% (distance threshold for POC/Structure alignment)
Lower = Stricter confluence, fewer zones
Higher = More zones detected
Order Flow Analysis:
Show Real-Time Order Flow: Live buyer/seller activity
Show Aggressive Markers: (AGG) labels for market orders
Show Directional Arrows: Price direction indicators (↑↓↔↗↘)
Absorption Threshold: 1.5x (when one side overwhelms the other)
1.5 = 50% more volume needed
2.0 = 100% more (stricter)
1.2 = 20% more (more sensitive)
Visual Options:
Hide Depleted Zones: Auto-remove exhausted blocks
Smart Bar Coloring: Color candles based on signal alignment
Zone Colors: Customize buy/sell colors
Label Text Size: Tiny, Small, Normal, Large
POC Settings:
Show POC Lines: Toggle Point of Control display
POC Analysis Levels: 3-10 levels
Line Width: 1-5 pixels
Line Style: Solid, Dashed, or Dotted
Trading Applications
1. Institutional Order Detection - Identify where large players positioned limit orders using Volume Profile POC + Market Structure confluence
2. Support/Resistance Validation - Dual confirmation filters weak levels, highlights high-probability reversal areas
3. Order Flow Imbalance Trading - Trade in direction of aggressive flow using (AGG) markers, fade zones showing absorption
4. Breakout/Breakdown Confirmation - and statuses validate moves through key levels
5. Liquidity Hunting - Track stop-loss clusters, anticipate stop runs based on depletion patterns
6. Entry Refinement - Use POC lines for precise limit placement at "fairest price" within zones
Combined Signal System
HVN Volume Profile × Market Structure Signals:
STRONG BUY: Both engines bullish + structure break up + volume confirmation
BUY: Bullish bias with partial confirmation
WEAK BUY: Early bullish signals
STRONG SELL: Both engines bearish + structure break down + volume confirmation
SELL: Bearish bias with partial confirmation
WEAK SELL: Early bearish signals
Alert Conditions:
Strong Buy/Sell signals (with volume confirmation)
Confluence zone activation (new order block created)
Order block depletion (zone exhausted)
What Makes This Indicator Unique
Industry-Standard Foundation:
Volume Profile POC detection + Market Structure analysis (swing pivots, BOS/MSS) + Point of Control tracking
Unique Innovations:
Dynamic Confluence Algorithm + Aggressive vs Passive Order Flow Decomposition + Adaptive Depletion Thresholds + Real-Time Absorption Detection + Battle Analysis with (AGG) markers + Complete Unified Methodology
Technical Excellence:
Resource-optimized (max 50 zones), comprehensive safety checks, multi-tier labeling, flexible customization
Best Practices
Wait for first touch - No label = untested zone
Watch (AGG) markers - Institutional urgency signal
Trust adaptive depletion - Strong zones failing early = major reversal
Use POC for entries - Best price within zone
Combine higher timeframes - Daily/4H zones strongest
Respect zones - Failed support becomes resistance
Follow battle labels - Contested areas show stop clusters
Adjust sensitivity - Tight ranges = lower %, trending = higher %
Performance Notes
Maximum Active Zones: 50 (automatic cleanup)
Maximum Lines: 400 (POC managed dynamically)
Lookback Cap: 1000 bars for optimization
Updates: All calculations on bar close for confirmed signals
