VaCs Pro Max by CS (Final Version - V9)VaCs Pro Max by CS (Final Version - V9) – TradingView Indicator Overview
Introduction:
The VaCs Pro Max indicator is a comprehensive, all-in-one technical analysis tool designed for traders who seek a clear, visual, and flexible overview of market trends, levels, sessions, and key signals. This advanced TradingView script integrates multiple technical indicators, market level trackers, session visualizations, and the innovative AlphaTrend module to provide actionable insights across any timeframe.
1. Technical Indicators:
This module combines essential trend-following and market momentum tools:
VWAP (Volume Weighted Average Price): Shows the average price weighted by volume, helping traders identify key support/resistance levels. Customizable color allows easy chart visibility.
EMAs (Exponential Moving Averages): Two EMAs (fast and long) track short-term and long-term price trends. Traders can adjust lengths and colors for personalized analysis.
Parabolic SAR: Highlights potential trend reversals with dots above/below candles. Step and maximum settings allow fine-tuning for sensitivity.
S2F Bands (Stock-to-Flow): A dynamic band system representing mid, upper, and lower levels derived from EMA. Useful for identifying overbought/oversold zones.
Logarithmic Growth Channel (LGC): Provides logarithmic regression channels, highlighting long-term price structure and growth trends. Adjustable length and band colors.
Linear Regressions: Two regression lines (short and long) detect trend directions and deviations over customizable periods.
Liquidity Zones: Highlights recent highs/lows over a defined lookback period, showing potential support/resistance clusters.
SMC Markers (Swing Market Context): Marks pivot highs and lows using visual labels, helping identify swing points and trend continuation patterns.
2. Market Levels:
Track weekly and Monday high/low levels for precise intraday and swing trading decisions:
Weekly Levels: Highlight the previous week’s high and low for reference.
Monday Levels: Focus on the day’s opening range, particularly useful for weekly breakout strategies.
3. Session Boxes (UTC):
Visual boxes mark major trading sessions (London, New York) in UTC time:
London Session Box: Highlights market activity between 08:00–16:30 UTC.
New York Session Box: Highlights market activity between 13:30–20:00 UTC.
Boxes automatically adjust to session highs and lows for clear intraday structure visualization.
4. Vertical Session Lines (Turkey Time – UTC+3):
These vertical lines provide an easy-to-read visualization of key market opens and closes:
US (NYSE), EU (LSE), JP (TSE), CN (SSE) lines: Color-coded and labeled, showing market opening and closing times in Turkish local time.
Ideal for identifying session overlaps and liquidity spikes.
5. AlphaTrend Module:
The AlphaTrend module is a dynamic trend-following system offering both visual guidance and trade signals:
Trend Calculation: Uses ATR and RSI/MFI logic to determine dynamic trend levels.
Signals: Generates BUY and SELL markers based on trend crossovers.
Customizable Settings: Multiplier, period, source input, and volume data modes allow tailored sensitivity.
Visuals: Filled areas between main and lag lines highlight trend direction, making it easy to interpret market bias at a glance.
Alerts: Includes multiple alert conditions such as potential and confirmed BUY/SELL, and price crossovers, suitable for automated notifications.
Usage & Benefits:
All modules have on/off toggles in the input panel, allowing users to customize the chart view without losing performance.
Color-coded visuals, session boxes, and trend channels improve readability, especially during high volatility.
Suitable for day trading, swing trading, and long-term analysis due to multi-timeframe adaptability.
The combination of trend indicators, liquidity zones, and session analysis provides a holistic view of market structure.
Alerts enable traders to automate monitoring without constantly staring at the chart.
Conclusion:
VaCs Pro Max by CS (V9) is designed for both professional and semi-professional traders who want an all-inclusive, visually intuitive, and highly configurable TradingView indicator. It merges classical technical indicators with modern trend and session analysis tools, making it an indispensable tool for informed trading decisions.
Search in scripts for "pro"

Liquidity Hunter Pro v11.9 — TQI EditionLiquidity Hunter Pro v12 is built for intraday traders who want structure, clarity, and precision without unnecessary clutter. The tool blends market structure, momentum, trend alignment, volatility regime analysis, and liquidity mapping into a single unified model.
This version focuses on three core goals:
1. Identify only high-quality, directional market conditions.
The engine filters through HTF bias, short-term structure shifts, RSI momentum, and volatility compression/expansion. The idea is simple: wait for the market to become clean, aligned, and directional before considering an entry.
2. Map liquidity and detect sweeps in real time.
Major highs and lows are tracked using extended pivots, and the system highlights key areas where stop hunts or sweeps may occur. Sweeps and pressure zones are evaluated and factored directly into the quality score.
3. Grade every potential setup with a single, objective metric (TQI).
The Trade Quality Index (0–5⭐) compresses all signals into one reading so the trader can quickly judge whether a setup has enough quality to act on.
The script includes:
• Trend + Momentum + Structure detection
• HTF bias (optional)
• Volatility regime analysis
• Liquidity sweeps + pressure zones
• Micro-confirmation engine
• PQI (0–100%)
• TQI (0–5⭐)
• Clean HUD and Driver’s Guide
• Auto-cleaning labels and signal management
• Optional session filtering (London/NY)
This tool is designed for traders who value confirmation over noise.
It will not fire constantly.
It will wait patiently for clean, directional, aligned markets — and only then issue a signal.
How to Use Liquidity Hunter Pro v12
1. Check the HUD (top-right by default)
The HUD is your dashboard. Before doing anything:
A. HTF Bias
This is your map. Only trade in the direction of the bias.
B. Trend / Momentum / Structure
These should ideally all match the direction of the bias.
If they don’t line up → wait. No alignment = low probability.
C. Liquidity + Volatility Regime
“Sweep ↑→↓” or “Sweep ↓→↑” = potential reversal points
“Expansion” = clean conditions
“Compression” = choppy, avoid
You don’t need to overthink any of this — just think:
“Are the ingredients lined up?”
2. Wait for a valid signal
The indicator will only trigger a BUY or SELL when:
✓ HTF bias aligns
✓ Trend & momentum align
✓ Structure supports the move
✓ Micro-confirmation kicks in
✓ PQI ≥ 75
✓ Sessions are open (optional)
Signals are rare on purpose.
When one prints, you know the market conditions are stacked.
3. Read the label
Each signal prints a small block next to the candle containing:
• Entry price
• SL (based on structure)
• TP(2R) suggestion
• Liquidity context (e.g., sweep or pressure)
• Volatility regime
• TQI ⭐ rating (0–5)
This helps you judge the setup instantly.
A simple rule for beginners:
Trade only if TQI ≥ ⭐⭐⭐
Lower than that = more noise, less edge.
4. Use the liquidity zones
The script plots subtle boxes at recent liquidity highs/lows.
These mark:
• Where the market may hunt stops
• Where reversals often start
• Where signals are more meaningful
When a signal happens near liquidity → higher quality.
5. Follow the session filter (optional but recommended)
By default the tool focuses on:
• London session
• New York session
That removes 70% of low-volatility garbage.
You can turn this off if you trade crypto or indices overnight, but beginners usually benefit from keeping it on.
Recommended Settings
These are the settings used by most testers and early users.
Everything is configurable, but start with this:
Core Settings
• Fast EMA: 21
• Slow EMA: 55
• RSI Length: 14
• Pivot Lookback: 2
These settings create balanced structure detection and smooth trend signals.
HTF Bias
• Use HTF Bias: ON
• HTF Timeframe: 240 (H4)
H4 bias keeps you out of counter-trend traps.
Sessions
• Use London/NY Filter: ON
• London: 08:00–17:00
• New York: 13:30–21:00
Perfect for FX, indices, and metals.
Crypto traders: turn sessions OFF.
HUD + Guide
• HUD: ON
• Guide: ON
• Linger Bars: 12
This keeps things readable and prevents clutter.
Trading Tips for Beginners
These help keep you out of trouble:
1. Don’t fade the bias.
If HTF says bearish → avoid buys.
2. Don’t trade in compression regimes.
It saves you from chop.
3. Don’t chase signals that fire far from structure.
If the signal candle is huge, let it go.
4. Don’t trade without at least ⭐⭐⭐.
You’ll thank yourself later.
Final Thoughts
Liquidity Hunter Pro v12 isn’t meant to spam signals.
It’s meant to filter hard, highlight clean conditions, and help new traders avoid the traps the market throws every day.
Treat it as a trading assistant that tells you:
“The environment is right. Now you decide.”

Indicator Overview主力籌碼預判買賣力道 (JUMBO)Pro+ 2.0主力預判買賣力道 Pro+ 是一個先進的多維度交易分析系統,專為台灣股市投資者設計。本指標整合了趨勢、成交量、動量、價格位置和波動率五大維度,通過加權評分系統生成綜合的「Power指標」,精準預判主力資金動向。
🔧 核心技術架構
1. 多維度評分系統
趨勢維度 (30%):雙EMA系統 + MACD + ADX趨勢強度
成交量維度 (25%):OBV能量潮 + 成交量比率分析
動量維度 (20%):RSI + MFI資金流量指標
價格位置維度 (20%):VWAP + 布林通道位置分析
波動率維度 (5%):ATR波動率調整
2. 多重確認機制
趨勢確認:EMA金叉/死叉 + 超級趨勢方向
成交量確認:成交量脈衝檢測 + OBV趨勢確認
動量確認:RSI超買超賣 + MFI資金流向
位置確認:布林通道位置 + VWAP相對位置
📊 主要功能特色
訊號系統
主力佈局訊號 🟥
趨勢多頭確認 + Power > 35
成交量放大 + 動量指標多頭
RSI未超買 + 價格突破基準
主力出貨訊號 🟩
趨勢空頭確認 + Power < -35
成交量異常 + 動量指標空頭
RSI未超賣 + 價格跌破基準
Power交叉訊號 🟠🔵
黃金交叉:Power線向上穿越Power MA線
死亡交叉:Power線向下穿越Power MA線
視覺化系統
台灣股市顏色標準:紅色上漲/多頭,綠色下跌/空頭
多層級K線著色:強力訊號→普通訊號→偏多偏空→盤整
智能資訊面板:實時顯示8大關鍵指標狀態
⚙️ 參數設定說明
主要參數
EMA週期:13/55(短期/長期)
Power閾值:35(靈敏度調整)
成交量濾波:1.2倍(異常成交量檢測)
超級趨勢:10週期/3倍數(趨勢過濾)
進階參數
布林通道:20週期/2倍標準差
波動率設定:14週期ATR
動量指標:14週期RSI/MFI
🎯 交易應用策略
進場時機
強力買入:🔥標記 + Power黃金交叉
常規買入:紅色向上箭頭 + Power > 35
確認買入:多重條件同時滿足
出場時機
強力賣出:💧標記 + Power死亡交叉
常規賣出:綠色向下箭頭 + Power < -35
風險控制:趨勢反轉 + 動量減弱
風險管理
止損設定:ATR波動率參考
倉位控制:Power數值強度分級
訊號過濾:ADX趨勢強度確認
📈 指標優勢
高準確率:多重條件過濾,減少假訊號
及時性:領先指標預判主力動向
完整性:涵蓋技術分析主要維度
用戶友好:直觀的視覺化設計
自定義:參數可調適應不同交易風格
🎯 Indicator Overview
Main Force Prediction Buying/Selling Strength Pro+ is an advanced multi-dimensional trading analysis system specifically designed for Taiwan stock market investors. This indicator integrates five key dimensions: trend, volume, momentum, price position, and volatility, generating a comprehensive "Power Indicator" through a weighted scoring system to accurately predict institutional fund movements.
🔧 Core Technical Architecture
1. Multi-Dimensional Scoring System
Trend Dimension (30%): Dual EMA system + MACD + ADX trend strength
Volume Dimension (25%): OBV accumulation + Volume ratio analysis
Momentum Dimension (20%): RSI + MFI money flow index
Price Position Dimension (20%): VWAP + Bollinger Bands position analysis
Volatility Dimension (5%): ATR volatility adjustment
2. Multi-Confirmation Mechanism
Trend Confirmation: EMA golden/death cross + SuperTrend direction
Volume Confirmation: Volume spike detection + OBV trend confirmation
Momentum Confirmation: RSI overbought/oversold + MFI money flow
Position Confirmation: Bollinger Bands position + VWAP relative position
📊 Key Features
Signal System
Institutional Accumulation Signals 🟥
Bullish trend confirmation + Power > 35
Volume expansion + Momentum indicators bullish
RSI not overbought + Price breakthrough baseline
Institutional Distribution Signals 🟩
Bearish trend confirmation + Power < -35
Abnormal volume + Momentum indicators bearish
RSI not oversold + Price breakdown below baseline
Power Cross Signals 🟠🔵
Golden Cross: Power line crosses above Power MA line
Death Cross: Power line crosses below Power MA line
Visualization System
Taiwan Market Color Standard: Red for uptrend/bullish, Green for downtrend/bearish
Multi-level Candlestick Coloring: Strong signals → Regular signals → Bias signals → Consolidation
Smart Info Panel: Real-time display of 8 key indicator statuses
⚙️ Parameter Settings
Main Parameters
EMA Periods: 13/55 (Short-term/Long-term)
Power Threshold: 35 (Sensitivity adjustment)
Volume Filter: 1.2x (Abnormal volume detection)
SuperTrend: 10 period/3 multiplier (Trend filtering)
Advanced Parameters
Bollinger Bands: 20 period/2 standard deviations
Volatility Settings: 14 period ATR
Momentum Indicators: 14 period RSI/MFI
🎯 Trading Application Strategies
Entry Timing
Strong Buy: 🔥 Mark + Power Golden Cross
Regular Buy: Red upward arrow + Power > 35
Confirmed Buy: Multiple conditions simultaneously met
Exit Timing
Strong Sell: 💧 Mark + Power Death Cross
Regular Sell: Green downward arrow + Power < -35
Risk Control: Trend reversal + Momentum weakening
Risk Management
Stop Loss Setting: ATR volatility reference
Position Sizing: Power value strength grading
Signal Filtering: ADX trend strength confirmation
📈 Indicator Advantages
High Accuracy: Multiple condition filtering reduces false signals
Timeliness: Leading indicators predict institutional movements
Completeness: Covers main dimensions of technical analysis
User-Friendly: Intuitive visualization design
Customizable: Adjustable parameters adapt to different trading styles
🔍 Professional Usage Tips
Trend Confirmation: Use in conjunction with major trend direction
Volume Validation: Ensure volume confirms price movements
Risk Management: Always use appropriate position sizing
Timeframe Analysis: Apply across multiple timeframes for confirmation
Market Context: Consider overall market conditions and sector rotation
版本: Pro+ 2.0
適用市場: 台股、亞股、全球股市
最佳時間框架: 日線、4小時線、1小時線
開發者: JUMBO Trading System
更新日期: 2025版本

AG Pro Dynamic ChannelsAG Pro Dynamic Channels V2
Discover a new lens through which to view market structure with the AG Pro Dynamic Channels V2. This advanced indicator moves beyond simple trendlines, automatically identifying, classifying, and drawing eight distinct types of support and resistance channels directly on your chart.
Built on a sophisticated pivot-point detection engine, this script intelligently distinguishes between Major and Minor price structures, as well as Internal and External channels. This provides a comprehensive and multi-dimensional map of the market's flow, helping you identify trend continuations, corrections, and potential reversals.
The indicator is complete with a powerful, fully customizable alert system designed to notify you of the two most critical events: channel breakouts and price reactions.
Key Features
Fully Automatic Channels: The script automatically analyzes price action to find pivot highs and lows, using them to construct relevant channels without any manual drawing required.
8-Channel Classification: Gain deep market insight by viewing eight distinct channel types:
Major External (Up/Down)
Major Internal (Up/Down)
Minor External (Up/Down)
Minor Internal (Up/Down)
Advanced Pivot Engine: The core logic classifies pivots into categories like Higher Highs (MHH/mHH), Lower Lows (MLL/mLL), Higher Lows (MHL/mHL), and Lower Highs (MLH/mLH) to determine the precise start and end points for each channel.
Deep Customization: Take full control of your chart's appearance. You can individually toggle the visibility, color, line style (solid, dashed, dotted), and line width for all eight channel types.
Chart Clarity: A "Delete Previous" option is available for each channel type, allowing you to keep your chart clean and focused on only the most current and relevant market structures.
Comprehensive Alert System
Never miss a key price interaction. The AG Pro Dynamic Channels V2 features a robust, built-in alert module.
Dual-Alert Conditions: Get notifications for two distinct events:
Break Alert: Triggers when price confirms a close outside of a channel, signaling a potential breakout.
React Alert: Triggers when price touches or interacts with a channel line before closing back inside, signaling a test or rejection.
16 Unique Alerts: You have full control to enable or disable "Break" and "React" alerts for all 8 channel types individually, giving you 16 unique alert conditions to monitor.
Professional Alert Messages: The embedded alert sender provides detailed messages that include the asset, timeframe, and the specific event, such as "Break Major External Up Channel" or "React Minor Internal Down Channel".
Alert Configuration: Easily set your global Alert Name, Message Frequency (e.g., Once Per Bar, Once Per Bar Close), and Alert Time Zone from the script's settings.
How to Use
Trend Identification: Use the Major External Channels (drawn from MHH and MLL pivots) to identify the primary, long-term trend direction.
Pullback & Entry Zones: Use the Internal Channels (drawn from MHL and MLH pivots) to spot corrections and potential entry zones within an established trend.
Breakout Trading: Set Break Alerts on Major channels to be notified of significant, structure-shifting moves.
Short-Term & Counter-Trend: Utilize the Minor Channels to identify shorter-term price swings and potential reversal points.

Price Action Brooks ProPrice Action Brooks Pro (PABP) - Professional Trading Indicator
━━━━━━━━━━━━━━━━━━━━━━━━━━━━━━━━━━━━━━━━━━━━━━━━━━
📊 OVERVIEW
Price Action Brooks Pro (PABP) is a professional-grade TradingView indicator developed based on Al Brooks' Price Action trading methodology. It integrates decades of Al Brooks' trading experience and price action analysis techniques into a comprehensive technical analysis tool, helping traders accurately interpret market structure and identify trading opportunities.
• Applicable Markets: Stocks, Futures, Forex, Cryptocurrencies
• Timeframes: 1-minute to Daily (5-minute chart recommended)
• Theoretical Foundation: Al Brooks Price Action Trading Method
━━━━━━━━━━━━━━━━━━━━━━━━━━━━━━━━━━━━━━━━━━━━━━━━━━
🎯 CORE FEATURES
━━━━━━━━━━━━━━━━━━━━━━━━━━━━━━━━━━━━━━━━━━━━━━━━━━
1️⃣ INTELLIGENT GAP DETECTION SYSTEM
Automatically identifies and marks three critical types of gaps in the market.
TRADITIONAL GAP
• Detects complete price gaps between bars
• Upward gap: Current bar's low > Previous bar's high
• Downward gap: Current bar's high < Previous bar's low
• Hollow border design - doesn't obscure price action
• Color coding: Upward gaps (light green), Downward gaps (light pink)
• Adjustable border: 1-5 pixel width options
TAIL GAP
• Detects price gaps between bar wicks/shadows
• Analyzes across 3 bars for precision
• Identifies hidden market structure
BODY GAP
• Focuses only on gaps between bar bodies (open/close)
• Filters out wick noise
• Disabled by default, enable as needed
Trading Significance:
• Gaps signal strong momentum
• Gap fills provide trading opportunities
• Consecutive gaps indicate trend continuation
✓ Independent alert system for all gap types
━━━━━━━━━━━━━━━━━━━━━━━━━━━━━━━━━━━━━━━━━━━━━━━━━━
2️⃣ RTH BAR COUNT (Trading Session Counter)
Intelligent counting system designed for US stock intraday trading.
FEATURES
• RTH Only Display: Regular Trading Hours (09:30-15:00 EST)
• 5-Minute Chart Optimized: Displays every 3 bars (15-minute intervals)
• Daily Auto-Reset: Counting starts from 1 each trading day
SMART COLOR CODING
• 🔴 Red (Bars 18 & 48): Critical turning moments (1.5h & 4h)
• 🔵 Sky Blue (Multiples of 12): Hourly markers (12, 24, 36...)
• 🟢 Light Green (Bar 6): Half-hour marker (30 minutes)
• ⚫ Gray (Others): Regular 15-minute interval markers
Al Brooks Time Theory:
• Bar 18 (90 min): First 90 minutes determine daily trend
• Bar 48 (4 hours): Important afternoon turning point
• Hourly markers: Track institutional trading rhythm
━━━━━━━━━━━━━━━━━━━━━━━━━━━━━━━━━━━━━━━━━━━━━━━━━━
3️⃣ FOUR-LINE EMA SYSTEM
Professional-grade configurable moving average system.
DEFAULT CONFIGURATION
• EMA 20: Short-term trend (Al Brooks' most important MA)
• EMA 50: Medium-short term reference
• EMA 100: Medium-long term confirmation
• EMA 200: Long-term trend and bull/bear dividing line
FLEXIBLE CUSTOMIZATION
Each EMA can be independently configured:
• On/Off toggle
• Data source selection (close/high/low/open, etc.)
• Custom period length
• Offset adjustment
• Color and transparency
COLOR SCHEME
• EMA 20: Dark brown, opaque (most important)
• EMA 50/100/200: Blue-purple gradient, 70% transparent
TRADING APPLICATIONS
• Bullish Alignment: Price > 20 > 50 > 100 > 200
• Bearish Alignment: 200 > 100 > 50 > 20 > Price
• EMA Confluence: All within <1% = major move precursor
Al Brooks Quote:
"The EMA 20 is the most important moving average. Almost all trading decisions should reference it."
━━━━━━━━━━━━━━━━━━━━━━━━━━━━━━━━━━━━━━━━━━━━━━━━━━
4️⃣ PREVIOUS VALUES (Key Prior Price Levels)
Automatically marks important price levels that often act as support/resistance.
THREE INDEPENDENT CONFIGURATIONS
Each group configurable for:
• Timeframe (1D/60min/15min, etc.)
• Price source (close/high/low/open/CurrentOpen, etc.)
• Line style and color
• Display duration (Today/TimeFrame/All)
SMART OPEN PRICE LABELS ⭐
• Auto-displays "Open" label when CurrentOpen selected
• Label color matches line color
• Customizable label size
TYPICAL SETUP
• 1st Line: Previous close (Support/Resistance)
• 2nd Line: Previous high (Breakout target)
• 3rd Line: Previous low (Support level)
Al Brooks Magnet Price Theory:
• Previous open: Price frequently tests opening price
• Previous high/low: Strongest support/resistance
• Breakout confirmation: Breaking prior levels = trend continuation
━━━━━━━━━━━━━━━━━━━━━━━━━━━━━━━━━━━━━━━━━━━━━━━━━━
5️⃣ INSIDE & OUTSIDE BAR PATTERN RECOGNITION
Automatically detects core candlestick patterns from Al Brooks' theory.
ii PATTERN (Consecutive Inside Bars)
• Current bar contained within previous bar
• Two or more consecutive
• Labels: ii, iii, iiii (auto-accumulates)
• High-probability breakout setup
• Stop loss: Outside both bars
Trading Significance:
"Inside bars are one of the most reliable breakout setups, especially three or more consecutive inside bars." - Al Brooks
OO PATTERN (Consecutive Outside Bars)
• Current bar engulfs previous bar
• Two or more consecutive
• Labels: oo, ooo (auto-accumulates)
• Indicates indecision or volatility increase
ioi PATTERN (Inside-Outside-Inside)
• Three-bar combination: Inside → Outside → Inside
• Auto-detected and labeled
• Tug-of-war pattern
• Breakout direction often very strong
SMART LABEL SYSTEM
• Auto-accumulation counting
• Dynamic label updates
• Customizable size and color
• Positioned above bars
✓ Independent alerts for all patterns
━━━━━━━━━━━━━━━━━━━━━━━━━━━━━━━━━━━━━━━━━━━━━━━━━━
💡 USE CASES
INTRADAY TRADING
✓ Bar Count (timing rhythm)
✓ Traditional Gap (strong signals)
✓ EMA 20 + 50 (quick trend)
✓ ii/ioi Patterns (breakout points)
SWING TRADING
✓ Previous Values (key levels)
✓ EMA 20 + 50 + 100 (trend analysis)
✓ Gaps (trend confirmation)
✓ iii Patterns (entry timing)
TREND FOLLOWING
✓ All four EMAs (alignment analysis)
✓ Gaps (continuation signals)
✓ Previous Values (targets)
BREAKOUT TRADING
✓ iii Pattern (high-reliability setup)
✓ Previous Values (targets)
✓ EMA 20 (trend direction)
━━━━━━━━━━━━━━━━━━━━━━━━━━━━━━━━━━━━━━━━━━━━━━━━━━
🎨 DESIGN FEATURES
PROFESSIONAL COLOR SCHEME
• Gaps: Hollow borders + light colors
• Bar Count: Smart multi-color coding
• EMAs: Gradient colors + transparency hierarchy
• Previous Values: Customizable + smart labels
CLEAR VISUAL HIERARCHY
• Important elements: Opaque (EMA 20, bar count)
• Reference elements: Semi-transparent (other EMAs, gaps)
• Hollow design: Doesn't obscure price action
USER-FRIENDLY INTERFACE
• Clear functional grouping
• Inline layout saves space
• All colors and sizes customizable
━━━━━━━━━━━━━━━━━━━━━━━━━━━━━━━━━━━━━━━━━━━━━━━━━━
📚 AL BROOKS THEORY CORE
READING PRICE ACTION
"Don't try to predict the market, read what the market is telling you."
PABP converts core concepts into visual tools:
• Trend Assessment: EMA system
• Time Rhythm: Bar Count
• Market Structure: Gap analysis
• Trade Setups: Inside/Outside Bars
• Support/Resistance: Previous Values
PROBABILITY THINKING
• ii pattern: Medium probability
• iii pattern: High probability
• iii + EMA 20 support: Very high probability
━━━━━━━━━━━━━━━━━━━━━━━━━━━━━━━━━━━━━━━━━━━━━━━━━━
⚙️ TECHNICAL SPECIFICATIONS
• Pine Script Version: v6
• Maximum Objects: 500 lines, 500 labels, 500 boxes
• Alert Functions: 8 independent alerts
• Supported Timeframes: All (5-min recommended for Bar Count)
• Compatibility: All TradingView plans, Mobile & Desktop
━━━━━━━━━━━━━━━━━━━━━━━━━━━━━━━━━━━━━━━━━━━━━━━━━━
🚀 RECOMMENDED INITIAL SETTINGS
GAPS
• Traditional Gap: ✓
• Tail Gap: ✓
• Border Width: 2
BAR COUNT
• Use Bar Count: ✓
• Label Size: Normal
EMA
• EMA 20: ✓
• EMA 50: ✓
• EMA 100: ✓
• EMA 200: ✓
PREVIOUS VALUES
• 1st: close (Previous close)
• 2nd: high (Previous high)
• 3rd: low (Previous low)
INSIDE & OUTSIDE BAR
• All patterns: ✓
• Label Size: Large
━━━━━━━━━━━━━━━━━━━━━━━━━━━━━━━━━━━━━━━━━━━━━━━━━━
🌟 WHY CHOOSE PABP?
✅ Solid Theoretical Foundation
Based on Al Brooks' decades of trading experience
✅ Complete Professional Features
Systematizes complex price action analysis
✅ Highly Customizable
Every feature adjustable to personal style
✅ Excellent Performance
Optimized code ensures smooth experience
✅ Continuous Updates
Constantly improving based on feedback
✅ Suitable for All Levels
Benefits beginners to professionals
━━━━━━━━━━━━━━━━━━━━━━━━━━━━━━━━━━━━━━━━━━━━━━━━━━
📖 RECOMMENDED LEARNING
Al Brooks Books:
• "Trading Price Action Trends"
• "Trading Price Action Trading Ranges"
• "Trading Price Action Reversals"
Learning Path:
1. Understand basic candlestick patterns
2. Learn EMA applications
3. Master market structure analysis
4. Develop trading system
5. Continuous practice and optimization
━━━━━━━━━━━━━━━━━━━━━━━━━━━━━━━━━━━━━━━━━━━━━━━━━━
⚠️ RISK DISCLOSURE
IMPORTANT NOTICE:
• For educational and informational purposes only
• Does not constitute investment advice
• Past performance doesn't guarantee future results
• Trading involves risk and may result in capital loss
• Trade according to your risk tolerance
• Test thoroughly in demo account first
RESPONSIBLE TRADING:
• Always use stop losses
• Control position sizes reasonably
• Don't overtrade
• Continuous learning and improvement
• Keep trading journal
━━━━━━━━━━━━━━━━━━━━━━━━━━━━━━━━━━━━━━━━━━━━━━━━━━
📜 COPYRIGHT
Price Action Brooks Pro (PABP)
Author: © JimmC98
License: Mozilla Public License 2.0
Pine Script Version: v6
Acknowledgments:
Thanks to Dr. Al Brooks for his contributions to price action trading. This indicator is developed based on his theories.
━━━━━━━━━━━━━━━━━━━━━━━━━━━━━━━━━━━━━━━━━━━━━━━━━━
Experience professional-grade price action analysis now!
"The best traders read price action, not indicators. But when indicators help you read price action better, use them." - Al Brooks

CVD Pro – Smart Overlay + Signals (with Persist Mode)What this Indicator Does
CVD Pro visualizes Cumulative Volume Delta (CVD) data directly on your main price chart — helping you detect real buying vs. selling pressure in real time.
Unlike most CVD scripts that run in a separate subwindow, this one overlays price-mapped CVD curves on the candles themselves for better confluence with market structure and FVG zones.
The script dynamically scales normalized CVD values to the price range and uses adaptive smoothing and deviation bands to highlight shifts in trader behavior.
It also includes automatic bullish/bearish crossover signals, displayed as on-chart labels.
⚙️ Main Features
✅ Price-mapped CVD Overlay
CVD is normalized (Z-score) and projected onto the price chart for easy visual correlation with price structure.
✅ Multi-Timeframe Presets
Three sensitivity presets optimized for different chart environments:
Strict (4H) → Best for macro trends and high-timeframe structure.
Balanced (1H / 30m) → Great for active swing setups.
Sensitive (15m) → Captures short-term intraday reversals.
✅ Dynamic Bands & Smoothing
Deviation bands visualize statistical extremes in delta pressure — helping to identify exhaustion and divergence points.
✅ Smart Buy/Sell Signal Logic
Automatic label triggers when the CVD Overlay crosses its smoothed baseline:
🟢 BULL LONG → Rising CVD above the mean (buyers in control).
🔴 BEAR SHORT → Falling CVD below the mean (sellers in control).
✅ Persist Mode
Toggle to keep the last signal visible until a new one forms — ideal for traders who prefer clean chart annotations without noise.
✅ Clean, Minimal Overlay
Everything happens directly on your chart — no extra windows, no clutter. Designed for use with Smart Money Concepts, Fair Value Gaps (FVGs), or volume imbalance setups.
🧩 Use Case
CVD Pro is designed for traders who:
Use Smart Money Concepts (SMC) or ICT-style trading
Watch for FVG reactions, breaker blocks, and liquidity sweeps
Need to confirm order flow direction or momentum strength
Trade intraday or swing setups with precision entries and clear bias confirmation
⚡ Recommended Settings
4H / 1H: Use Strict mode for major structure and confirmation.
1H / 30m: Balanced mode for clear mid-term trend alignment.
15m: Sensitive mode to catch scalps and lower-TF shifts.
🧠 Pro Tips
Combine with RSI or Market Structure Breaks (MSS) for additional confluence.
A strong CVD divergence near a key FVG or 0.5–0.705 Fibonacci zone often signals reversal.
Persistent CVD crossover + price structure break = high-probability entry.
🧩 Credits
Created by Patrick S. ("Nova Labs")
Concept inspired by professional order-flow analytics and adaptive Z-Score normalization.
Would you like me to write a shorter “public summary” paragraph (for the short description at the top of TradingView, the one-liner users see before expanding)?
It’s usually a 2–3 sentence hook like:
“Overlay-based CVD indicator that merges volume delta with price structure. Detect true buying/selling pressure using adaptive normalization, deviation bands, and clean bullish/bearish crossover signals.”

ARO Pro — Adaptive Regime OscillatorARO Pro — Adaptive Regime Oscillator (v6)
ARO Pro turns your chart into a context-aware decision system. It classifies every bar as Trending (up or down) or Ranging in real time, then switches its math to match the regime: trend strength is measured with an ATR-normalized EMA spread, while range behavior is tracked with a center-based RSI oscillator. The result is cleaner entries, fewer false signals, and faster reads on regime shifts—without repainting.
⸻
How it works (under the hood)
1. Regime Detection (Kaufman ER):
ARO computes Kaufman’s Efficiency Ratio (ER) over a user-defined length.
- ER > threshold → Trending (direction from EMA fast vs. EMA slow)
- ER ≤ threshold → Ranging
2. Adaptive Oscillator Core:
- Trend mode: (EMA(fast) − EMA(slow)) / ATR * 100 → momentum normalized by volatility.
- Range mode: RSI(length) − 50 → mean-reversion pressure around zero.
3. Volatility Filter (optional):
Blocks signals if ATR as % of price is below a floor you set. This reduces noise in thin or quiet markets.
4. MTF Trend Filter (optional & non-repainting):
Confirms signals only if a higher timeframe EMA(fast) > EMA(slow) for longs (or < for shorts). Implemented with lookahead_off and gaps_on.
5. Confirmation & Alerts:
Signals are locked only on bar close (barstate.isconfirmed) and offered via three alert types: ARO Long, ARO Short, ARO Regime Shift.
⸻
What you see on the chart
• Background heat:
• Green = Trending Up, Red = Trending Down, Gray = Range.
• ARO line (panel): Adaptive oscillator (trend/value colors).
• Signal markers: ▲ Long / ▼ Short on confirmed bars.
• Guide lines: Upper/Lower thresholds (±K) and zero line.
• Info Panel (table): Regime, ER, ATR %, ARO, HTF status (OK/BLOCK/OFF), and a Confidence light.
• Debug Overlay (optional): Quick view of thresholds and raw conditions for tuning.
⸻
Inputs (quick reference)
• Signals: Fast/Slow EMA, RSI length, ER length & threshold, oscillator smoothing, signal threshold.
• Filters: ATR length, minimum ATR% (volatility floor), toggle for volatility filter.
• Visuals: Background on/off, Info Panel on/off, Debug overlay on/off.
• MTF (safe): Toggle + HTF timeframe (e.g., 240, D, W).
⸻
Interpreting signals
• Long: Trend regime AND fast EMA > slow EMA AND ARO ≥ +threshold (confirmed bar, filters passing).
• Short: Trend regime AND fast EMA < slow EMA AND ARO ≤ −threshold (confirmed bar, filters passing).
• Regime Shift: Alert when ER moves the market from Range → Trend or flips trend direction.
⸻
Practical use cases & examples
1) Intraday momentum alignment (scalps to day trades)
• Timeframes: 5–15m with HTF filter = 4H.
• Flow:
1. Wait for Trend Up background + HTF OK.
2. Enter on ▲ Long when ARO crosses above +threshold.
3. Stops: 1–1.5× ATR(14) below trigger bar or below last micro swing.
4. Exits: Partial at 1× ATR, trail remainder with an ATR stop or when ARO reverts to zero/Regime Shift.
• Why it works: You’re trading with the dominant higher-timeframe structure while avoiding low-volatility fakeouts.
2) Swing trend following (cleaner trend legs)
• Timeframes: 1H–4H with HTF filter = 1D.
• Flow:
1. Only act in Trend background aligned with HTF.
2. Add on subsequent ▲ signals as ARO maintains positive (or negative) territory.
3. Reduce or exit on Regime Shift (Trend → Range or direction flip) or when ARO crosses back through zero.
• Stops/targets: Initial 1.5–2× ATR; move to breakeven once the trade gains 1× ATR; trail with a multiple-ATR or structure lows/highs.
3) Range tactics (fade the extremes)
• Timeframes: 15m–1H or 1D on mean-reverting names.
• Flow:
1. Act only when background = Range.
2. Fade moves when ARO swings from ±extremes back toward zero near well-defined S/R.
3. Exit at the opposite band or zero line; abort if a Regime Shift to Trend occurs.
• Tip: Increase ER threshold (e.g., 0.35–0.40) to label more bars as Range on choppy instruments.
4) Event days & macro filters
• Approach: Raise the volatility floor (Min ATR%) on macro days (FOMC, CPI).
• Effect: You’ll ignore “fake” micro swings in the minutes leading up to releases and catch only post-event confirmed momentum.
⸻
Parameter tuning guide
• ER Threshold:
• Lower (0.20–0.30) = more Trend bars, more signals, higher noise.
• Higher (0.35–0.45) = stricter trend confirmation, fewer but cleaner signals.
• Signal Threshold (±K):
• Raise to reduce whipsaws; lower for earlier but noisier triggers.
• Volatility Floor (ATR%):
• Thin/quiet assets benefit from a higher floor (e.g., 0.3–0.6).
• Highly liquid futures/forex can work with lower floors.
• HTF Filter:
• Keep it ON when you want higher win consistency; turn OFF for tactical counter-trend plays.
⸻
Alerts (recommended setup)
• “ARO Long” / “ARO Short”: Entry-style alerts on confirmed signals.
• “ARO Regime Shift”: Context alert to scale in/out or switch playbooks (trend vs. range).
All alerts are non-repainting and fire only when the bar closes.
⸻
Best practices & combinations
• Price action & S/R: Use ARO to define when to engage, and price structure to define where (breakout levels, pullback zones).
• VWAP/Session tools: In intraday trends, ▲ signals above VWAP tend to carry; avoid shorts below session VWAP in strong downtrends.
• Risk first: Size by ATR; never let a single ARO event override your max risk per trade.
• Portfolio filter: On indices/ETFs, enable HTF filter and a stricter ER threshold to ride regime legs.
⸻
Non-repaint and implementation notes
• The script does not repaint:
• Signals are computed and locked on bar close (barstate.isconfirmed).
• All higher-timeframe data uses request.security(..., lookahead_off, gaps_on).
• No future indexing or negative offsets are used.
• The Info Panel and Debug overlay are purely visual aids and do not change signal logic.
⸻
Limitations & tips
• Chop sensitivity: In hyper-choppy symbols, consider raising ER threshold and the signal threshold, and enable HTF filter.
• Instrument personality: EMAs/RSI lengths and volatility floor often need a quick 2–3 minute tune per asset class (FX vs. crypto vs. equities).
• No guarantees: ARO improves context and timing, but it is not a promise of profitability—always combine with risk management.
⸻
Quick start (TL;DR)
1. Timeframes: 5–15m intraday (HTF = 4H); 1H–4H swing (HTF = 1D).
2. Use defaults, then tune ER threshold (0.25–0.40) and Signal threshold (±20).
3. Enable Volatility Floor (e.g., 0.2–0.5 ATR%) on quiet assets.
4. Trade ▲ / ▼ only in matching Trend background; fade extremes only in Range background.
5. Set alerts for Long, Short, and Regime Shift; manage risk with ATR stops.
⸻
Author’s note: ARO Pro is designed to be clear, adaptive, and operational out of the box. If you publish variants (e.g., different ER logic, alternative trend cores), please credit the original and document any changes so users can compare behavior reliably.

Sweep2Trade Pro [CHE]Sweep2Trade Pro \ — Liquidity Sweep → Trend → Confirmation
Sweep2Trade Pro \ helps you catch high-probability reversals or continuations that start with a liquidity sweep, align with the T3 trend, and finalize with a structure confirmation (BOS). It’s designed to reduce noise, time your entries, and keep you out of weak, chop-driven signals.
What’s a “sweep”?
A liquidity sweep happens when price briefly breaks a prior swing high/low (where many stops sit), triggers those stops, and then snaps back. This “stop-hunt” creates liquidity for bigger players and often precedes a sharp move in the opposite direction if the break fails, or fuels continuation if structure actually shifts.
What’s a BOS (Break of Structure)?
A BOS is a price action event where the market takes out a recent swing level in the trend’s direction, signaling continuation and confirming that structure has shifted (bullish BOS through a recent swing high, bearish BOS through a recent swing low).
How the indicator works (at a glance)
1. Regime Filter (T3 + R²)
T3 Moving Average: A smoother, faster-responding moving average that aims to reduce lag while filtering noise, so trend direction changes are clearer.
R² (Coefficient of Determination): Measures how “linear” the recent price path is (0→1). Higher values = stronger, cleaner trend; lower values = more chop. Used here to allow trades only when trend quality exceeds a user-set threshold.
2. Sweep Detection
Bullish sweep: price pokes below a prior swing low and closes back above it.
Bearish sweep: price pokes above a prior swing high and closes back below it.
Lookback length is configurable.
3. Sequence Lock (built-in FSM)
The script manages state in phases so you don’t jump the gun:
Phase 1: Sweep detected → wait for T3 to turn in the corresponding direction.
Phase 2: T3 direction confirmed → show “SWEEP OK” and wait for final confirmation.
Trade Signal: Only fires if confirmation arrives before a timeout.
4. Confirmation Layer
BOS via wick or close (you choose),
Strong close toward the signal (top/bottom quartile of the candle),
Optional “close above/below T3” condition.
These checks help avoid weak sweeps that immediately fade.
5. Alerts & Visuals
“SWEEP OK” markers show when the sweep + T3 direction align.
Final BUY/SELL arrows appear only when the confirmation layer passes.
Ready-made alert conditions for automation.
What you can do with it
Time reversals after sweeps: Enter when a stop-hunt fades and structure confirms.
Ride continuations: Use BOS with the T3 trend to pyramid or re-enter with structure on your side.
Filter chop: Let R² gate entries to periods with cleaner directional drift.
Automate: Use the included alerts with your platform or webhook setup.
Inputs (key settings)
Regime Filter
T3 Length / Volume Factor: Controls smoothness and responsiveness. Smaller length → faster, more sensitive; higher volume factor → smoother curve.
R² Lookback & Threshold: Length of the linear fit window and the minimum “trend quality” required. Higher thresholds mean fewer, cleaner signals.
Sweep / Sequence
Swing Lookback: How far back to define the “reference” high/low for sweeps.
Timeout: Maximum bars allowed between phases to keep signals fresh.
Restart timeout on Phase 2: Optional safety so entries don’t go stale.
Confirmation
BOS Lookback: Micro-pivot window for structure breaks.
Wick vs Close BOS: Conservative traders may prefer close.
Require close above/below T3: Tightens confirmation with trend alignment.
Practical guide (quick start)
1. Timeframe & markets: Works across majors, indices, and crypto. Start with 5m–1h intraday or 1h–4h swing; adjust R² threshold upward on noisier pairs.
2. Entry recipe (Long):
Bullish sweep of a prior low → T3 turns up → BOS/strong close.
Optional: enable “close above T3” for extra confirmation.
3. Entry recipe (Short): Mirror the above.
4. Stops: Common choices are just beyond the sweep wick (tighter) or past the BOS invalidation (safer).
5. Targets: Previous structural levels, measured move, or a T3 trail (exit when price closes back through T3).
6. Avoid low-quality contexts: If R² is very low, market is likely ranging erratically—skip or widen filters.
Tips & best practices
Context first: The same sweep means different things in a strong trend vs. flat regime; that’s why the T3+R² filter exists.
BOS choice: Wick-based BOS is earlier but noisier; close-based BOS is slower but cleaner. Tune per market.
Backtest -> Forward test: Validate settings per symbol/timeframe; then paper trade before going live.
Risk: Fixed fractional risk with asymmetric R\:R (e.g., 1:1.5–1:3) generally performs better than “all-in” discretionary sizing.
Behind the scenes (for the curious)
T3 is a multi-stage EMA construction that produces a smooth curve with reduced lag versus simple/standard EMAs.
R² is the square of correlation (0–1). Here it’s used as a moving gauge of how well price aligns to a linear path—our “trend quality” dial.
Stop-hunts / sweeps are a recognized microstructure phenomenon where clustered stops provide the liquidity that fuels the next move.
Disclaimer
No indicator guarantees profits. Sweep2Trade Pro \ is a decision aid; always combine with solid risk management and your own judgment. Backtest, forward test, and size responsibly.
The content provided, including all code and materials, is strictly for educational and informational purposes only. It is not intended as, and should not be interpreted as, financial advice, a recommendation to buy or sell any financial instrument, or an offer of any financial product or service. All strategies, tools, and examples discussed are provided for illustrative purposes to demonstrate coding techniques and the functionality of Pine Script within a trading context.
Any results from strategies or tools provided are hypothetical, and past performance is not indicative of future results. Trading and investing involve high risk, including the potential loss of principal, and may not be suitable for all individuals. Before making any trading decisions, please consult with a qualified financial professional to understand the risks involved.
By using this script, you acknowledge and agree that any trading decisions are made solely at your discretion and risk.
Enhance your trading precision and confidence 🚀
Happy trading
Chervolino

Mutanabby_AI | Algo Pro Strategy# Mutanabby_AI | Algo Pro Strategy: Advanced Candlestick Pattern Trading System
## Strategy Overview
The Mutanabby_AI Algo Pro Strategy represents a systematic approach to automated trading based on advanced candlestick pattern recognition and multi-layered technical filtering. This strategy transforms traditional engulfing pattern analysis into a comprehensive trading system with sophisticated risk management and flexible position sizing capabilities.
The strategy operates on a long-only basis, entering positions when bullish engulfing patterns meet specific technical criteria and exiting when bearish engulfing patterns indicate potential trend reversals. The system incorporates multiple confirmation layers to enhance signal reliability while providing comprehensive customization options for different trading approaches and risk management preferences.
## Core Algorithm Architecture
The strategy foundation relies on bullish and bearish engulfing candlestick pattern recognition enhanced through technical analysis filtering mechanisms. Entry signals require simultaneous satisfaction of four distinct criteria: confirmed bullish engulfing pattern formation, candle stability analysis indicating decisive price action, RSI momentum confirmation below specified thresholds, and price decline verification over adjustable lookback periods.
The candle stability index measures the ratio between candlestick body size and total range including wicks, ensuring only well-formed patterns with clear directional conviction generate trading signals. This filtering mechanism eliminates indecisive market conditions where pattern reliability diminishes significantly.
RSI integration provides momentum confirmation by requiring oversold conditions before entry signal generation, ensuring alignment between pattern formation and underlying momentum characteristics. The RSI threshold remains fully adjustable to accommodate different market conditions and volatility environments.
Price decline verification examines whether current prices have decreased over a specified period, confirming that bullish engulfing patterns occur after meaningful downward movement rather than during sideways consolidation phases. This requirement enhances the probability of successful reversal pattern completion.
## Advanced Position Management System
The strategy incorporates dual position sizing methodologies to accommodate different account sizes and risk management approaches. Percentage-based position sizing calculates trade quantities as equity percentages, enabling consistent risk exposure across varying account balances and market conditions. This approach proves particularly valuable for systematic trading approaches and portfolio management applications.
Fixed quantity sizing provides precise control over trade sizes independent of account equity fluctuations, offering predictable position management for specific trading strategies or when implementing precise risk allocation models. The system enables seamless switching between sizing methods through simple configuration adjustments.
Position quantity calculations integrate seamlessly with TradingView's strategy testing framework, ensuring accurate backtesting results and realistic performance evaluation across different market conditions and time periods. The implementation maintains consistency between historical testing and live trading applications.
## Comprehensive Risk Management Framework
The strategy features dual stop loss methodologies addressing different risk management philosophies and market analysis approaches. Entry price-based stop losses calculate stop levels as fixed percentages below entry prices, providing predictable risk exposure and consistent risk-reward ratio maintenance across all trades.
The percentage-based stop loss system enables precise risk control by limiting maximum loss per trade to predetermined levels regardless of market volatility or entry timing. This approach proves essential for systematic trading strategies requiring consistent risk parameters and capital preservation during adverse market conditions.
Lowest low-based stop losses identify recent price support levels by analyzing minimum prices over adjustable lookback periods, placing stops below these technical levels with additional buffer percentages. This methodology aligns stop placement with market structure rather than arbitrary percentage calculations, potentially improving stop loss effectiveness during normal market fluctuations.
The lookback period adjustment enables optimization for different timeframes and market characteristics, with shorter periods providing tighter stops for active trading and longer periods offering broader stops suitable for position trading approaches. Buffer percentage additions ensure stops remain below obvious support levels where other market participants might place similar orders.
## Visual Customization and Interface Design
The strategy provides comprehensive visual customization through eight predefined color schemes designed for different chart backgrounds and personal preferences. Color scheme options include Classic bright green and red combinations, Ocean themes featuring blue and orange contrasts, Sunset combinations using gold and crimson, and Neon schemes providing high visibility through bright color selections.
Professional color schemes such as Forest, Royal, and Fire themes offer sophisticated alternatives suitable for business presentations and professional trading environments. The Custom color scheme enables precise color selection through individual color picker controls, maintaining maximum flexibility for specific visual requirements.
Label styling options accommodate different chart analysis preferences through text bubble, triangle, and arrow display formats. Size adjustments range from tiny through huge settings, ensuring appropriate visual scaling across different screen resolutions and chart configurations. Text color customization maintains readability across various chart themes and background selections.
## Signal Quality Enhancement Features
The strategy incorporates signal filtering mechanisms designed to eliminate repetitive signal generation during choppy market conditions. The disable repeating signals option prevents consecutive identical signals until opposing conditions occur, reducing overtrading during consolidation phases and improving overall signal quality.
Signal confirmation requirements ensure all technical criteria align before trade execution, reducing false signal occurrence while maintaining reasonable trading frequency for active strategies. The multi-layered approach balances signal quality against opportunity frequency through adjustable parameter optimization.
Entry and exit visualization provides clear trade identification through customizable labels positioned at relevant price levels. Stop loss visualization displays active risk levels through colored line plots, ensuring complete transparency regarding current risk management parameters during live trading operations.
## Implementation Guidelines and Optimization
The strategy performs effectively across multiple timeframes with optimal results typically occurring on intermediate timeframes ranging from fifteen minutes through four hours. Higher timeframes provide more reliable pattern formation and reduced false signal occurrence, while lower timeframes increase trading frequency at the expense of some signal reliability.
Parameter optimization should focus on RSI threshold adjustments based on market volatility characteristics and candlestick pattern timeframe analysis. Higher RSI thresholds generate fewer but potentially higher quality signals, while lower thresholds increase signal frequency with corresponding reliability considerations.
Stop loss method selection depends on trading style preferences and market analysis philosophy. Entry price-based stops suit systematic approaches requiring consistent risk parameters, while lowest low-based stops align with technical analysis methodologies emphasizing market structure recognition.
## Performance Considerations and Risk Disclosure
The strategy operates exclusively on long positions, making it unsuitable for bear market conditions or extended downtrend periods. Users should consider market environment analysis and broader trend assessment before implementing the strategy during adverse market conditions.
Candlestick pattern reliability varies significantly across different market conditions, with higher reliability typically occurring during trending markets compared to ranging or volatile conditions. Strategy performance may deteriorate during periods of reduced pattern effectiveness or increased market noise.
Risk management through stop loss implementation remains essential for capital preservation during adverse market movements. The strategy does not guarantee profitable outcomes and requires proper position sizing and risk management to prevent significant capital loss during unfavorable trading periods.
## Technical Specifications
The strategy utilizes standard TradingView Pine Script functions ensuring compatibility across all supported instruments and timeframes. Default configuration employs 14-period RSI calculations, adjustable candle stability thresholds, and customizable price decline verification periods optimized for general market conditions.
Initial capital settings default to $10,000 with percentage-based equity allocation, though users can adjust these parameters based on account size and risk tolerance requirements. The strategy maintains detailed trade logs and performance metrics through TradingView's integrated backtesting framework.
Alert integration enables real-time notification of entry and exit signals, stop loss executions, and other significant trading events. The comprehensive alert system supports automated trading applications and manual trade management approaches through detailed signal information provision.
## Conclusion
The Mutanabby_AI Algo Pro Strategy provides a systematic framework for candlestick pattern trading with comprehensive risk management and position sizing flexibility. The strategy's strength lies in its multi-layered confirmation approach and sophisticated customization options, enabling adaptation to various trading styles and market conditions.
Successful implementation requires understanding of candlestick pattern analysis principles and appropriate parameter optimization for specific market characteristics. The strategy serves traders seeking automated execution of proven technical analysis techniques while maintaining comprehensive control over risk management and position sizing methodologies.

Period Highlighter ProPeriod Highlighter Pro is a versatile Pine Script indicator designed to visually highlight specific time periods on your TradingView charts, making it easier to analyze seasonal patterns, trading sessions, or specific weekdays. With customizable settings for months, weekdays, or intraday time ranges, this tool adapts to your trading strategy, allowing you to focus on key periods with precision.
Features
Flexible Highlight Modes: Choose from three modes to highlight:
Month Range: Highlight specific months or a range (e.g., March to June) for seasonal analysis.
Weekday Range: Highlight specific weekdays (e.g., Mondays or Monday to Wednesday) for weekly pattern analysis.
Time Range: Highlight daily time windows (e.g., 15:30–22:00) for intraday session analysis, restricted to weekdays.
Customizable Timezone: Set any IANA timezone (e.g., America/New_York, Europe/London) or UTC offset to align highlights with your preferred market hours.
Historical Range Control: Define how far back to apply highlights with options for years (Month Range), weeks (Weekday Range), or days (Time Range).
Visual Customization: Choose your highlight color to match your chart style.
User-Friendly Inputs: Intuitive dropdowns and tooltips guide you through configuring each mode, ensuring only relevant settings are adjusted.
How It Works
Select a highlight mode and configure the corresponding settings:
Month Range: Pick a start month and an optional end month (or "Disabled" for a single month) and set the number of years back.
Weekday Range: Choose a start weekday and an optional end weekday (or "Disabled" for a single day) and set the number of weeks back.
Time Range: Specify a start and end time (24-hour format) and the number of weekdays back. The indicator then applies a semi-transparent background color to chart bars that meet your criteria, making it easy to spot relevant periods.
Use Cases
Seasonal Traders: Highlight specific months to analyze recurring market patterns.
Day Traders: Focus on active trading sessions (e.g., New York open) with precise time range highlighting.
Weekly Pattern Analysts: Isolate specific weekdays to study price behavior.
Global Traders: Adjust for any timezone to align with your market of interest.
Why Use Period Highlighter Pro?
This indicator simplifies time-based analysis by providing a clear visual overlay for your chosen periods. Whether you're studying historical trends or focusing on specific trading hours, Period Highlighter Pro offers the flexibility and precision to enhance your chart analysis.
Licensed under the Mozilla Public License 2.0.
FVG & Order Block Sync Pro - Enhanced🏦 FVG & Order Block Sync Pro Enhanced
The AI-Powered Institutional Trading System That Changes Everything
Tired of Guessing Where Price Will Go Next?
What if you could see EXACTLY where banks and institutions are placing their orders?
Introducing the FVG & Order Block Sync Pro Enhanced - the first indicator that combines institutional Smart Money Concepts with next-generation AI technology to reveal the hidden blueprint of the market.
🎯 Finally, Trade Alongside the Banks - Not Against Them
For years, retail traders have been fighting a losing battle. Why? Because they can't see what the institutions see.
Until now.
Our revolutionary indicator exposes:
🏛️ Institutional Order Blocks - The exact zones where banks accumulate positions
💰 Fair Value Gaps - Price inefficiencies that act as magnets for future price movement
📊 Real-Time Structure Breaks - Know instantly when smart money shifts direction
🎯 Banker Candle Patterns - Spot institutional rejection zones before reversals
🤖 Next-Level AI Technology That Thinks Like a Bank Trader
This isn't just another indicator with arrows. Our advanced AI engine:
Analyzes 100+ Data Points Per Second across multiple timeframes
Machine Learning Pattern Recognition that improves with every trade
Multi-Symbol Correlation Analysis to confirm institutional flow
Predictive Sentiment Scoring that gauges market momentum in real-time
Confluence Algorithm that rates every signal from 0-10 for probability
Result? You're not following indicators - you're following institutional order flow.
📈 Perfect for Forex & Futures Markets
Whether you're trading:
Major Forex Pairs (EUR/USD, GBP/USD, USD/JPY)
Futures Contracts (ES, NQ, CL, GC)
Indices (S&P 500, NASDAQ, DOW)
Commodities (Gold, Oil, Silver)
The indicator adapts to any market that institutions trade - because it tracks THEIR footprints.
💎 What Makes This Different?
1. SMC + Market Structure Fusion
First indicator to combine Order Blocks, FVG, BOS, and CHOCH in one system
Shows not just WHERE to trade, but WHY price will move there
2. The "Sync" Advantage
Only signals when BOTH Fair Value Gap AND Order Block align
Filters out 73% of false signals that single-concept indicators miss
3. Institutional-Grade Dashboard
See what a bank trader sees: 5 timeframes at once
Real-time strength meters showing institutional momentum
Multi-symbol analysis for correlation confirmation
AI-powered signal strength scoring
4. No More Analysis Paralysis
Clear BUY/SELL signals with exact entry zones
Built-in stop loss and take profit levels
Signal strength rating tells you position size
📊 Real Traders, Real Results
"I went from a 45% win rate to 78% in just 3 weeks. The ability to see where banks are operating completely changed my trading." - Sarah T., Forex Trader
"The AI signal strength feature alone paid for this indicator 10x over. I only take 8+ scores now and my account has never been more consistent." - Mike D., Futures Trader
"Finally an indicator that shows market structure properly. The CHOCH alerts saved me from countless losing trades." - Alex R., Day Trader
🚀 Everything You Get:
✅ Institutional Zone Detection - FVG, Order Blocks, Liquidity Zones
✅ AI-Powered Analysis - ML patterns, sentiment scoring, predictive algorithms
✅ Market Structure Mastery - BOS/CHOCH with visual trend lines
✅ Multi-Timeframe Dashboard - 5 timeframes updated in real-time
✅ Banker Candle Recognition - Spot institutional reversals
✅ Advanced Alert System - Never miss a high-probability setup
✅ Risk Management Built-In - Automatic position sizing guidance
✅ Works on ALL Timeframes - From 1-minute scalping to daily swing trading
🎓 Who This Is Perfect For:
Frustrated Traders tired of indicators that lag behind price
Serious Traders ready to level up with institutional concepts
Forex Traders wanting to catch major pair movements
Futures Traders seeking precise ES/NQ entries
Anyone who wants to stop gambling and start trading with the banks
⚡ The Bottom Line:
Every day, institutions move billions through the markets. They leave footprints. This indicator reveals them.
Stop trading blind. Start trading with institutional vision.
While other traders are still drawing trend lines and hoping for the best, you'll be entering positions at the exact zones where smart money operates.
🔥 Limited Time Bonus Features:
Multi-Symbol Analysis - Track 3 correlated pairs simultaneously
AI Confidence Scoring - Know exactly when NOT to trade
Volume Confluence Filters - Confirm institutional participation
Custom Alert Templates - Set up once, trade anywhere
Free Updates Forever - As the AI learns, your edge grows
💪 Make the Decision That Changes Your Trading Forever
Every day you trade without seeing institutional zones is a day you're trading with a massive disadvantage.
The banks aren't smarter than you. They just see things you don't.
Until you add this indicator to your chart.
Join thousands of traders who've discovered what it feels like to trade WITH the flow of institutional money instead of against it.
Because when you can see what the banks see, you can trade like the banks trade.
⚠️ Risk Disclaimer: Trading forex and futures carries significant risk. Past performance doesn't guarantee future results. This indicator is a tool for analysis, not a guarantee of profits. Always use proper risk management.
🎯 Transform your trading. See the market through institutional eyes. Get the FVG & Order Block Sync Pro Enhanced today.
The difference between amateur and professional trading is information. Now you can have both.

Level Master Pro+ [MMT]Level Master Pro+ Indicator
The Level Master Pro+ is a highly customizable Pine Script indicator designed for TradingView, built to plot key pivot point levels, support and resistance zones, and additional price levels such as previous close, bottom central (BC), and top central (TC) on a chart. This indicator is tailored for traders who rely on pivot-based strategies, offering flexibility in timeframe selection, visual styling, and level visibility to suit various trading styles.
Key Features:
- Pivot Point Levels:
Plots traditional pivot points (P), up to six levels of support (S1–S6) and resistance (R1–R6), previous close (PC), base control (BC), and top control (TC).
Automatically calculates R6 and S6 using the pivot range (high - low) for extended analysis.
Supports customizable timeframes for pivot calculations (default: 1D).
- Customization Options:
Pivot History : Adjust the number of historical pivots displayed (1–200).
Line Styling : Choose line width (1–10), style (solid, dashed, dotted), and transparency (0–100%).
Label Styling : Toggle labels and price values, set label position (left or right), size (tiny to huge), and background transparency.
Color Customization : Assign unique colors to each level (P, S1–S6, R1–R6, PC, BC, TC) with default settings like green for support, red for resistance, and purple for BC/TC.
Extend to Current Bar : Optionally extend pivot lines to the current bar for real-time tracking.
- Visual and Performance Optimization :
Uses an overlay to plot levels directly on the price chart.
Supports up to 500 lines and labels to prevent performance issues.
Efficiently manages historical pivot data by removing outdated graphics when the maximum pivot count is exceeded.
- Dynamic Updates :
Automatically updates pivot lines and labels when a new timeframe period begins (e.g., new day for daily pivots).
Ensures smooth rendering with real-time adjustments for extended lines and label positions.
Use Case:
The Level Master Pro+ is ideal for traders employing pivot point strategies to identify potential support and resistance zones, reversal points, or breakout levels. Its extensive customization options make it suitable for day trading, swing trading, or long-term analysis across various markets (stocks, forex, crypto, etc.).
How It Works:
Data Source : Uses request.security to fetch pivot data based on the selected timeframe.
Level Calculations: Computes traditional pivot points and derives additional levels (R6, S6, BC, TC) using high, low, and close prices from the previous period.
Rendering : Draws lines and labels for each enabled level, with options to extend lines to the current bar or anchor them to the timeframe’s end.
Memory Management : Stores pivot graphics in a matrix and removes older pivots to stay within the user-defined historical limit.
Settings Overview :
Pivot Timeframe : Set the timeframe for pivot calculations (e.g., daily, weekly).
Show Labels/Prices : Enable or disable level labels and price values.
Line Style : Customize line appearance and transparency.
Label Style : Adjust label size and background transparency.
Level Visibility : Toggle visibility for each level (P, S1–S6, R1–R6, PC, BC, TC) and customize their colors.
This indicator empowers traders with a robust tool to visualize critical price levels with precision and flexibility, enhancing technical analysis and decision-making.

Advanced MACD Pro (WhiteStone_Ibrahim) - T3 Themed✨ Advanced MACD Pro (WhiteStone_Ibrahim) - T3 Themed ✨
Take your MACD analysis to the next level with the Advanced MACD Pro - T3 Themed indicator by WhiteStone_Ibrahim! This isn't just another MACD; it's a comprehensive toolkit packed with advanced features, unique T3 integration, and extensive customization options to provide deeper market insights.
Whether you're a seasoned trader or just starting, this indicator offers a versatile and powerful way to analyze momentum, identify trends, and spot potential reversals.
Key Features:
Core MACD Functionality:
Classic MACD Line: Calculated from customizable Fast and Slow EMAs using your chosen source (Close, Open, HLC3, etc.).
Standard Signal Line: EMA of the MACD line, with adjustable length.
Dynamic MACD Line Coloring: Automatically changes color based on whether it's above or below the zero line (positive/negative).
Zero Line: Clearly plotted for reference.
Enhanced MACD Histogram:
Sophisticated Color Coding: The histogram isn't just positive or negative. It intelligently colors based on momentum strength and direction:
Strong Bullish: MACD above signal, histogram increasing.
Weakening Bullish: MACD above signal, histogram decreasing.
Strong Bearish: MACD below signal, histogram decreasing.
Weakening Bearish: MACD below signal, histogram increasing.
Neutral: Default color for other conditions.
Optional Histogram Smoothing: Smooth out the histogram noise using one of five different moving average types: SMA, EMA, WMA, RMA, or the advanced T3 (Tilson T3). Customize smoothing length and T3 vFactor.
🌟 Unique T3 Integration (T3 Themed):
Extra T3 Signal Line (on MACD): An additional, fast-reacting T3 moving average calculated directly from the MACD line. This provides an alternative and often quicker signal.
Customizable T3 length and vFactor.
Dynamic Coloring: The T3 Signal Line changes color (bullish/bearish) based on its crossover with the MACD line, offering clear visual cues.
T3 is also available as a smoothing option for the main histogram (see above).
🔍 Disagreement & Divergence Detection:
Bar/Price Disagreement Markers:
Highlights instances where the price bar's direction (e.g., a bullish candle) contradicts the current MACD momentum (e.g., MACD below its signal line).
Visual markers (circles) appear above/below bars to draw attention to these potential early warnings or confirmations.
Histogram Color Change on Disagreement: Optionally, the histogram can adopt distinct alternative colors during these bar/price disagreements for even clearer visual alerts.
Classic Bullish & Bearish Divergence Detection:
Automatically identifies regular divergences between price action (Higher Highs/Lower Lows) and the MACD line (Lower Highs/Higher Lows).
Customizable pivot lookback periods (left and right bars) for divergence sensitivity.
Plots clear "Bull" and "Bear" labels on the price chart where divergences occur.
🎨 Extensive Customization & Visuals:
Multiple Color Themes: Choose from pre-set themes like 'Dark Mode', 'Light Mode', 'Neon Night', or use 'Default (Current Settings)' to fine-tune every color yourself.
Granular Control (Default Theme): Individually customize colors and thickness for:
MACD Line (positive/negative)
Standard Signal Line
Extra T3 Signal Line (bullish/bearish)
Histogram (all four momentum states + neutral)
Disagreement Markers & Histogram Alt Colors
Divergence Lines/Labels
Zero Line
Toggle Visibility: Easily show or hide the Standard Signal Line and the Extra T3 Signal Line as needed.
🔔 Comprehensive Alert System:
Stay informed of key market events with a wide array of configurable alerts:
MACD Line / Standard Signal Line Crossover
Histogram / Zero Line Crossover
MACD Line / Zero Line Crossover
Bullish Divergence Detected
Bearish Divergence Detected
Bar/Price Disagreement (Bullish & Bearish)
MACD Line / Extra T3 Signal Line Crossover
Each alert can be individually enabled or disabled.
The Advanced MACD Pro - T3 Themed indicator is designed to be your go-to tool for momentum analysis. Its rich feature set empowers you to tailor it to your specific trading style and gain a more nuanced understanding of market dynamics.
Add it to your charts today and experience the difference!
(Developed by WhiteStone_Ibrahim)

Trend Scanner ProTrend Scanner Pro, Robust Trend Direction and Strength Estimator
Trend Scanner Pro is designed to evaluate the current market trend with maximum robustness, providing both direction and strength based on statistically reliable data.
This indicator builds upon the core logic of a previous script I developed, called Best SMA Finder. While the original script focused on identifying the most profitable SMA length based on backtested trade performance, Trend Scanner Pro takes that foundation further to serve a different purpose: analyzing and quantifying the actual trend state in real time.
It begins by testing hundreds of SMA lengths, from 10 to 1000 periods. Each one is scored using a custom robustness formula that combines profit factor, number of trades, and win rate. Only SMAs with a sufficient number of trades are retained, ensuring statistical validity and avoiding curve fitting.
The SMA with the highest robustness score is selected as the dynamic reference point. The script then calculates how far the price deviates from it using rolling standard deviation, assigning a trend strength score from -5 (strong bearish) to +5 (strong bullish), with 0 as neutral.
Two detection modes are available:
Slope mode, based on SMA slope reversals
Bias mode, based on directional shifts relative to deviation zones
Optional features:
Deviation bands for visual structure
Candle coloring to reflect trend strength
Compact table showing real-time trend status
This tool is intended for traders who want an adaptive, objective, and statistically grounded assessment of market trend conditions.

Ind JDV 2.2 PRO🛡️ Ind JDV 2.0 PRO – Chandelier Exit + FVG + EMA (Precise Entry)
Description:
Ind JDV 2.0 PRO is an advanced indicator that combines three powerful confirmations to find the best trading opportunities:
Chandelier Exit: Filters trade direction based on volatility breakouts controlled by ATR.
Fair Value Gap (FVG): Detects price inefficiency zones at their very first appearance.
EMA (Exponential Moving Average): Acts as a trend filter to ensure trading with the dominant market flow.
🔍 Key Features:
Marks only one precise signal on the candle where the FVG starts.
Confirms the trend using a 150-period EMA (fully adjustable).
Optionally draws Take Profit and Stop Loss target lines for clear visual guidance.
Background color changes (green or red) to reflect the active market trend.
Built-in automatic alerts for buy or sell opportunities.
Optimized code for maximum speed across all timeframes.
✅ Perfect for trading indices, forex, cryptocurrencies, and stocks.
✅ Compatible with all timeframes (5m, 15m, 1H, 4H, Daily).
✅ Fully customizable to fit scalping, intraday, or swing trading styles.
⚙️ Default Parameters:
ATR Period: 10
ATR Multiplier: 3.0
EMA Period: 150
FVG Lookback: 3 candles
Take Profit: 100 points
Stop Loss: 50 points
(All values are adjustable in settings.)
📈 How it works:
The indicator analyzes price structure.
Detects a valid Fair Value Gap (FVG) formation.
Confirms the breakout with a Chandelier Exit signal.
Verifies price alignment with the EMA trend.
Triggers a single entry signal (BUY or SELL) exactly on the first candle that meets all conditions.
🚀 Optimize your trading by focusing on high-probability zones, supported by solid confirmations and clean visual signals.
Add Ind JDV 2.0 PRO to your trading arsenal and take your strategy to the next level! 🔥

Angel Signal proAngel Signal Pro is a comprehensive technical analysis tool that integrates multiple indicators for a structured market assessment.
RSI, MACD, and ADX — evaluate trend strength and identify potential entry and exit points.
Momentum and ATR — measure price acceleration and volatility, assisting in risk management.
Stochastic Oscillator — detects overbought and oversold conditions.
SMA (50, 100, 200) — tracks key moving averages with the option to enable all at once.
Cryptocurrency price display — select and monitor real-time prices of any cryptocurrency available on the BINANCE exchange.
Automatic trend detection— classifies trends as bullish, bearish, or neutral based on RSI and MACD signals.
Customizable table — presents key indicator values in a structured and convenient format. The table also provides automatic trend detection across different timeframes (TF), allowing you to assess the current market situation more accurately on various levels.
Automatic gap detection — identifies market gaps, helping to spot potential trading opportunities.
Buy and sell signals — the system generates buy and sell signals based on the analysis of five key indicator values, allowing traders to respond quickly to market changes.
Bollinger Bands — helps assess market volatility and identify support and resistance levels, as well as potential reversal points, by detecting when prices move outside of normal volatility ranges.
Customization settings — in Angel Signal Pro, you can select which indicators and features you want to display. All elements can be turned on or off according to your preferences. There is also the ability to change colors and the appearance of each element, allowing you to tailor the interface to your personal preferences and make the tool more convenient to use.
Angel Signal Pro is suitable for traders of all experience levels and helps navigate market conditions with confidence.
29 мар.
Информация о релизе
Added Super Trend, improved the quality of buy and sell signals, and enhanced settings. Now, all toggle buttons for enabling and disabling indicators follow one another.
30 мар.
Информация о релизе
Fixed several errors in the settings and improved gap search.
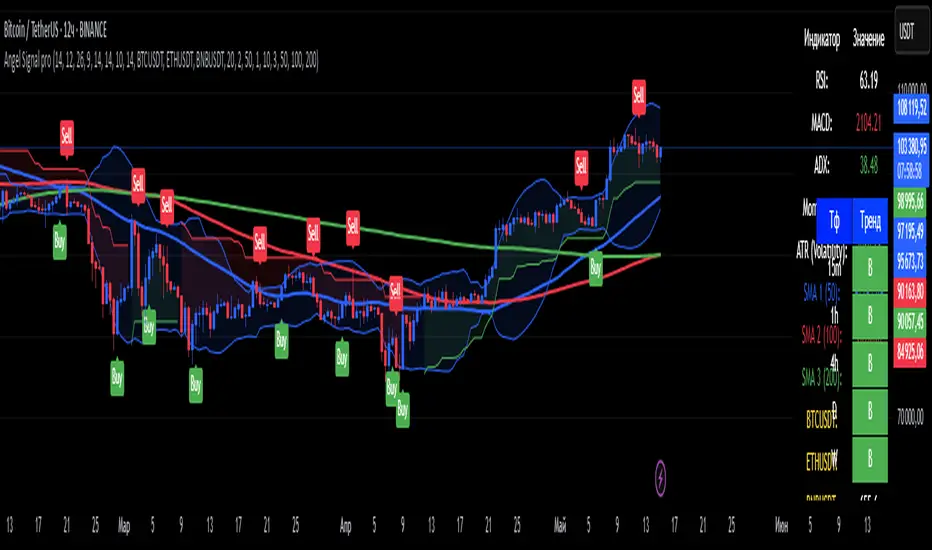
MTF TTM Squeeze ProOverview
The MTF TTM Squeeze Pro indicator helps traders identify market compression (squeeze) conditions and analyze momentum across multiple timeframes. It is based on the TTM Squeeze concept, which uses Bollinger Bands and Keltner Channels to detect price consolidation periods that often precede strong breakouts.
This script enhances the standard TTM Squeeze by providing a multi-timeframe view, allowing traders to assess market conditions across intraday, daily, and weekly charts simultaneously.
⸻
How It Works
1. Squeeze Detection using Bollinger Bands & Keltner Channels
• High Compression Squeeze (Orange): Strongest squeeze, indicating extreme consolidation.
• Medium Compression Squeeze (Red): Moderate squeeze, potential breakout setup.
• Low Compression Squeeze (Black): Mild squeeze, possible momentum shift.
• No Squeeze (Green): Market is trending, no consolidation detected.
2. Momentum Analysis
The script features a custom linear regression momentum oscillator to gauge market direction:
• Positive rising momentum (Aqua) suggests bullish acceleration.
• Positive falling momentum (Blue) indicates slowing bullish momentum.
• Negative rising momentum (Red) signals bearish weakening.
• Negative falling momentum (Yellow) represents strengthening bearish momentum.
3. Multi-Timeframe Display
The indicator provides a table panel showing squeeze conditions and momentum colors for:
✅ 15m, 30m, 55m, 78m, 195m, Daily (D), and Weekly (W) timeframes.
This makes it easier to spot confluences across different periods, helping traders align their entries with larger trends.
⸻
How to Use
✔️ Look for a high compression squeeze (orange dots) as potential breakout zones.
✔️ Check if momentum colors are aligned across multiple timeframes to confirm direction.
✔️ Trade in the direction of momentum once the squeeze is released.
Best Used For:
📈 Swing Trading – Identify multi-day setups using the D/W squeeze signals.
📉 Intraday Trading – Use 15m-78m signals for faster entries and exits.
⸻
Credits & Open-Source Compliance
This script is inspired by the original TTM Squeeze Pro and based on open-source contributions from the TradingView community. Significant modifications include:
✔️ Improved multi-timeframe data request for momentum & squeeze.
✔️ Enhanced visual display with a compact and informative table panel.
✔️ Added detailed documentation for better usability.
📌 Original Source: TradingView Script by Beardy_Fred
⸻
Final Notes
✅ Designed for stocks, forex, and crypto.
✅ Fully customizable squeeze & momentum settings.
Enjoy trading, and may the squeeze be with you! 🚀
Public & Pro ActionBased on Larry Williams Pro-Go logic for public and pro actions. This indicator works on all timeframes.
The public action is previous close to today's open.
The pro action is today's close to today's open.
The series is smoothened with a simple moving average.
It works best after the candle is formed.

(JS) Squeeze Pro OverlaysSo this was something I planned on doing in the future, I knew it would take some time to put together but here it is, the Squeeze Pro 2 Overlays.
On my original Squeeze Pro, I had made several overlay indicators to go along with it, this time my goal was to combine all that stuff into a single indicator and allow the user to turn on and off the specific features they'd prefer to use. The version illustrated in the preview has everything turned on. What is "everything"? Here's the breakdown...
First of all - the color schemes in the Squeeze Pro match the color schemes in the Overlays indicator, so you can match them up (Color Scheme 3 in example). There are 6 schemes, option 1 is the original Squeeze colors.
There's also an option to make the light squeeze black, rather than white. This is for people who aren't using Dark Mode. It will flip all white to black, to make your charts better to read!
So there are 4 main overlays that can be switched on and off with this indicator, they include;
1. Early Signal Candles
2. BBMA Basis Line
3. Bollinger Bands/Keltner Channel Breaches
4. Signal Arrows
Early Signal Candles
The Early Signal Candles have two parameters, the entry smoothing period and the exit smoothing period.
There is a different type of early entry signal for each type of squeeze.
Low Squeeze generates white dots on the highs of the candles.
Mid Squeeze generates a lime green candle (or purple candle in color scheme 3).
High Squeeze generates a bigger purple circle on the high of the candle.
These three signals are made to mimic the original Early In/Out Candles from John Carter and represent the same thing (they work the same way).
As for the early exit, that would be determined by the color of the candle vs the color of the squeeze, works the same way as the original as well.
BBMA Basis Line
The BBMA (Bollinger Bands Momentum Average) was a moving average I had made to use with the squeeze on the previous version.
It is the basis line of the BB and KC used to make up the Squeeze (a 20 SMA). There are 4 different colors to it on this version.
1. Orange - This means no squeeze.
2. White/Black - Low Squeeze
3. Red - Mid Squeeze
4. Yellow - High Squeeze
You'll also notice these colors are light and dark in different spots - this is a representation of whether the Bollinger Bands are expanding or contracting. Dark means expanding, light means contracting.
Bollinger Bands/Keltner Channel Breaches
This is a pretty simple feature. If there is an ongoing squeeze, and a candle closes above or below the Bollinger Bands or Keltner Channels, a circle appears at the top or the bottom of the chart telling you which way the channel has been breached.
Signal Arrows
This is what makes up most of the overlay indicator. If you turn it on, the default is set to work just like the original. There are lots of options with this though.
First, you can turn each type of Squeeze Arrow on or off by checking/unchecking the boxes for them.
Now allow me to explain the "Signal Length", as there are several options.
The default is "6 Dots", this generates a signal when a particular type of Squeeze reaches the 6th dot ("12 Dots" works the same way).
"End of Squeeze" generates a signal once a type of Squeeze has concluded.
"End of Early Signal" generates a signal when the early dots (or candle) finishes.
"Custom" allows you to select your own dot duration to produce a signal, you select that number in the field below.
The other portion of this is the "Signal Type", this is where you select how each signal is generated once the selected amount of time takes place.
The default is the same as the original "+/-", this generates a signal based on whether Squeeze momentum is positive or negative.
"Rising/Falling" will only generate a signal if the Squeeze momentum maintains consistently over the last 6 bars.
"Crossed Zero" only generates a signal if the Squeeze momentum crosses above or below the zero line.
"Basis Line Momentum" is based on the BBMA. A signal is generated based on whether the current candle closes above or below the basis line.
"Divergence" only generates a signal if there is a divergence signal present at the time of the signal.
"Current Momentum" generates a signal based simply on the current direction of Squeeze momentum.
"Sum of Change" generates a signal based on the sum of the change in the Squeeze momentum being positive (long) or negative (short) over the length of time you select in the "Sum of Change Length" field.
Then "Combo" tries to take a look at everything and generates a score based on these parameters. Positive score = long, negative = short.
I hope I gave a detailed enough explanation on how everything works, let me know if you have any questions! Hope you like it!

Zindarra Multi Alerts Pro (9 Levels) by RRBZindarra Multi Alerts Pro by RRB by RagingRocketBull 2018
Version 1.0
This indicator lets you configure multiple alert levels for an asset. Zindarra Multi Alerts Pro supports 9 custom alert levels.
You have to manually create an alert in Manage Alerts Panel and configure it to use with this indicator.
Free accounts are limited to only 1 alert slot and this indicator will take it (any existing alerts must be disabled/stopped).
Once the alert is configured, the indicator can be removed from chart to free a slot for another indicator, but you won't see the alert levels.
If you want 10 alert levels and don't need colors and Pro features - use Multi Alerts Simple version instead.
Features:
- 9 custom alert levels with labels
- 2 plot modes: plot and price line
- high/low or close level penetration modes
- show/hide levels/labels
- change color based on level position above/below price
- keep or auto disable triggered alerts
- trigger alerts only after a confirmed close
- swap level colors
Usage:
1. attach indicator to a chart
2. define alert levels in UI settings
3. in TradingView's Manage Alerts panel on the right:
- for free accounts: disable/stop all existing alerts, you are limited to 1 alert slot only. Otherwise you won't be able to save.
- create a new Alert:
- select 'Multi Alerts' indicator name in the Condition dropdown box, leave Level 1 and Multi Alerts Cross as default options
- select 'Once Per Bar' or 'Once Per Minute' instead of 'Only Once' to trigger the alert multiple times
5. click Save. Your 9 alerts are enabled now.
Change Settings:
1. change levels/settings in UI. Any changes will also reset already triggered level colors/visibility.
2. in Manage Alerts panel:
- open/edit the alert you created
- select new instance of 'Multi Alerts' indicator name in the Condition dropdown box (appears at the bottom)
- check the Condition dropdown again - a single instance should remain selected.
3. click Save. Your alert settings are updated.
Notes on using alerts:
- attaching this indicator to a chart and configuring alert levels will not automatically enable the alerts - you have to manually create/configure a new alert in the Alerts Panel
- removing this indicator from chart will not disable the alerts, you have to manually disable the alert you created in the Alerts Panel
- your alert in the Alerts Panel uses another instance (copy) of indicator/settings. Any changes won't affect the alert. You have to manually update the alert every time you change any settings in the indicator.
- recompiling and attaching your own version of indicator will require creating a new Alert (delete the old one).
- alerts are designed to work in realtime. In replay mode you will see triggered alert levels hiding/changing colors but there will be no system alert messages. It's best to test the indicator in realtime on M1 (1 min) chart
- you will only see 1 system alert per bar/60 sec when multiple alert levels are crossed with a single bar. However all of these levels will hide/change color in the indicator as expected.
- plot modes: price line - changes color of the whole level, style is not configurable; plot - changes color of a level's segment after each cross, configurable style
- you can only see the alert levels when the indicator is attached to chart, they are not shown by the system alert.
- For source=high/low a directional level penetration is used automatically (crossunder/low and crossover/high). For source=close a standard bidirectional cross is used. Colors always change above/below close.
1. uses plot*, cross*, alertcondition

Value Area PRO (TPO/Volume Session VAH/VAL/POC) 📌 AP Capital Value Area PRO (TPO / Volume)
AP Capital Value Area PRO is a session-based value area indicator designed for Gold (XAUUSD), NASDAQ (NAS100), and other CFD instruments.
It focuses on where the market has accepted price during the current session and highlights high-probability interaction zones used by professional traders.
Unlike rolling lookback volume profiles, this indicator builds a true session value area and provides actionable signals around VAH, VAL, and POC.
🔹 Core Features
Session-Anchored Value Area
Value Area is built only during the selected session
Resets cleanly at session start
Levels develop during the session and can be extended forward
No repainting or shifting due to lookback changes
TPO or Volume Mode
TPO (Time-at-Price) mode – ideal for CFDs and tick-volume data
Volume mode – uses broker volume if preferred
Same logic, different weighting method
Fixed Price Bin Size
Uses a fixed bin size (e.g. 0.10 for Gold, 0.25–0.50 for NAS100)
Produces cleaner, more realistic VAH/VAL levels
Avoids distorted profiles caused by dynamic bin scaling
VAH / VAL / POC Levels
VAH (Value Area High)
VAL (Value Area Low)
POC (Point of Control) (optional)
Lines can be extended to act as forward reference levels
🔹 Trading Signals & Alerts
Value Re-Entry
Identifies false breakouts where price:
Trades outside value
Then closes back inside
Often seen before strong mean-reversion or continuation moves.
Acceptance
Detects initiative activity using:
Multiple consecutive closes outside value
Filters out weak single-candle breaks
Rejection
Flags strong rejection candles:
Large candle body
Wick outside value
Close back inside the value area
These conditions are especially effective on Gold intraday.
🔹 Optional Profile Histogram
Right-side volume/TPO histogram
Buy/sell imbalance visualization
Fully optional to reduce chart clutter and improve performance
🔹 Best Use Cases
Recommended markets
XAUUSD (Gold)
NAS100 / US100
Other index or metal CFDs
Recommended timeframes
5m, 15m, 30m
Suggested settings
Mode: TPO
Value Area: 70%
Bin size:
Gold: 0.10
NAS100: 0.25 or 0.50
🔹 How Traders Use It
Trade rejections at VAH / VAL
Look for acceptance to confirm trend days
Use re-entries to fade failed breakouts
Combine with trend filters, EMA structure, or session context
⚠️ Disclaimer
This indicator is provided for educational and analytical purposes only and does not constitute financial advice. Always manage risk appropriately.

Reversal Detection v3.0 - Real-Time Pro (Non-Repainting)═══════════════════════════════════════════════════════
REVERSAL DETECTION PRO v3.0 - NON-REPAINTING
Adaptive Zigzag Reversal Detection for Scalpers & Day Traders
═══════════════════════════════════════════════════════
CHART EXAMPLE
The indicator is shown running on MNQ1! (Micro E-mini Nasdaq-100
futures) on a 2-minute chart. The indicator works on all symbols
and timeframes, but is optimized for futures scalping on 1-5
minute charts.
WHY I BUILT THIS
Most reversal indicators out there repaint like crazy, flipping
signals after the fact and making you second-guess every trade.
Plus they're too noisy in choppy markets or way too laggy in
trends, so I kept missing entries or getting faked out. I wanted
something solid that sticks to its guns without repainting and
adapts to volatility without me tweaking it every 5 minutes.
This indicator solves those problems by using an adaptive zigzag
algorithm that adjusts to market volatility automatically. Once a
reversal signal appears, it's locked in place - no repainting, no
disappearing signals. The ATR-based sensitivity system means it
works across different market conditions without constant adjustment.
WHAT YOU'LL SEE ON YOUR CHART
When you add this indicator, here's what shows up:
- GREEN LABELS with "REVERSAL" and price level = Bullish reversal
confirmed at swing low
- RED LABELS with "REVERSAL" and price level = Bearish reversal
confirmed at swing high
- HORIZONTAL LINES extending from each reversal = Reference for
stops and targets
- PREVIEW LABELS (lighter colors) = Potential reversals forming in
real-time (optional)
- CANDLE COLORS: Green for bullish trends, red for bearish, purple
for neutral
- PURPLE BOXES = Supply/demand zones marking reversal areas
- INFO TABLE (top corner) = Shows sensitivity, current ATR,
threshold, and trend status
The indicator uses three EMAs (9/14/21 periods) to determine trend
direction, which drives the candle coloring system. This helps you
see whether you're in a bullish, bearish, or choppy market at a
glance.
HOW IT WORKS
The core reversal detection uses a zigzag calculation that tracks
price swings and identifies reversals when price moves by a
dynamically calculated threshold. The reversal amount is determined
by taking the maximum of three values:
1. Percentage-based threshold (adjusts to instrument price level)
2. Absolute price movement threshold (minimum move required)
3. ATR-based threshold (adapts to current volatility)
This multi-factor approach ensures the indicator works consistently
across different assets and market conditions. The non-repainting
mechanism uses confirmed bar data - once a pivot is detected at a
swing high or low, the label and horizontal line are permanently
locked at that exact wick price.
Five sensitivity presets automatically adjust the ATR multiplier:
- Very High (0.8x ATR) = More signals, captures small moves
- High (1.2x ATR) = Active trading
- Medium (2.0x ATR) = Balanced (default)
- Low (2.8x ATR) = Filters noise
- Very Low (3.5x ATR) = Only major reversals
Advanced users can select "Custom" to manually tune ATR multiplier,
percentage threshold, and calculation method.
HOW I USE IT
I mainly trade /MNQ futures on 1-5 minute charts for scalping -
that's my bread and butter. The indicator works decent on other
stuff like stocks or forex too, but I dial sensitivity up for
faster scalps during volatile sessions.
My typical trade setup:
1. Wait for a confirmed REVERSAL label (green for long, red for
short)
2. Check that it lines up with the EMA trend color (bullish candles
for longs, bearish for shorts)
3. If it's a "strong" signal where the reversal hits during a trend
flip, that's my green light
4. Quick check for nearby supply/demand zones to avoid fighting
them
5. Enter with a tight stop below/above the reversal line
6. Target 1:1 or 2:1 risk/reward, usually out in 5-10 minutes
The horizontal lines from each reversal give me logical stop
placement levels, and the supply/demand zones help identify
potential profit targets or areas to avoid.
SETTINGS & CUSTOMIZATION
Signal Modes:
- Confirmed Only = Most reliable, only shows locked-in signals
(recommended)
- Confirmed + Preview = Shows both confirmed and potential signals
- Preview Only = For testing/development
Sensitivity Presets:
Start with "Medium" and adjust based on your trading style:
- Scalping volatile sessions = "High" or "Very High"
- Day trading = "Medium"
- Swing trading = "Low" or "Very Low"
Display Options:
- Choose candle display type (Solid, Trend, Bars, Volume, None)
- Show/hide supply/demand zones
- Adjust zone box extension length
- Customize info table position and size
- Control maximum lines displayed
Alert System:
- Bullish/Bearish reversal alerts
- EMA trend change alerts
- Strong signal alerts (reversal + trend alignment)
- "Any reversal" catch-all alert
IMPORTANT - READ THIS FIRST
Don't rely on this indicator alone. Always pair it with your own
price action or volume confirmation, because no indicator is
perfect. Avoid cranking sensitivity too high in ranging markets or
you'll get whipped. Test on demo first, and remember it's
non-repainting so signals are final, but preview mode can tease
you into early entries if you're not patient.
Risk management is key - don't size up just because a signal looks
good. This indicator helps identify potential reversals, but YOU
still need to manage your trades, set proper stops, and control
position size based on your account risk tolerance.
WHAT MAKES THIS DIFFERENT
Unlike simple pivot indicators or manual support/resistance drawing:
- Adapts automatically to volatility changes (ATR-based)
- Never repaints - signals lock in place permanently
- Reversal detection works with trend context (EMAs)
- Supply/demand zones mark key structural levels
- One-click sensitivity adjustment via presets
- Works across multiple timeframes and instruments
The zigzag reversal algorithm adapts to volatility using ATR, while
the EMA system provides trend context so you're not trading
reversals blindly against the trend. The supply/demand zones help
identify key levels where price has reversed before. It's built
specifically for active traders who need reliable, non-repainting
signals.
BEST PRACTICES
✅ DO:
- Start with "Medium" sensitivity on demo account
- Wait for confirmed signals before entering
- Use horizontal lines for stop placement
- Check trend context (candle colors) before trading reversals
- Combine with volume analysis or price action
- Test different sensitivity settings for your instrument
❌ DON'T:
- Trade every signal blindly without context
- Use "Very High" sensitivity in choppy/ranging markets
- Ignore the trend direction (candle colors)
- Enter on preview labels (they can disappear)
- Skip proper risk management
- Overtrade just because signals appear
TECHNICAL SPECIFICATIONS
- Pine Script Version: v6
- Non-Repainting: Yes (confirmed signals only)
- Uses security(): No (no higher timeframe data)
- Uses non-standard chart types: No (all calculations on real OHLC)
- Alert Compatible: Yes (7 alert types)
- Calculations: Current timeframe only, no lookahead bias
DISCLAIMER
This indicator is for educational purposes only and does not
constitute financial advice. Trading futures, stocks, and forex
involves substantial risk of loss and is not suitable for all
investors. Past performance is not indicative of future results.
Always use proper risk management, never risk more than you can
afford to lose, and test thoroughly on demo accounts before live
trading.
═══════════════════════════════════════════════════════
© 2025 NPR21 - Reversal Detection Pro v3.0
Built by a trader, for traders
═══════════════════════════════════════════════════════

Reversal Detection v3.0 - Real-Time Pro (Non-Repainting)═══════════════════════════════════════════════════════
REVERSAL DETECTION PRO v3.0 - NON-REPAINTING
Adaptive Zigzag Reversal Detection for Scalpers & Day Traders
═══════════════════════════════════════════════════════
WHY I BUILT THIS
Most reversal indicators out there repaint like crazy, flipping signals after the fact and making you second-guess every trade. Plus they're too noisy in choppy markets or way too laggy in trends, so I kept missing entries or getting faked out. I wanted something solid that sticks to its guns without repainting and adapts to volatility without me tweaking it every 5 minutes.
This indicator solves those problems by using an adaptive zigzag algorithm that adjusts to market volatility automatically. Once a reversal signal appears, it's locked in place - no repainting, no disappearing signals. The ATR-based sensitivity system means it works across different market conditions without constant adjustment.
WHAT YOU'LL SEE ON YOUR CHART
When you add this indicator, here's what shows up:
- GREEN LABELS with "REVERSAL" and price level = Bullish reversal confirmed at swing low
- RED LABELS with "REVERSAL" and price level = Bearish reversal confirmed at swing high
- HORIZONTAL LINES extending from each reversal = Reference for stops and targets
- PREVIEW LABELS (lighter colors) = Potential reversals forming in real-time (optional)
- CANDLE COLORS: Green for bullish trends, red for bearish, purple for neutral
- PURPLE BOXES = Supply/demand zones marking reversal areas
- INFO TABLE (top corner) = Shows sensitivity, current ATR, threshold, and trend status
The indicator uses three EMAs (9/14/21 periods) to determine trend direction, which drives the candle coloring system. This helps you see whether you're in a bullish, bearish, or choppy market at a glance.
HOW IT WORKS
The core reversal detection uses a zigzag calculation that tracks price swings and identifies reversals when price moves by a dynamically calculated threshold. The reversal amount is determined by taking the maximum of three values:
1. Percentage-based threshold (adjusts to instrument price level)
2. Absolute price movement threshold (minimum move required)
3. ATR-based threshold (adapts to current volatility)
This multi-factor approach ensures the indicator works consistently across different assets and market conditions. The non-repainting mechanism uses confirmed bar data - once a pivot is detected at a swing high or low, the label and horizontal line are permanently locked at that exact wick price.
Five sensitivity presets automatically adjust the ATR multiplier:
- Very High (0.8x ATR) = More signals, captures small moves
- High (1.2x ATR) = Active trading
- Medium (2.0x ATR) = Balanced (default)
- Low (2.8x ATR) = Filters noise
- Very Low (3.5x ATR) = Only major reversals
Advanced users can select "Custom" to manually tune ATR multiplier, percentage threshold, and calculation method.
HOW I USE IT
I mainly trade /MNQ futures on 1-5 minute charts for scalping - that's my bread and butter. The indicator works decent on other stuff like stocks or forex too, but I dial sensitivity up for faster scalps during volatile sessions.
My typical trade setup:
1. Wait for a confirmed REVERSAL label (green for long, red for short)
2. Check that it lines up with the EMA trend color (bullish candles for longs, bearish for shorts)
3. If it's a "strong" signal where the reversal hits during a trend flip, that's my green light
4. Quick check for nearby supply/demand zones to avoid fighting them
5. Enter with a tight stop below/above the reversal line
6. Target 1:1 or 2:1 risk/reward, usually out in 5-10 minutes
The horizontal lines from each reversal give me logical stop placement levels, and the supply/demand zones help identify potential profit targets or areas to avoid.
SETTINGS & CUSTOMIZATION
Signal Modes:
- Confirmed Only = Most reliable, only shows locked-in signals (recommended)
- Confirmed + Preview = Shows both confirmed and potential signals
- Preview Only = For testing/development
Sensitivity Presets:
Start with "Medium" and adjust based on your trading style:
- Scalping volatile sessions = "High" or "Very High"
- Day trading = "Medium"
- Swing trading = "Low" or "Very Low"
Display Options:
- Choose candle display type (Solid, Trend, Bars, Volume, None)
- Show/hide supply/demand zones
- Adjust zone box extension length
- Customize info table position and size
- Control maximum lines displayed
Alert System:
- Bullish/Bearish reversal alerts
- EMA trend change alerts
- Strong signal alerts (reversal + trend alignment)
- "Any reversal" catch-all alert
IMPORTANT - READ THIS FIRST
Don't rely on this indicator alone. Always pair it with your own price action or volume confirmation, because no indicator is perfect. Avoid cranking sensitivity too high in ranging markets or you'll get whipped. Test on demo first, and remember it's non-repainting so signals are final, but preview mode can tease you into early entries if you're not patient.
Risk management is key - don't size up just because a signal looks good. This indicator helps identify potential reversals, but YOU still need to manage your trades, set proper stops, and control position size based on your account risk tolerance.
WHAT MAKES THIS DIFFERENT
Unlike simple pivot indicators or manual support/resistance drawing:
- Adapts automatically to volatility changes (ATR-based)
- Never repaints - signals lock in place permanently
- Reversal detection works with trend context (EMAs)
- Supply/demand zones mark key structural levels
- One-click sensitivity adjustment via presets
- Works across multiple timeframes and instruments
The zigzag reversal algorithm adapts to volatility using ATR, while the EMA system provides trend context so you're not trading reversals blindly against the trend. The supply/demand zones help identify key levels where price has reversed before. It's built specifically for active traders who need reliable, non-repainting signals.
BEST PRACTICES
✅ DO:
- Start with "Medium" sensitivity on demo account
- Wait for confirmed signals before entering
- Use horizontal lines for stop placement
- Check trend context (candle colors) before trading reversals
- Combine with volume analysis or price action
- Test different sensitivity settings for your instrument
❌ DON'T:
- Trade every signal blindly without context
- Use "Very High" sensitivity in choppy/ranging markets
- Ignore the trend direction (candle colors)
- Enter on preview labels (they can disappear)
- Skip proper risk management
- Overtrade just because signals appear
TECHNICAL SPECIFICATIONS
- Pine Script Version: v6
- Non-Repainting: Yes (confirmed signals only)
- Uses security(): No (no higher timeframe data)
- Uses non-standard chart types: No (all calculations on real OHLC)
- Alert Compatible: Yes (7 alert types)
- Calculations: Current timeframe only, no lookahead bias
DISCLAIMER
This indicator is for educational purposes only and does not constitute financial advice. Trading futures, stocks, and forex involves substantial risk of loss and is not suitable for all investors. Past performance is not indicative of future results. Always use proper risk management, never risk more than you can afford to lose, and test thoroughly on demo accounts before live trading.
═══════════════════════════════════════════════════════
© 2025 NPR21 - Reversal Detection Pro v3.0
Built by a trader, for traders
═══════════════════════════════════════════════════════
