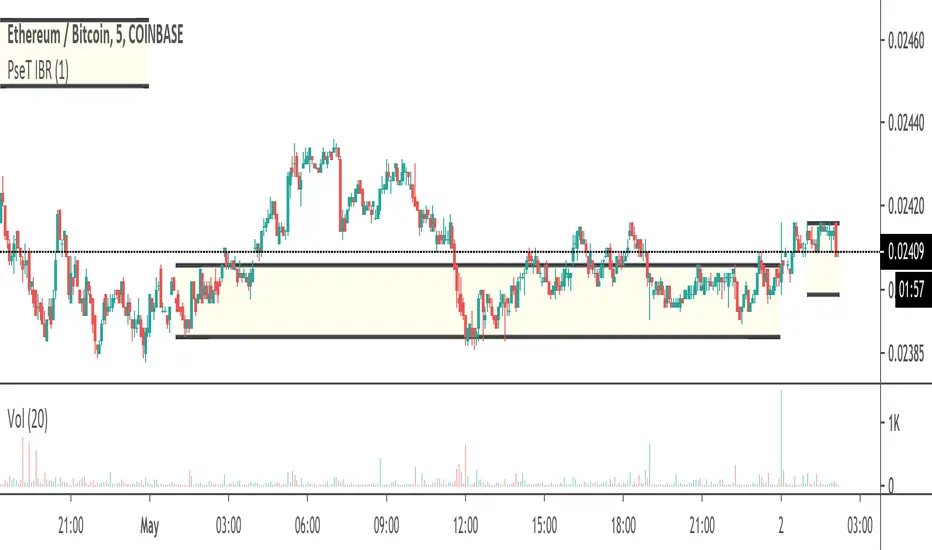
PseT Initial Balance Range (IBR)The Initial Balance is the range high and low printed on the first hour of the session. It's meant for intraday trading and can be used as support/resistance.Pine Script® indicatorby PseT3367
GMS: % True RangeThis just give the range based in % so it can be easily compared to the past. The default setting gives the % range high to low for the current session. This is what I originally wanted as a 1 period ATR gives it in price points and ROC only does current close to previous close. With this you can select OHLC for the two prices you want to use as well as length. I hope it helps! AndrePine Script® indicatorby GlobalMarketSignals28
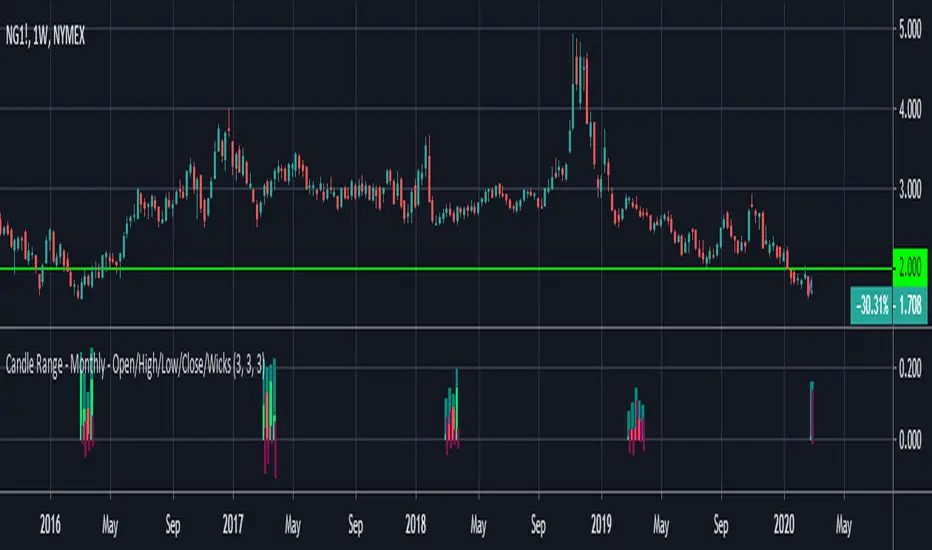
Candle Range - Monthly - Open/High/Low/Close/Wicks (Oldinvestor)This candle range comparison is similar to my original script Candle Range Compare . This script is to compares the size of open/close high/low and wick size side by side. This version of the script allows you to only show a chosen month of each year to compare. I hadn't even thought to try and vanish the part of the chart I'm not looking at. I'll consider that later (may never happen, I am limited on time). I have also included check boxes to turn on/off certain candles. This part is pretty self explanatory. For example: if you wish to not see wicks in front of the open/close, go to the settings for the study and uncheck the box for "Show Wicks". Warning: The script does not work so well on monthly candles? Some of the candles are missing... Good luck Oldinvestor Pine Script® indicatorby oldinvestor22122
Range MovementRange Movement is an indicator I created to help me determine a few things: 1. the mood of the market makers and market participants 2. the price trend What I found after creating the indicator is that it is extremely helpful in finding "EXTREME SENTIMENT" when this line has moved up dramatically and price has too, but then RgMov diverges and signals a weakening support for the stock. When Range Movement surges it reveals extreme optimism and powerful upward movement in price, which can draw in momentum investors and create a blow-off peak in price. So in this instance, RgMov is an overbought, oversold indicator. What I also found is that when a stock is stuck in a range for a long time that RgMov will breakout FIRST to give an early indicator of the future price move to follow. This can be true for rallies or declines. In the example I show $TSLA Tesla shares which broke out in RgMov well ahead of the stock price in October 2019. See example on chart. What is RgMov or Range Movement? Range Movement, aka "RgMov" is derived from open-high-low-close price data. If the market has moved up more than it has moved down during a given bar, the line will move up. Tracking the cumulative movement of the line over time creates the pattern. You can use RgMov in many ways. Here's how I created it to be used for the daily trend in any stock or index: Uptrend = New high over 44 days Downtrend = New low over 44 days As long as the trend is up on the 44-day time frame, I use shorter term (11-days, for example) oversold conditions as entry points to buy and go with the uptrend. If the trend turns down, then I use shorter term (11-days, for example again) overbought readings to go short to trade with the downtrend. Pine Script® indicatorby timwest44120
ADR - Average Day RangeADR - Average Day Range Tradingview Screener Average Day Range (ADR)Pine Script® indicatorby ceyhunUpdated 22580
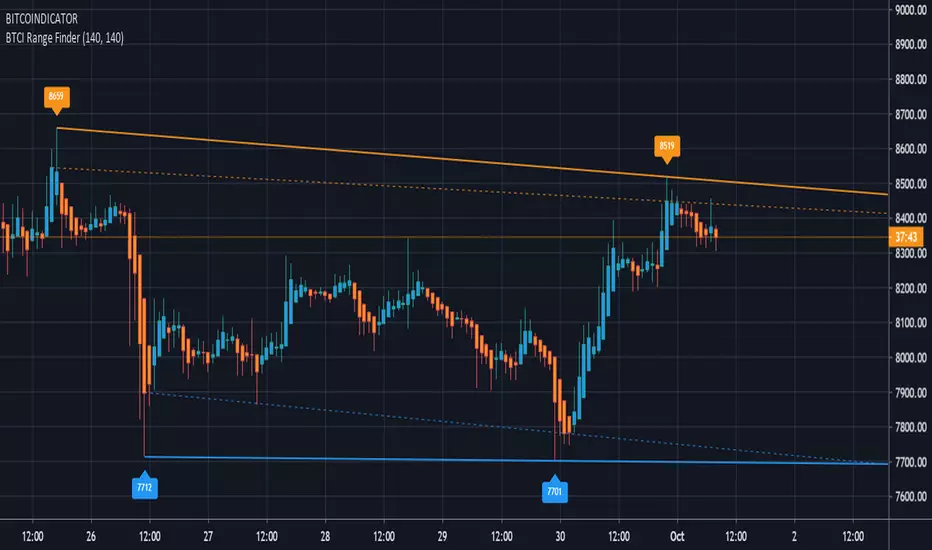
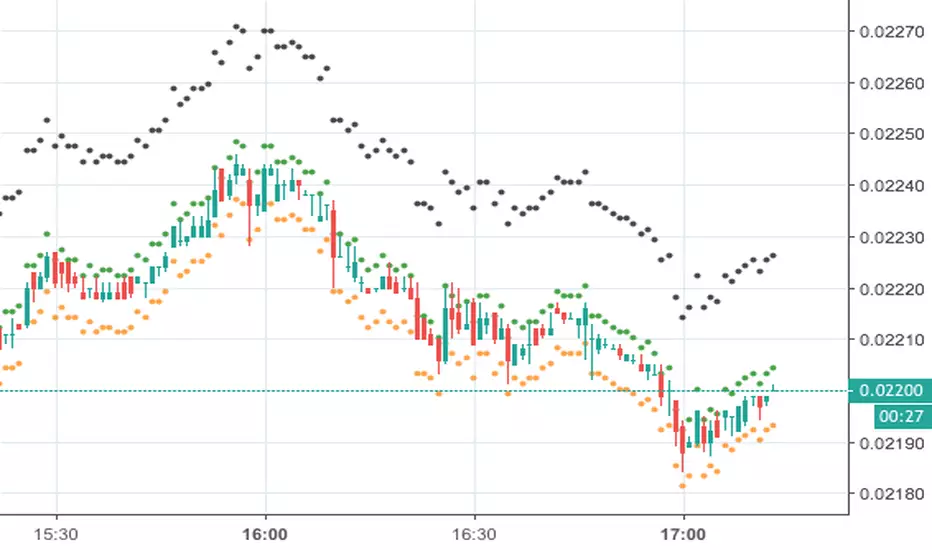
BITCOINDICATOR Range FinderShows the current trading range and market direction, with clear Support and Resistance zones. Eliminates the need to manually draw trend lines and add price labels. How to use: Adjust the "Draw support/resistance from how many bars back" inputs to find an accurate trading range according to your timeframe and trading strategy. Example (chart above): Bars back values are both set to 140. The left resistance label "8659" targets the "high" of the upper half of the bars back input (71-140). The right resistance label "8519" targets the "high" of the lower half of the input (0-70). The supports work the same way but target the "lows". The dotted lines are drawn from the two "highest closes" (resistance) and the two "lowest closes" (support) over the same input range and can be used to create support & resistance zones. Side note: the colored bars come from the BITCOINDICATOR indicator with the labels and symbols removed. This indicator works for ANY chart and all markets. *The Bitcoindicator Range Finder is part of the Bitcoindicator package. For detailed information on Bitcoindicator and how to add it to your charts, please visit: www.bitcoindicator.com Pine Script® indicatorby IndicatorKing1113
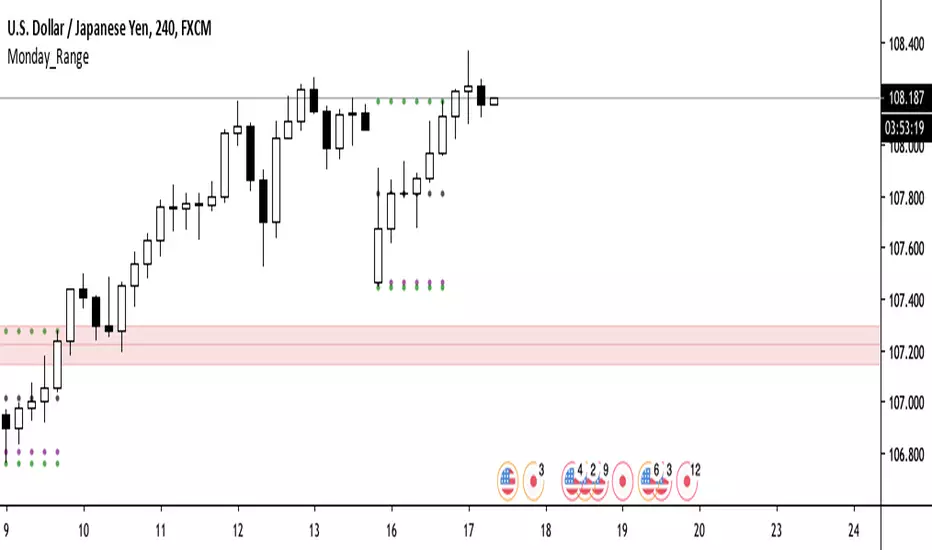
Monday Range - JasonT revisedA revision on the famous Monday Range Script, with the first day of the week goes to Monday for FX trading. Pine Script® indicatorby tcapital55221
Opening Range Breakout - ORBThe opening range is simply the high and low of a given period after the market opens. This period is generally the first 30 minutes or the first hour of trading. During this period, you want to identify the high and low of the day. In addition, you will also want to account for the pre-market highs and lows, as these levels will often act like a magnet on price action after the bell rings. Since the opening bell is associated with big trading volumes and volatility, this time of the session provides many trading opportunities. In this manner, traders use the opening range to set entry points on the chart and to forecast the price action for the day.Pine Script® indicatorby DarkSideTraderUpdated 1111233
Combo Strategy 123 Reversal & Breakout Range Short This is combo strategies for get a cumulative signal. First strategy This System was created from the Book "How I Tripled My Money In The Futures Market" by Ulf Jensen, Page 183. This is reverse type of strategies. The strategy buys at market, if close price is higher than the previous close during 2 days and the meaning of 9-days Stochastic Slow Oscillator is lower than 50. The strategy sells at market, if close price is lower than the previous close price during 2 days and the meaning of 9-days Stochastic Fast Oscillator is higher than 50. Second strategy Breakout Range Short Strategy WARNING: - For purpose educate only - This script to change bars colors.Pine Script® indicatorby HPotter46
Combo Strategy 123 Reversal & Breakout Range Long This is combo strategies for get a cumulative signal. First strategy This System was created from the Book "How I Tripled My Money In The Futures Market" by Ulf Jensen, Page 183. This is reverse type of strategies. The strategy buys at market, if close price is higher than the previous close during 2 days and the meaning of 9-days Stochastic Slow Oscillator is lower than 50. The strategy sells at market, if close price is lower than the previous close price during 2 days and the meaning of 9-days Stochastic Fast Oscillator is higher than 50. Second strategy Breakout Range Long Strategy WARNING: - For purpose educate only - This script to change bars colors.Pine Script® indicatorby HPotter2226
Historical Range PercentageThe historical range of an instrument relative to price.Pine Script® indicatorby JohnKicklighter58
[Long/Short] Range Filter-ADXIt's a useful script for pairs where you can operate long and short. It's a combination algorithm of the Range filter and the ADX. The ADX helps to make the decision to enter to open long or short position. LG --> Long xL --> Close Long position ST --> Short xS --> close Short Position Enjoy!!!Pine Script® indicatorby UnknownUnicorn2151907Updated 2929 1.1 K
Interquartile Range BandsInterquartile Range Bands script. This indicator was originally developed by Alex Orekhov at his home. The idea based on the interquartile range en.wikipedia.org If price breaks out from the bands then it is `outlier` price. After breakouts price always returns to its median. Watch squeeze/expansion periods. Anyway use it as a supplement to the other indicators. I will glad to get your feedback. Pine Script® indicatorby evergetUpdated 11148
Volume Weighted Average Range Bands [DW]This is an experimental study designed to identify the underlying trend bias and volatility of an instrument over any custom interval TradingView supports. First, reset points are established at points where the opening price of the interval changes. Next, Volume Weighted Average Price (VWAP) is calculated. It is the cumulative sum of typical price times volume divided by the cumulative volume. The cumulation starts over upon each reset point. After that, Volume Weighted Average Range (VWAR) is calculated. The formula structure is the same as VWAP, except using range rather than typical price. Lastly, the bands are calculated by multiplying the VWAR by the specified multiplier (approximate Golden Ratio by default) and by 1 through 5, then adding to and subtracting from the VWAP. Custom Bar Colors are included.Pine Script® indicatorby DonovanWall77 1.6 K
Average Daily Range - without open barBasic ADR-indicator that is showing the daily range on lower timeframes as well, without using the current open daily bar for calculation. Also plots as line in a separate indicator window. Updates displayed value when hovering over the candles on the chart to see historical Numbers.Pine Script® indicatorby TVUser3885768200
MTF Previous Open/Close/RangeThis indicator will simply plot on your chart the Daily/Weekly/Monthly previous candle levels. The "Auto" mode will allow automatic adjustment of timeframe displayed according to your chart. Otherwise you can select manually. Indicator plots the open/close and colors the high-low range area in the background. Hope this simple indicator will help you ! You can check my indicators via my TradingView's Profile : @PRO_Indicators Pine Script® indicatorby PRO_IndicatorsUpdated 66 2.1 K
Percent Change of Range CandlesPercent Change of Range Candles.Pine Script® indicatorby RicardoSantos99353
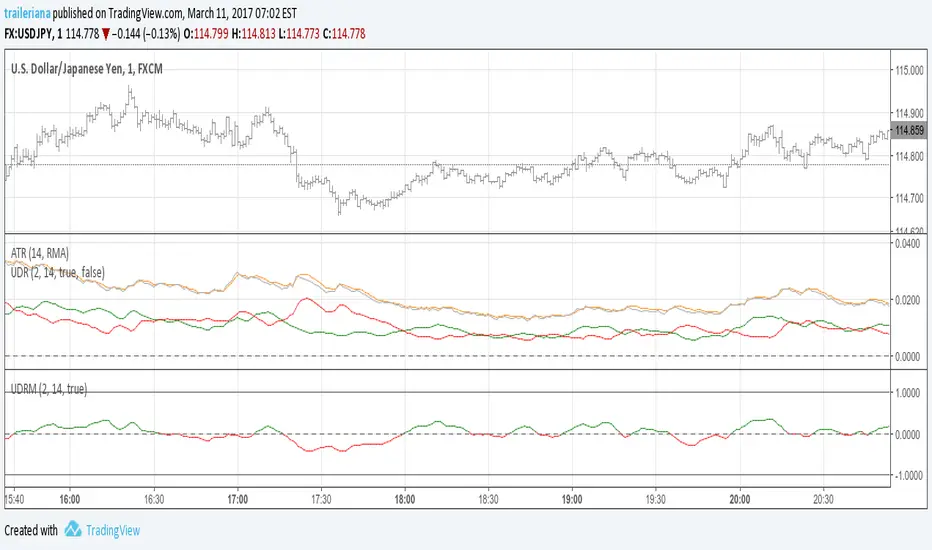
Up/Down Range MomentumThe Up/Down Range breaks the price range into an upward and a downward moving component, so we can easily turn it into a momentum oscillator. This script does just that. You can find the Up/Down Range (UDR) indicator here: Pine Script® indicatorby timtom851192
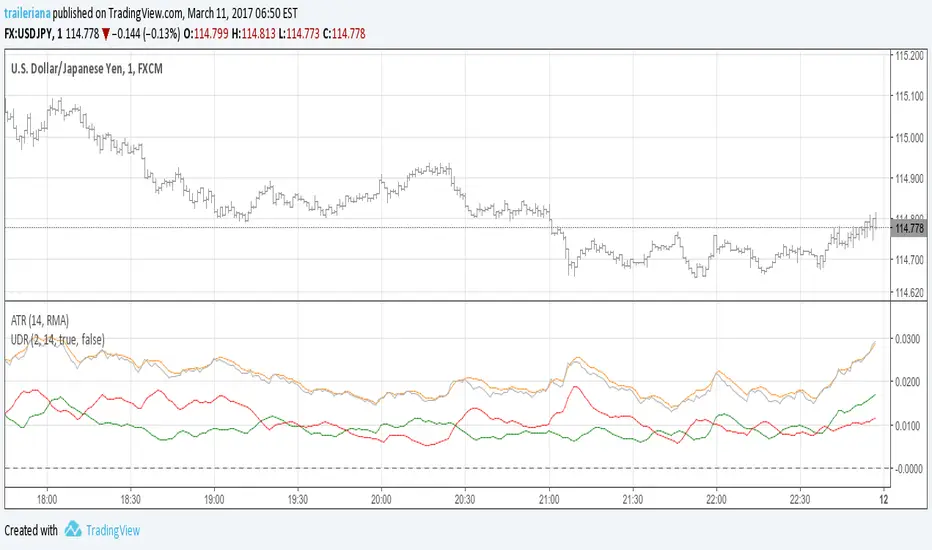
Up/Down RangeMeasuring the difference between the highs and lows from the average, this measure can serve as a proxy for the volatility, just like the ATR. However, it breaks the range into an upward and a downward moving component, so it also gives information about the current trend direction. In fact, I turned it into a momentum indicator here: Pine Script® indicatorby timtom851144
[RS]MTF RSI Weighted Range Envelope V0EXPERIMENTAL: Envelope range weighed by rsi and atr.Pine Script® indicatorby RicardoSantos33300
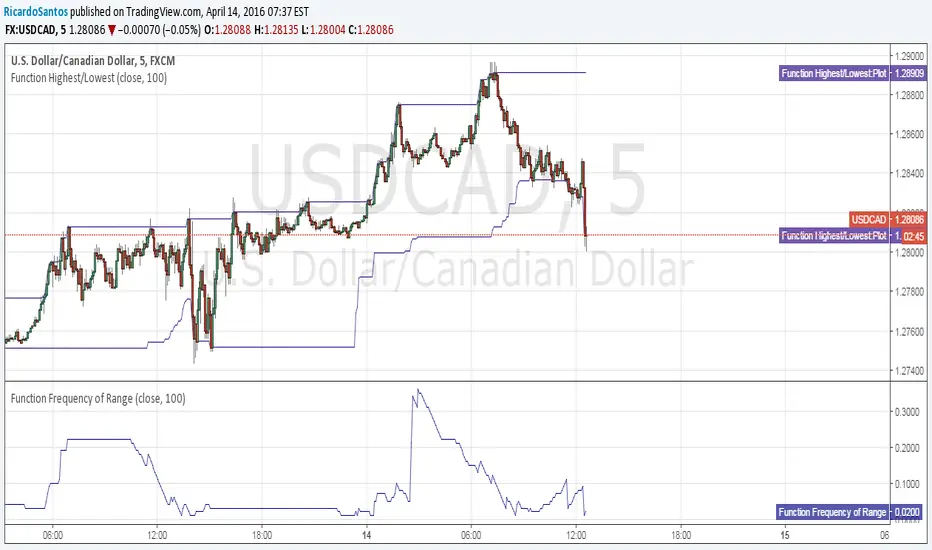
Function Frequency of RangeFunction to derive the frequency a range is visited over time. returns value (0 to 1) percent multiplierPine Script® indicatorby RicardoSantos55176
[RS]Multiple Time Frame Range Swing V0EXPERIMENTAL: (republishing, previous had alot of lines crowding the chart) MTF Range Swing.Pine Script® indicatorby RicardoSantosUpdated 77381