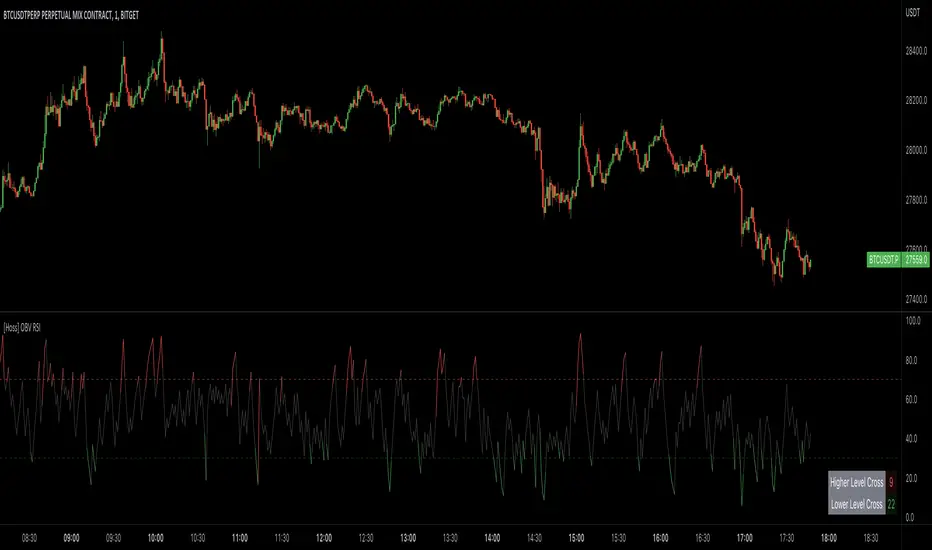
[Hoss] OBV RSIThe OBV ( On Balance Volume ) RSI ( Relative Strength Index ) indicator is an innovative tool that combines the power of OBV and RSI to provide traders with a comprehensive view of the market's momentum and volume dynamics. This combination enables users to make better-informed trading decisions by analyzing the relationship between price, volume , and relative strength .
The script starts by calculating the On Balance Volume , which is a cumulative volume-based indicator that measures buying and selling pressure. The OBV increases when the closing price is higher than the previous closing price and decreases when the closing price is lower than the previous closing price. This helps traders identify potential price trend reversals based on volume accumulation or distribution.
Next, the script computes the Relative Strength Index ( RSI ) based on the OBV values, offering a unique perspective on the market's momentum through the lens of volume . The RSI is a popular momentum indicator that ranges from 0 to 100 and helps traders identify overbought and oversold conditions. In this script, the user can define the RSI length and the higher and lower levels (default values are 70 and 30, respectively).
A distinctive feature of this OBV RSI indicator is the addition of a monitor that counts the number of times the RSI crosses above the higher level and below the lower level within a user-defined lookback period. This monitor is displayed as a table in the bottom right corner of the chart and can be enabled or disabled through an input option.
The cross count monitor provides valuable insights into the historical frequency of RSI crossings, helping traders to identify potential trading opportunities based on historical price behavior around these levels.
Search in scripts for "relative strength"
swami_rsi
Description:
As in the practices, most traders find it hard to set the proper lookback period of the indicator to be used. SwamiCharts offers a comprehensive way to visualize the indicator used over a range of lookback periods. The SwamiCharts of Relative Strength Index (RSI), was developed by Ehlers - see Cycle Analytics for Traders, chapter 16. The indicator was computed over multiple times of the range of lookback period for the Relative Strength Index (RSI), from the deficient period to the relatively high lookback period i.e. 1 to 48, then plotted as one heatmap.
Features:
In this indicator, the improvement is to utilize the color(dot)rgb() function, which finds to giving a relatively lower time to compute, and follows the original color scheme.
The confirmation level, which assumed of 25

[blackcat] L3 RMI Trading StrategyLevel 3
Background
My view of correct usage of RSI and the relationship between RMI and RSI. A proposed RMI indicator with features is introduced
Descriptions
The Relative Strength Index (RSI) is a technical indicator that many people use. Its focus indicates the strength or weakness of a stock. In the traditional usage of this point, when the RSI is above 50, it is strong, otherwise it is weak. Above 80 is overbought, below 20 is oversold. This is what the textbook says. However, if you follow the principles in this textbook and enter the actual trading, you would lose a lot and win a little! What is the reason for this? When the RSI is greater than 50, that is, a stock enters the strong zone. At this time, the emotions of market may just be brewing, and as a result, you run away and watch others win profit. On the contrary, when RSI<20, that is, a stock enters the weak zone, you buy it. At this time, the effect of losing money is spreading. You just took over the chips that were dumped by the whales. Later, you thought that you had bought at the bottom, but found that you were in half mountainside. According to this cycle, there is a high probability that a phenomenon will occur: if you sell, price will rise, and if you buy, price will fall, who have similar experiences should quickly recall whether their RSI is used in this way. Technical indicators are weapons. It can be either a tool of bull or a sharp blade of bear. Don't learn from dogma and give it away. Trading is a game of people. There is an old saying called “people’s hearts are unpredictable”. Do you really think that there is a tool that can detect the true intentions of people’s hearts 100% of the time?
For the above problems, I suggest that improvements can be made in two aspects (in other words, once the strategy is widely spread, it is only a matter of time before it fails. The market is an adaptive and complex system, as long as it can be fully utilized under the conditions that can be used, it is not easy to use. throw or evolve):
1. RSI usage is the opposite. When a stock has undergone a deep adjustment from a high level, and the RSI has fallen from a high of more than 80 to below 50, it has turned from strong to weak, and cannot be bought in the short term. But when the RSI first moved from a low to a high of 80, it just proved that the stock was in a strong zone. There are funds in the activity, put into the stock pool.
Just wait for RSI to intervene in time when it shrinks and pulls back (before it rises when the main force washes the market). It is emphasized here that the use of RSI should be combined with trading volume, rising volume, and falling volume are all healthy performances. A callback that does not break an important moving average is a confirmed buying point or a second step back on an important moving average is a more certain buying point.
2. The RSI is changed to a more stable and adjustable RMI (Relative Momentum Indicator), which is characterized by an additional momentum parameter, which can not only be very close to the RSI performance, but also adjust the momentum parameter m when the market environment changes to ensure more A good fit for a changing market.
The Relative Momentum Index (RMI) was developed by Roger Altman and described its principles in his article in the February 1993 issue of the journal Technical Analysis of Stocks and Commodities. He developed RMI based on the RSI principle. For example, RSI is calculated from the close to yesterday's close in a period of time compared to the ups and downs, while the RMI is compared from the close to the close of m days ago. Therefore, in principle, when m=1, RSI should be equal to RMI. But it is precisely because of the addition of this m parameter that the RMI result may be smoother than the RSI.
Not much more to say, the below picture: when m=1, RMI and RSI overlap, and the result is the same.
The Shanghai 50 Index is from TradingView (m=1)
The Shanghai 50 Index is from TradingView (m=3)
The Shanghai 50 Index is from TradingView (m=5)
For this indicator function, I also make a brief introduction:
1. 50 is the strength line (white), do not operate offline, pay attention online. 80 is the warning line (yellow), indicating that the stock has entered a strong area; 90 is the lightening line (orange), once it is greater than 90 and a sell K-line pattern appears, the position will be lightened; the 95 clearing line (red) means that selling is at a climax. This is seen from the daily and weekly cycles, and small cycles may not be suitable.
2. The purple band indicates that the momentum is sufficient to hold a position, and the green band indicates that the momentum is insufficient and the position is short.
3. Divide the RMI into 7, 14, and 21 cycles. When the golden fork appears in the two resonances, a golden fork will appear to prompt you to buy, and when the two periods of resonance have a dead fork, a purple fork will appear to prompt you to sell.
4. Add top-bottom divergence judgment algorithm. Top_Div red label indicates top divergence; Bot_Div green label indicates bottom divergence. These signals are only for auxiliary judgment and are not 100% accurate.
5. This indicator needs to be combined with VOL energy, K-line shape and moving average for comprehensive judgment. It is still in its infancy, and open source is published in the TradingView community. A more complete advanced version is also considered for subsequent release (because the K-line pattern recognition algorithm is still being perfected).
Remarks
Feedbacks are appreciated.

Relative Index StrengthThis script shows relative strength of custom stock compared to Index. It is helpful in detecting how strongly a stock is performing when compared to an Index.
When the index is falling but the custom stock is rising, indicator shows this in red with its relative strength compared to index, indicating the stock is moving strongly against market trend.
When the index and the custom stock are moving in same direction, indicator remains neutral, indicating the stock is aligned with the market trend.
RSI/RSX QQE Histogram w/ Discontinued Signal Line [Loxx]QQE Histogram w/ Discontinued Signal Line is a run-of-the-mill Qualitative Quantitative Estimation (QQE) calculation but with a signal line to better filter and identify trends. The thicker white line is the QSL and appears as a simple EMA. The two thin white lines are the fast and slow trends. The histogram changes color based on the DSL levels. This version of QQE also includes two different versions of RSI: Wilders and Jurik's RSX.
What is Qualitative Quantitative Estimation (QQE)?
The Qualitative Quantitative Estimation (QQE) indicator works like a smoother version of the popular Relative Strength Index ( RSI ) indicator. QQE expands on RSI by adding two volatility based trailing stop lines. These trailing stop lines are composed of a fast and a slow moving Average True Range (ATR).
What is Wilders' RSI?
The Relative Strength Index (RSI) is a well versed momentum based oscillator which is used to measure the speed (velocity) as well as the change (magnitude) of directional price movements. Essentially RSI , when graphed, provides a visual mean to monitor both the current, as well as historical, strength and weakness of a particular market. The strength or weakness is based on closing prices over the duration of a specified trading period creating a reliable metric of price and momentum changes. Given the popularity of cash settled instruments (stock indexes) and leveraged financial products (the entire field of derivatives); RSI has proven to be a viable indicator of price movements.
What is RSX?
RSI is a very popular technical indicator, because it takes into consideration market speed, direction and trend uniformity. However, the its widely criticized drawback is its noisy (jittery) appearance. The Jurk RSX retains all the useful features of RSI , but with one important exception: the noise is gone with no added lag.
There are many indicators for many purposes. Some of them are complex and some are comparatively easy to handle. The QQE indicator is a really useful analytical tool and one of the most accurate indicators. It offers numerous strategies for using the buy and sell signals. Essentially, it can help detect trend reversal and enter the trade at the most optimal positions.
Included:
-Toggle on/off bar coloring

Adaptivity: Measures of Dominant Cycles and Price Trend [Loxx]Adaptivity: Measures of Dominant Cycles and Price Trend is an indicator that outputs adaptive lengths using various methods for dominant cycle and price trend timeframe adaptivity. While the information output from this indicator might be useful for the average trader in one off circumstances, this indicator is really meant for those need a quick comparison of dynamic length outputs who wish to fine turn algorithms and/or create adaptive indicators.
This indicator compares adaptive output lengths of all publicly known adaptive measures. Additional adaptive measures will be added as they are discovered and made public.
The first released of this indicator includes 6 measures. An additional three measures will be added with updates. Please check back regularly for new measures.
Ehers:
Autocorrelation Periodogram
Band-pass
Instantaneous Cycle
Hilbert Transformer
Dual Differentiator
Phase Accumulation (future release)
Homodyne (future release)
Jurik:
Composite Fractal Behavior (CFB)
Adam White:
Veritical Horizontal Filter (VHF) (future release)
What is an adaptive cycle, and what is Ehlers Autocorrelation Periodogram Algorithm?
From his Ehlers' book Cycle Analytics for Traders Advanced Technical Trading Concepts by John F. Ehlers , 2013, page 135:
"Adaptive filters can have several different meanings. For example, Perry Kaufman's adaptive moving average (KAMA) and Tushar Chande's variable index dynamic average (VIDYA) adapt to changes in volatility . By definition, these filters are reactive to price changes, and therefore they close the barn door after the horse is gone.The adaptive filters discussed in this chapter are the familiar Stochastic , relative strength index (RSI), commodity channel index (CCI), and band-pass filter.The key parameter in each case is the look-back period used to calculate the indicator. This look-back period is commonly a fixed value. However, since the measured cycle period is changing, it makes sense to adapt these indicators to the measured cycle period. When tradable market cycles are observed, they tend to persist for a short while.Therefore, by tuning the indicators to the measure cycle period they are optimized for current conditions and can even have predictive characteristics.
The dominant cycle period is measured using the Autocorrelation Periodogram Algorithm. That dominant cycle dynamically sets the look-back period for the indicators. I employ my own streamlined computation for the indicators that provide smoother and easier to interpret outputs than traditional methods. Further, the indicator codes have been modified to remove the effects of spectral dilation.This basically creates a whole new set of indicators for your trading arsenal."
What is this Hilbert Transformer?
An analytic signal allows for time-variable parameters and is a generalization of the phasor concept, which is restricted to time-invariant amplitude, phase, and frequency. The analytic representation of a real-valued function or signal facilitates many mathematical manipulations of the signal. For example, computing the phase of a signal or the power in the wave is much simpler using analytic signals.
The Hilbert transformer is the technique to create an analytic signal from a real one. The conventional Hilbert transformer is theoretically an infinite-length FIR filter. Even when the filter length is truncated to a useful but finite length, the induced lag is far too large to make the transformer useful for trading.
From his Ehlers' book Cycle Analytics for Traders Advanced Technical Trading Concepts by John F. Ehlers , 2013, pages 186-187:
"I want to emphasize that the only reason for including this section is for completeness. Unless you are interested in research, I suggest you skip this section entirely. To further emphasize my point, do not use the code for trading. A vastly superior approach to compute the dominant cycle in the price data is the autocorrelation periodogram. The code is included because the reader may be able to capitalize on the algorithms in a way that I do not see. All the algorithms encapsulated in the code operate reasonably well on theoretical waveforms that have no noise component. My conjecture at this time is that the sample-to-sample noise simply swamps the computation of the rate change of phase, and therefore the resulting calculations to find the dominant cycle are basically worthless.The imaginary component of the Hilbert transformer cannot be smoothed as was done in the Hilbert transformer indicator because the smoothing destroys the orthogonality of the imaginary component."
What is the Dual Differentiator, a subset of Hilbert Transformer?
From his Ehlers' book Cycle Analytics for Traders Advanced Technical Trading Concepts by John F. Ehlers , 2013, page 187:
"The first algorithm to compute the dominant cycle is called the dual differentiator. In this case, the phase angle is computed from the analytic signal as the arctangent of the ratio of the imaginary component to the real component. Further, the angular frequency is defined as the rate change of phase. We can use these facts to derive the cycle period."
What is the Phase Accumulation, a subset of Hilbert Transformer?
From his Ehlers' book Cycle Analytics for Traders Advanced Technical Trading Concepts by John F. Ehlers , 2013, page 189:
"The next algorithm to compute the dominant cycle is the phase accumulation method. The phase accumulation method of computing the dominant cycle is perhaps the easiest to comprehend. In this technique, we measure the phase at each sample by taking the arctangent of the ratio of the quadrature component to the in-phase component. A delta phase is generated by taking the difference of the phase between successive samples. At each sample we can then look backwards, adding up the delta phases.When the sum of the delta phases reaches 360 degrees, we must have passed through one full cycle, on average.The process is repeated for each new sample.
The phase accumulation method of cycle measurement always uses one full cycle's worth of historical data.This is both an advantage and a disadvantage.The advantage is the lag in obtaining the answer scales directly with the cycle period.That is, the measurement of a short cycle period has less lag than the measurement of a longer cycle period. However, the number of samples used in making the measurement means the averaging period is variable with cycle period. longer averaging reduces the noise level compared to the signal.Therefore, shorter cycle periods necessarily have a higher out- put signal-to-noise ratio."
What is the Homodyne, a subset of Hilbert Transformer?
From his Ehlers' book Cycle Analytics for Traders Advanced Technical Trading Concepts by John F. Ehlers , 2013, page 192:
"The third algorithm for computing the dominant cycle is the homodyne approach. Homodyne means the signal is multiplied by itself. More precisely, we want to multiply the signal of the current bar with the complex value of the signal one bar ago. The complex conjugate is, by definition, a complex number whose sign of the imaginary component has been reversed."
What is the Instantaneous Cycle?
The Instantaneous Cycle Period Measurement was authored by John Ehlers; it is built upon his Hilbert Transform Indicator.
From his Ehlers' book Cybernetic Analysis for Stocks and Futures: Cutting-Edge DSP Technology to Improve Your Trading by John F. Ehlers, 2004, page 107:
"It is obvious that cycles exist in the market. They can be found on any chart by the most casual observer. What is not so clear is how to identify those cycles in real time and how to take advantage of their existence. When Welles Wilder first introduced the relative strength index (rsi), I was curious as to why he selected 14 bars as the basis of his calculations. I reasoned that if i knew the correct market conditions, then i could make indicators such as the rsi adaptive to those conditions. Cycles were the answer. I knew cycles could be measured. Once i had the cyclic measurement, a host of automatically adaptive indicators could follow.
Measurement of market cycles is not easy. The signal-to-noise ratio is often very low, making measurement difficult even using a good measurement technique. Additionally, the measurements theoretically involve simultaneously solving a triple infinity of parameter values. The parameters required for the general solutions were frequency, amplitude, and phase. Some standard engineering tools, like fast fourier transforms (ffs), are simply not appropriate for measuring market cycles because ffts cannot simultaneously meet the stationarity constraints and produce results with reasonable resolution. Therefore i introduced maximum entropy spectral analysis (mesa) for the measurement of market cycles. This approach, originally developed to interpret seismographic information for oil exploration, produces high-resolution outputs with an exceptionally short amount of information. A short data length improves the probability of having nearly stationary data. Stationary data means that frequency and amplitude are constant over the length of the data. I noticed over the years that the cycles were ephemeral. Their periods would be continuously increasing and decreasing. Their amplitudes also were changing, giving variable signal-to-noise ratio conditions. Although all this is going on with the cyclic components, the enduring characteristic is that generally only one tradable cycle at a time is present for the data set being used. I prefer the term dominant cycle to denote that one component. The assumption that there is only one cycle in the data collapses the difficulty of the measurement process dramatically."
What is the Band-pass Cycle?
From his Ehlers' book Cycle Analytics for Traders Advanced Technical Trading Concepts by John F. Ehlers , 2013, page 47:
"Perhaps the least appreciated and most underutilized filter in technical analysis is the band-pass filter. The band-pass filter simultaneously diminishes the amplitude at low frequencies, qualifying it as a detrender, and diminishes the amplitude at high frequencies, qualifying it as a data smoother. It passes only those frequency components from input to output in which the trader is interested. The filtering produced by a band-pass filter is superior because the rejection in the stop bands is related to its bandwidth. The degree of rejection of undesired frequency components is called selectivity. The band-stop filter is the dual of the band-pass filter. It rejects a band of frequency components as a notch at the output and passes all other frequency components virtually unattenuated. Since the bandwidth of the deep rejection in the notch is relatively narrow and since the spectrum of market cycles is relatively broad due to systemic noise, the band-stop filter has little application in trading."
From his Ehlers' book Cycle Analytics for Traders Advanced Technical Trading Concepts by John F. Ehlers , 2013, page 59:
"The band-pass filter can be used as a relatively simple measurement of the dominant cycle. A cycle is complete when the waveform crosses zero two times from the last zero crossing. Therefore, each successive zero crossing of the indicator marks a half cycle period. We can establish the dominant cycle period as twice the spacing between successive zero crossings."
What is Composite Fractal Behavior (CFB)?
All around you mechanisms adjust themselves to their environment. From simple thermostats that react to air temperature to computer chips in modern cars that respond to changes in engine temperature, r.p.m.'s, torque, and throttle position. It was only a matter of time before fast desktop computers applied the mathematics of self-adjustment to systems that trade the financial markets.
Unlike basic systems with fixed formulas, an adaptive system adjusts its own equations. For example, start with a basic channel breakout system that uses the highest closing price of the last N bars as a threshold for detecting breakouts on the up side. An adaptive and improved version of this system would adjust N according to market conditions, such as momentum, price volatility or acceleration.
Since many systems are based directly or indirectly on cycles, another useful measure of market condition is the periodic length of a price chart's dominant cycle, (DC), that cycle with the greatest influence on price action.
The utility of this new DC measure was noted by author Murray Ruggiero in the January '96 issue of Futures Magazine. In it. Mr. Ruggiero used it to adaptive adjust the value of N in a channel breakout system. He then simulated trading 15 years of D-Mark futures in order to compare its performance to a similar system that had a fixed optimal value of N. The adaptive version produced 20% more profit!
This DC index utilized the popular MESA algorithm (a formulation by John Ehlers adapted from Burg's maximum entropy algorithm, MEM). Unfortunately, the DC approach is problematic when the market has no real dominant cycle momentum, because the mathematics will produce a value whether or not one actually exists! Therefore, we developed a proprietary indicator that does not presuppose the presence of market cycles. It's called CFB (Composite Fractal Behavior) and it works well whether or not the market is cyclic.
CFB examines price action for a particular fractal pattern, categorizes them by size, and then outputs a composite fractal size index. This index is smooth, timely and accurate
Essentially, CFB reveals the length of the market's trending action time frame. Long trending activity produces a large CFB index and short choppy action produces a small index value. Investors have found many applications for CFB which involve scaling other existing technical indicators adaptively, on a bar-to-bar basis.
What is VHF Adaptive Cycle?
Vertical Horizontal Filter (VHF) was created by Adam White to identify trending and ranging markets. VHF measures the level of trend activity, similar to ADX DI. Vertical Horizontal Filter does not, itself, generate trading signals, but determines whether signals are taken from trend or momentum indicators. Using this trend information, one is then able to derive an average cycle length.

Jurik CFB Adaptive QQE [Loxx]Jurik CFB Adaptive QQE is a Double Jurik-Filtered, Composite Fractal Behavior (CFB) adaptive, Qualitative Quantitative Estimation indicator. This indicator includes both fixed and the CFB adaptive calculations as well as three different types of RSI calculations including Jurik's RSX.
What is Qualitative Quantitative Estimation (QQE)?
The Qualitative Quantitative Estimation (QQE) indicator works like a smoother version of the popular Relative Strength Index ( RSI ) indicator. QQE expands on RSI by adding two volatility based trailing stop lines. These trailing stop lines are composed of a fast and a slow moving Average True Range (ATR).
There are many indicators for many purposes. Some of them are complex and some are comparatively easy to handle. The QQE indicator is a really useful analytical tool and one of the most accurate indicators. It offers numerous strategies for using the buy and sell signals. Essentially, it can help detect trend reversal and enter the trade at the most optimal positions.
What is Wilders' RSI?
The Relative Strength Index ( RSI ) is a well versed momentum based oscillator which is used to measure the speed (velocity) as well as the change (magnitude) of directional price movements. Essentially RSI , when graphed, provides a visual mean to monitor both the current, as well as historical, strength and weakness of a particular market. The strength or weakness is based on closing prices over the duration of a specified trading period creating a reliable metric of price and momentum changes. Given the popularity of cash settled instruments (stock indexes) and leveraged financial products (the entire field of derivatives); RSI has proven to be a viable indicator of price movements.
What is RSX RSI?
RSI is a very popular technical indicator, because it takes into consideration market speed, direction and trend uniformity. However, the its widely criticized drawback is its noisy (jittery) appearance. The Jurk RSX retains all the useful features of RSI , but with one important exception: the noise is gone with no added lag.
What is Rapid RSI?
Rapid RSI Indicator, from Ian Copsey's article in the October 2006 issue of Stocks & Commodities magazine.
RapidRSI resembles Wilder's RSI , but uses a SMA instead of a WilderMA for internal smoothing of price change accumulators.
What is Composite Fractal Behavior (CFB)?
All around you mechanisms adjust themselves to their environment. From simple thermostats that react to air temperature to computer chips in modern cars that respond to changes in engine temperature, r.p.m.'s, torque, and throttle position. It was only a matter of time before fast desktop computers applied the mathematics of self-adjustment to systems that trade the financial markets.
Unlike basic systems with fixed formulas, an adaptive system adjusts its own equations. For example, start with a basic channel breakout system that uses the highest closing price of the last N bars as a threshold for detecting breakouts on the up side. An adaptive and improved version of this system would adjust N according to market conditions, such as momentum, price volatility or acceleration.
Since many systems are based directly or indirectly on cycles, another useful measure of market condition is the periodic length of a price chart's dominant cycle, (DC), that cycle with the greatest influence on price action.
The utility of this new DC measure was noted by author Murray Ruggiero in the January '96 issue of Futures Magazine. In it. Mr. Ruggiero used it to adaptive adjust the value of N in a channel breakout system. He then simulated trading 15 years of D-Mark futures in order to compare its performance to a similar system that had a fixed optimal value of N. The adaptive version produced 20% more profit!
This DC index utilized the popular MESA algorithm (a formulation by John Ehlers adapted from Burg's maximum entropy algorithm, MEM). Unfortunately, the DC approach is problematic when the market has no real dominant cycle momentum, because the mathematics will produce a value whether or not one actually exists! Therefore, we developed a proprietary indicator that does not presuppose the presence of market cycles. It's called CFB (Composite Fractal Behavior) and it works well whether or not the market is cyclic.
CFB examines price action for a particular fractal pattern, categorizes them by size, and then outputs a composite fractal size index. This index is smooth, timely and accurate
Essentially, CFB reveals the length of the market's trending action time frame. Long trending activity produces a large CFB index and short choppy action produces a small index value. Investors have found many applications for CFB which involve scaling other existing technical indicators adaptively, on a bar-to-bar basis.
What is Jurik Volty used in the Juirk Filter?
One of the lesser known qualities of Juirk smoothing is that the Jurik smoothing process is adaptive. "Jurik Volty" (a sort of market volatility ) is what makes Jurik smoothing adaptive. The Jurik Volty calculation can be used as both a standalone indicator and to smooth other indicators that you wish to make adaptive.
What is the Jurik Moving Average?
Have you noticed how moving averages add some lag (delay) to your signals? ... especially when price gaps up or down in a big move, and you are waiting for your moving average to catch up? Wait no more! JMA eliminates this problem forever and gives you the best of both worlds: low lag and smooth lines.
Ideally, you would like a filtered signal to be both smooth and lag-free. Lag causes delays in your trades, and increasing lag in your indicators typically result in lower profits. In other words, late comers get what's left on the table after the feast has already begun.
Included
-Toggle bar color on/off

Adaptive, Jurik-Filtered, Floating RSI [Loxx]Adaptive, Jurik-Filtered, Floating RSI is an adaptive RSI indicator that smooths the RSI signal with a Jurik Filter.
This indicator contains three different types of RSI. They are following.
Wilders' RSI:
The Relative Strength Index ( RSI ) is a well versed momentum based oscillator which is used to measure the speed (velocity) as well as the change (magnitude) of directional price movements. Essentially RSI , when graphed, provides a visual mean to monitor both the current, as well as historical, strength and weakness of a particular market. The strength or weakness is based on closing prices over the duration of a specified trading period creating a reliable metric of price and momentum changes. Given the popularity of cash settled instruments (stock indexes) and leveraged financial products (the entire field of derivatives); RSI has proven to be a viable indicator of price movements.
RSX RSI:
RSI is a very popular technical indicator, because it takes into consideration market speed, direction and trend uniformity. However, the its widely criticized drawback is its noisy (jittery) appearance. The Jurk RSX retains all the useful features of RSI , but with one important exception: the noise is gone with no added lag.
Rapid RSI:
Rapid RSI Indicator, from Ian Copsey's article in the October 2006 issue of Stocks & Commodities magazine.
RapidRSI resembles Wilder's RSI , but uses a SMA instead of a WilderMA for internal smoothing of price change accumulators.
This indicator also uses adaptive cycles to calculate input lengths
What is an adaptive cycle, and what is Ehlers Autocorrelation Periodogram Algorithm?
From his Ehlers' book Cycle Analytics for Traders Advanced Technical Trading Concepts by John F. Ehlers , 2013, page 135:
"Adaptive filters can have several different meanings. For example, Perry Kaufman’s adaptive moving average ( KAMA ) and Tushar Chande’s variable index dynamic average ( VIDYA ) adapt to changes in volatility . By definition, these filters are reactive to price changes, and therefore they close the barn door after the horse is gone.The adaptive filters discussed in this chapter are the familiar Stochastic , relative strength index ( RSI ), commodity channel index ( CCI ), and band-pass filter.The key parameter in each case is the look-back period used to calculate the indicator. This look-back period is commonly a fixed value. However, since the measured cycle period is changing, it makes sense to adapt these indicators to the measured cycle period. When tradable market cycles are observed, they tend to persist for a short while.Therefore, by tuning the indicators to the measure cycle period they are optimized for current conditions and can even have predictive characteristics.
The dominant cycle period is measured using the Autocorrelation Periodogram Algorithm. That dominant cycle dynamically sets the look-back period for the indicators. I employ my own streamlined computation for the indicators that provide smoother and easier to interpret outputs than traditional methods. Further, the indicator codes have been modified to remove the effects of spectral dilation.This basically creates a whole new set of indicators for your trading arsenal."
Lastly, RSI is filtered and smoothed using a Jurik Filter
What is Jurik Volty?
One of the lesser known qualities of Juirk smoothing is that the Jurik smoothing process is adaptive. "Jurik Volty" (a sort of market volatility ) is what makes Jurik smoothing adaptive. The Jurik Volty calculation can be used as both a standalone indicator and to smooth other indicators that you wish to make adaptive.
What is the Jurik Moving Average?
Have you noticed how moving averages add some lag (delay) to your signals? ... especially when price gaps up or down in a big move, and you are waiting for your moving average to catch up? Wait no more! JMA eliminates this problem forever and gives you the best of both worlds: low lag and smooth lines.
Ideally, you would like a filtered signal to be both smooth and lag-free. Lag causes delays in your trades, and increasing lag in your indicators typically result in lower profits. In other words, late comers get what's left on the table after the feast has already begun.
Usage
-Red fill color when RSI is in overbought zone means a possible bear trend is incoming
-Green fill color when RSI is in overbought zone means a possible bear trend is incoming
Included
-Bar coloring
Adaptive Qualitative Quantitative Estimation (QQE) [Loxx]Adaptive QQE is a fixed and cycle adaptive version of the popular Qualitative Quantitative Estimation (QQE) used by forex traders. This indicator includes varoius types of RSI caculations and adaptive cycle measurements to find tune your signal.
Qualitative Quantitative Estimation (QQE):
The Qualitative Quantitative Estimation (QQE) indicator works like a smoother version of the popular Relative Strength Index (RSI) indicator. QQE expands on RSI by adding two volatility based trailing stop lines. These trailing stop lines are composed of a fast and a slow moving Average True Range (ATR).
There are many indicators for many purposes. Some of them are complex and some are comparatively easy to handle. The QQE indicator is a really useful analytical tool and one of the most accurate indicators. It offers numerous strategies for using the buy and sell signals. Essentially, it can help detect trend reversal and enter the trade at the most optimal positions.
Wilders' RSI:
The Relative Strength Index ( RSI ) is a well versed momentum based oscillator which is used to measure the speed (velocity) as well as the change (magnitude) of directional price movements. Essentially RSI , when graphed, provides a visual mean to monitor both the current, as well as historical, strength and weakness of a particular market. The strength or weakness is based on closing prices over the duration of a specified trading period creating a reliable metric of price and momentum changes. Given the popularity of cash settled instruments (stock indexes) and leveraged financial products (the entire field of derivatives); RSI has proven to be a viable indicator of price movements.
RSX RSI:
RSI is a very popular technical indicator, because it takes into consideration market speed, direction and trend uniformity. However, the its widely criticized drawback is its noisy (jittery) appearance. The Jurk RSX retains all the useful features of RSI , but with one important exception: the noise is gone with no added lag.
Rapid RSI:
Rapid RSI Indicator, from Ian Copsey's article in the October 2006 issue of Stocks & Commodities magazine.
RapidRSI resembles Wilder's RSI , but uses a SMA instead of a WilderMA for internal smoothing of price change accumulators.
VHF Adaptive Cycle:
Vertical Horizontal Filter (VHF) was created by Adam White to identify trending and ranging markets. VHF measures the level of trend activity, similar to ADX DI. Vertical Horizontal Filter does not, itself, generate trading signals, but determines whether signals are taken from trend or momentum indicators. Using this trend information, one is then able to derive an average cycle length.
Band-pass Adaptive Cycle:
Even the most casual chart reader will be able to spot times when the market is cycling and other times when longer-term trends are in play. Cycling markets are ideal for swing trading however attempting to “trade the swing” in a trending market can be a recipe for disaster. Similarly, applying trend trading techniques during a cycling market can equally wreak havoc in your account. Cycle or trend modes can readily be identified in hindsight. But it would be useful to have an objective scientific approach to guide you as to the current market mode.
There are a number of tools already available to differentiate between cycle and trend modes. For example, measuring the trend slope over the cycle period to the amplitude of the cyclic swing is one possibility.
We begin by thinking of cycle mode in terms of frequency or its inverse, periodicity. Since the markets are fractal ; daily, weekly, and intraday charts are pretty much indistinguishable when time scales are removed. Thus it is useful to think of the cycle period in terms of its bar count. For example, a 20 bar cycle using daily data corresponds to a cycle period of approximately one month.
When viewed as a waveform, slow-varying price trends constitute the waveform's low frequency components and day-to-day fluctuations (noise) constitute the high frequency components. The objective in cycle mode is to filter out the unwanted components--both low frequency trends and the high frequency noise--and retain only the range of frequencies over the desired swing period. A filter for doing this is called a bandpass filter and the range of frequencies passed is the filter's bandwidth.
Included:
-Toggle on/off bar coloring
-Customize RSI signal using fixed, VHF Adaptive, and Band-pass Adaptive calculations
-Choose from three different RSI types
Visuals:
-Red/Green line is the moving average of RSI
-Thin white line is the fast trend
-Dotted yellow line is the slow trend
Happy trading!

KINSKI Multi Trend OscillatorThe Multi Trend Oscillator is a tool that combines the ratings of several indicators to facilitate the search for profitable trades. I was inspired by the excellent indicator "Technical Ratings" from Team TradingView to create an alternative with a technically new approach. Therefore, it is not a modified copy of the original, but newly conceived and implemented.
The recommendations of the indicator are based on the calculated ratings from the different indicators included in it. The special thing here is that all settings for the individual indicators can be changed according to your own needs and displayed as a histogram and MA line. This provides an excellent visual control of your own settings. Alarms are also triggered.
Criteria for determining the rating
Relative Strength Index (RSI)
Buy - Crossover oversold level and indicator < oversold level and rising
Sell - Crossunder oversold level and indicator >= oversold level and falling
Neutral - neither Buy nor Sell
Relative Strength Index (RSI) Laguerre
Buy - Crossover Oversold Level and Indicator < Oversold Level and rising
Sell - Crossunder oversold level and indicator >= oversold level and falling
Neutral - neither Buy nor Sell
Noise free Relative Strength Index (RSX)
Buy - Crossover Oversold Level and Indicator < Oversold Level and rising
Sell - Crossunder oversold level and indicator >= oversold level and falling
Neutral - neither Buy nor Sell
Money Flow Index (MFI)
Buy - Crossover Oversold Level and Indicator < Oversold Level and rising
Sell - Crossunder oversold level and indicator >= oversold level and falling
Neutral - neither Buy nor Sell
Commodity Channel Index (CCI)
Buy - Crossover Oversold Level and Indicator < Oversold Level and rising
Sell - Crossunder oversold level and indicator >= oversold level and falling
Neutral - neither Buy nor Sell
Moving Average Convergence/Divergence (MACD)
Buy - values of the main line > values of the signal line and rising
Sell - values of the main line < values of the signal line and falling
Neutral - neither Buy nor Sell
Klinger
Buy - indicator >= 0 and rising
Sell - indicator < 0 and falling
Neutral - neither Buy nor Sell
Average Directional Index (ADX)
Buy - indicator > 20 and +DI line crosses over the -DI line and rising
Sell - indicator > 20 and +DI line crosses below the -DI line and falling
Neutral - neither Buy nor Sell
Awesome Oscillator
Buy - Crossover 0 and values are greater than 0, or exceed the zero line
Sell - Crossunder 0 and values are lower than 0, or fall below the zero line
Neutral - neither Buy nor Sell
Ultimate Oscillator
Buy - Crossover oversold level and indicator < oversold level and rising
Sell - Crossunder oversold level and indicator >= oversold level and falling
Neutral - neither Buy nor Sell
Williams Percent Range
Buy - Crossover Oversold Level and Indicator < Oversold Level and rising
Sell - Crossunder Oversold Level and Indicator >= Oversold Level and falling
Neutral - neither Buy nor Sell
Momentum
Buy - Crossover 0 and indicator levels rising
Sell - Crossunder 0 and indicator values falling
Neutral - neither Buy nor Sell
Total Ratings
The numerical value of the rating "Sell" is 0, "Neutral" is 0 and "Buy" is 1. The total rating is calculated as the average of the ratings of the individual indicators and are determined according to the following criteria:
MaxCount = 12 (depending on whether other oscillators are added).
CompareSellStrong = MaxCount * 0.3
CompareMid = MaxCount * 0.5
CompareBuyStrong = MaxCount * 0.7
value <= CompareSellStrong - Strong Sell
value < CompareMid and value > CompareSellStrong - Sell
value == 6 - Neutral
value > CompareMid and value < CompareBuyStrong - Buy
value >= CompareBuyStrong - Strong Buy
Understanding the results
The Multi Trend Oscillator is designed so that its values fluctuate between 0 and currently 12 (maximum number of integrated indicators). Its values are displayed as a histogram with green, red and gray bars. The bars are gray when the value of the indicator is at half of the number of indicators used, currently 12. Increasingly saturated green bars indicate increasing values above 6, and increasingly saturated red bars indicate increasingly decreasing values below 6.
The table at the end of the histogram shows details (can be activated in the settings) about the overall rating and the individual indicators. Its color is determined by the rating value: gray for neutral, green for buy or strong buy, red for sell or strong sell.
The following alarms are triggered:
Multi Trend Oscillator: Sell
Multi Trend Oscillator: Strong Sell
Multi Trend Oscillator: Buy
Multi Trend Oscillator: Strong Buy

Cyclic RSI High Low With Noise Filter█ OVERVIEW
This indicator displays Cyclic Relative Strength Index based on Decoding the Hidden Market Rhythm, Part 1 written by Lars von Thienen.
To determine true or false for Overbought / Oversold are unnecessary, therefore these should be either strong or weak.
Noise for weak Overbought / Oversold can be filtered, especially for smaller timeframe.
█ FEATURES
Display calculated Cyclic Relative Strength Index.
Zigzag high low based on Cyclic Relative Strength Index.
Able to filter noise for high low.
█ LEGENDS
◍ Weak Overbought / Oversold
OB ▼ = Strong Overbought
OS ▲ = Strong Oversold
█ USAGE / TIPS
Recommend to be used for Harmonic Patterns such as XABCD and ABCD.
Condition 1 (XABCD) : When ▼ and ▲ exist side by side, usually this outline XA, while the next two ◍ can be BC.
Condition 2 (ABCD) : When ▼ and ▲ exist side by side, usually this outline AB, while the next one ◍ can be BC, strong ABCD.
Condition 3 (ABCD) : When ▼ or ▲ exist at Point A, the next two ◍ can be Point B and Point C, medium ABCD.
Condition 4 (ABCD) : When ◍ exist at Point a, the next two ◍ can be Point b and Point c, weak ABCD usually used as lower case as abcd.
█ CREDITS
LoneSomeTheBlue
WhenToTrade

Indicators Combination Framework v3 IND [DTU]Hello All,
This script is a framework to analyze and see the results by combine selected indicators for (long, short, longexit, shortexit) conditions.
I was designed this for beginners and users to facilitate to see effects of the technical indicators combinations on the chart WITH NO CODE
You can improve your strategies according the results of this system by connecting the framework to a strategy framework/template such as Pinecoder, Benson, daveatt or custom.
This is enhanced version of my previous indicator "Indicators & Conditions Test Framework "
Currently there are 93 indicators (23 newly added) connected over library. You can also import an External Indicator or add Custom indicator (In the source)
It is possible to change it from Indicator to strategy (simple one) by just remarking strategy parts in the source code and see real time profit of your combinations
Feel free to change or use it in your source
Special thanks goes to Pine wizards: Trading view (built-in Indicators), @Rodrigo, @midtownsk8rguy, @Lazybear, @Daveatt and others for their open source codes and contributions
SIMPLE USAGE
1. SETTING: Show Alerts= True (To see your entries and Exists)
2. Define your Indicators (ex: INDICATOR1: ema(close,14), INDICATOR2: ema(close,21), INDICATOR3: ema(close,200)
3. Define Your Combinations for long & Short Conditions
a. For Long: (INDICATOR1 crossover INDICATOR2) AND (INDICATOR3 < close)
b. For Short: (INDICATOR1 crossunder INDICATOR2) AND (INDICATOR3 > close)
4. Select Strategy/template (Import strategy to chart) that you export your signals from the list
5. Analyze the best profit by changing Indicators values
SOME INDICATORS DETAILS
Each Indicator includes:
- Factorization : Converting the selected indicator to Double, triple Quadruple such as EMA to DEMA, TEMA QEMA
- Log : Simple or log10 can be used for calculation on function entries
- Plot Type : You can overlay the indicator on the chart (such ema) or you can use stochastic/Percentrank approach to display in the variable hlines range
- Extended Parametes : You can use default parameters or you can use extended (P1,P2) parameters regarding to indicator type and your choice
- Color : You can define indicator color and line properties
- Smooth : you can enable swma smooth
- indicators : you can select one of the 93 function like ema(),rsi().. to define your indicator
- Source : you can select from already defined indicators (IND1-4), External Indicator (EXT), Custom Indicator (CUST), and other sources (close, open...)
CONDITION DETAILS
- There are are 4 type of conditions, long entry, short entry, long exit, short exit.
- Each condition are built up from 4 combinations that joined with "AND" & "OR" operators
- You can see the results by enabling show alerts check box
- If you only wants to enter long entry and long exit, just fill these conditions
- If "close on opposite" checkbox selected on settings, long entry will be closed on short entry and vice versa
COMBINATIONS DETAILS
- There are 4 combinations that joined with "AND" & "OR" operators for each condition
- combinations are built up from compare 1st entry with 2nd one by using operator
- 1st and 2nd entries includes already defined indicators (IND1-5), External Indicator (EXT), Custom Indicator (CUST), and other sources (close, open...)
- Operators are comparison values such as >,<, crossover,...
- 2nd entry include "VALUE" parameter that will use to compare 1st indicator with value area
- If 2nd indicator selected different than "VALUE", value are will mean previous value of the selection. (ex: value area= 2, 2nd entry=close, means close )
- Selecting "NONE" for the 1st entry will disable calculation of current and following combinations
JOINS DETAILS
- Each combination will join wiht the following one with the JOIN (AND, OR) operator (if the following one is not equal "NONE")
CUSTOM INDICATOR
- Custom Indicator defines harcoded in the source code.
- You can call it with "CUST" in the Indicator definition source or combination entries source
- You can change or implement your custom indicator by updating the source code
EXTERNAL INDICATOR
- You can import an external indicator by selecting it from the ext source.
- External Indicator should be already imported to the chart and it have an plot function to output its signal
EXPORTING SIGNAL
- You can export your result to an already defined strategy template such as Pine coders, Benson, Daveatt Strategy templates
- Or you can define your custom export for other future strategy templates
ALERTS
- By enabling show alerts checkbox, you can see long entry exits on the bottom, and short entry exits aon the top of the chart
ADDITIONAL INFO
- You can see all off the inputs descriptions in the tooltips. (You can also see the previous version for details)
- Availability to set start, end dates
- Minimize repainting by using security function options (Secure, Semi Secure, Repaint)
- Availability of use timeframes
-
Version 3 INDICATORS LIST (More to be added):
▼▼▼ OVERLAY INDICATORS ▼▼▼
alma(src,len,offset=0.85,sigma=6).-------Arnaud Legoux Moving Average
ama(src,len,fast=14,slow=100).-----------Adjusted Moving Average
accdist().-------------------------------Accumulation/distribution index.
cma(src,len).----------------------------Corrective Moving average
dema(src,len).---------------------------Double EMA (Same as EMA with 2 factor)
ema(src,len).----------------------------Exponential Moving Average
gmma(src,len).---------------------------Geometric Mean Moving Average
highest(src,len).------------------------Highest value for a given number of bars back.
hl2ma(src,len).--------------------------higest lowest moving average
hma(src,len).----------------------------Hull Moving Average.
lagAdapt(src,len,perclen=5,fperc=50).----Ehlers Adaptive Laguerre filter
lagAdaptV(src,len,perclen=5,fperc=50).---Ehlers Adaptive Laguerre filter variation
laguerre(src,len).-----------------------Ehlers Laguerre filter
lesrcp(src,len).-------------------------lowest exponential esrcpanding moving line
lexp(src,len).---------------------------lowest exponential expanding moving line
linreg(src,len,loffset=1).---------------Linear regression
lowest(src,len).-------------------------Lovest value for a given number of bars back.
mcginley(src, len.-----------------------McGinley Dynamic adjusts for market speed shifts, which sets it apart from other moving averages, in addition to providing clear moving average lines
percntl(src,len).------------------------percentile nearest rank. Calculates percentile using method of Nearest Rank.
percntli(src,len).-----------------------percentile linear interpolation. Calculates percentile using method of linear interpolation between the two nearest ranks.
previous(src,len).-----------------------Previous n (len) value of the source
pivothigh(src,BarsLeft=len,BarsRight=2).-Previous pivot high. src=src, BarsLeft=len, BarsRight=p1=2
pivotlow(src,BarsLeft=len,BarsRight=2).--Previous pivot low. src=src, BarsLeft=len, BarsRight=p1=2
rema(src,len).---------------------------Range EMA (REMA)
rma(src,len).----------------------------Moving average used in RSI. It is the exponentially weighted moving average with alpha = 1 / length.
sar(start=len, inc=0.02, max=0.02).------Parabolic SAR (parabolic stop and reverse) is a method to find potential reversals in the market price direction of traded goods.start=len, inc=p1, max=p2. ex: sar(0.02, 0.02, 0.02)
sma(src,len).----------------------------Smoothed Moving Average
smma(src,len).---------------------------Smoothed Moving Average
super2(src,len).-------------------------Ehlers super smoother, 2 pole
super3(src,len).-------------------------Ehlers super smoother, 3 pole
supertrend(src,len,period=3).------------Supertrend indicator
swma(src,len).---------------------------Sine-Weighted Moving Average
tema(src,len).---------------------------Triple EMA (Same as EMA with 3 factor)
tma(src,len).----------------------------Triangular Moving Average
vida(src,len).---------------------------Variable Index Dynamic Average
vwma(src,len).---------------------------Volume Weigted Moving Average
volstop(src,len,atrfactor=2).------------Volatility Stop is a technical indicator that is used by traders to help place effective stop-losses. atrfactor=p1
wma(src,len).----------------------------Weigted Moving Average
vwap(src_).------------------------------Volume Weighted Average Price (VWAP) is used to measure the average price weighted by volume
▼▼▼ NON OVERLAY INDICATORS ▼▼
adx(dilen=len, adxlen=14, adxtype=0).----adx. The Average Directional Index (ADX) is a used to determine the strength of a trend. len=>dilen, p1=adxlen (default=14), p2=adxtype 0:ADX, 1:+DI, 2:-DI (def:0)
angle(src,len).--------------------------angle of the series (Use its Input as another indicator output)
aroon(len,dir=0).------------------------aroon indicator. Aroons major function is to identify new trends as they happen.p1 = dir: 0=mid (default), 1=upper, 2=lower
atr(src,len).----------------------------average true range. RMA of true range.
awesome(fast=len=5,slow=34,type=0).------Awesome Oscilator is an indicator used to measure market momentum. defaults : fast=len= 5, p1=slow=34, p2=type: 0=Awesome, 1=difference
bbr(src,len,mult=1).---------------------bollinger %%
bbw(src,len,mult=2).---------------------Bollinger Bands Width. The Bollinger Band Width is the difference between the upper and the lower Bollinger Bands divided by the middle band.
cci(src,len).----------------------------commodity channel index
cctbbo(src,len).-------------------------CCT Bollinger Band Oscilator
change(src,len).-------------------------A.K.A. Momentum. Difference between current value and previous, source - source . is most commonly referred to as a rate and measures the acceleration of the price and/or volume of a security
cmf(len=20).-----------------------------Chaikin Money Flow Indicator used to measure Money Flow Volume over a set period of time. Default use is len=20
cmo(src,len).----------------------------Chande Momentum Oscillator. Calculates the difference between the sum of recent gains and the sum of recent losses and then divides the result by the sum of all price movement over the same period.
cog(src,len).----------------------------The cog (center of gravity) is an indicator based on statistics and the Fibonacci golden ratio.
copcurve(src,len).-----------------------Coppock Curve. was originally developed by Edwin Sedge Coppock (Barrons Magazine, October 1962).
correl(src,len).-------------------------Correlation coefficient. Describes the degree to which two series tend to deviate from their ta.sma values.
count(src,len).--------------------------green avg - red avg
cti(src,len).----------------------------Ehler s Correlation Trend Indicator by
dev(src,len).----------------------------ta.dev() Measure of difference between the series and its ta.sma
dpo(len).--------------------------------Detrended Price OScilator is used to remove trend from price.
efi(len).--------------------------------Elders Force Index (EFI) measures the power behind a price movement using price and volume.
eom(len=14,div=10000).-------------------Ease of Movement.It is designed to measure the relationship between price and volume.p1 = div: 10000= (default)
falling(src,len).------------------------ta.falling() Test if the `source` series is now falling for `length` bars long. (Use its Input as another indicator output)
fisher(len).-----------------------------Fisher Transform is a technical indicator that converts price to Gaussian normal distribution and signals when prices move significantly by referencing recent price data
histvol(len).----------------------------Historical volatility is a statistical measure used to analyze the general dispersion of security or market index returns for a specified period of time.
kcr(src,len,mult=2).---------------------Keltner Channels Range
kcw(src,len,mult=2).---------------------ta.kcw(). Keltner Channels Width. The Keltner Channels Width is the difference between the upper and the lower Keltner Channels divided by the middle channel.
klinger(type=len).-----------------------Klinger oscillator aims to identify money flow’s long-term trend. type=len: 0:Oscilator 1:signal
macd(src,len).---------------------------MACD (Moving Average Convergence/Divergence)
mfi(src,len).----------------------------Money Flow Index s a tool used for measuring buying and selling pressure
msi(len=10).-----------------------------Mass Index (def=10) is used to examine the differences between high and low stock prices over a specific period of time
nvi().-----------------------------------Negative Volume Index
obv().-----------------------------------On Balance Volume
pvi().-----------------------------------Positive Volume Index
pvt().-----------------------------------Price Volume Trend
ranges(src,upper=len, lower=-5).---------ranges of the source. src=src, upper=len, v1:lower=upper . returns: -1 source=upper otherwise 0
rising(src,len).-------------------------ta.rising() Test if the `source` series is now rising for `length` bars long. (Use its Input as another indicator output)
roc(src,len).----------------------------Rate of Change
rsi(src,len).----------------------------Relative strength Index
rvi(src,len).----------------------------The Relative Volatility Index (RVI) is calculated much like the RSI, although it uses high and low price standard deviation instead of the RSI’s method of absolute change in price.
smi_osc(src,len,fast=5, slow=34).--------smi Oscillator
smi_sig(src,len,fast=5, slow=34).--------smi Signal
stc(src,len,fast=23,slow=50).------------Schaff Trend Cycle (STC) detects up and down trends long before the MACD. Code imported from
stdev(src,len).--------------------------Standart deviation
trix(src,len) .--------------------------the rate of change of a triple exponentially smoothed moving average.
tsi(src,len).----------------------------The True Strength Index indicator is a momentum oscillator designed to detect, confirm or visualize the strength of a trend.
ultimateOsc(len.-------------------------Ultimate Oscillator indicator (UO) indicator is a technical analysis tool used to measure momentum across three varying timeframes
variance(src,len).-----------------------ta.variance(). Variance is the expectation of the squared deviation of a series from its mean (ta.sma), and it informally measures how far a set of numbers are spread out from their mean.
willprc(src,len).------------------------Williams %R
wad().-----------------------------------Williams Accumulation/Distribution.
wvad().----------------------------------Williams Variable Accumulation/Distribution.
HISTORY
v3.01
ADD: 23 new indicators added to indicators list from the library. Current Total number of Indicators are 93. (to be continued to adding)
ADD: 2 more Parameters (P1,P2) for indicator calculation added. Par:(Use Defaults) uses only indicator(Source, Length) with library's default parameters. Par:(Use Extra Parameters P1,P2) use indicator(Source,Length,p1,p2) with additional parameters if indicator needs.
ADD: log calculation (simple, log10) option added on indicator function entries
ADD: New Output Signals added for compatibility on exporting condition signals to different Strategy templates.
ADD: Alerts Added according to conditions results
UPD: Indicator source inputs now display with indicators descriptions
UPD: Most off the source code rearranged and some functions moved to the new library. Now system work like a little bit frontend/backend
UPD: Performance improvement made on factorization and other source code
UPD: Input GUI rearranged
UPD: Tooltips corrected
REM: Extended indicators removed
UPD: IND1-IND4 added to indicator data source. Now it is possible to create new indicators with the previously defined indicators value. ex: IND1=ema(close,14) and IND2=rsi(IND1,20) means IND2=rsi(ema(close,14),20)
UPD: Custom Indicator (CUST) added to indicator data source and Combination Indicator source.
UPD: Volume added to indicator data source and Combination Indicator source.
REM: Custom indicators removed and only one custom indicator left
REM: Plot Type "Org. Range (-1,1)" removed
UPD: angle, rising, falling type operators moved to indicator library

RSI Trend LineI took a concept similar to the "Adaptive RSI" to get the RSI overlaid on a price chart. The problem I have with the Adaptive RSI is to me it sticks too closely to price. I wanted something much more visually helpful that can provide actual tradable signals and strategies.
The orange line you are seeing is the "RSI Trend Line"
The further the RSI moves away from a value of 50 (the "zero line"), the more you see this orange line move away from price. This helps visualize the strength of price pushing away from a neutral value to a position of strength or weakness-- if orange is below price then relative strength is high; if orange is above price then relative strength is low. When price is equal to the orange RSI line, the RSI is at a value of 50.
In addition to the trend line, you can enable bands which reflect Overbought and Oversold levels . If you leave the responsiveness to a value of 1.0 and removed any smoothing, these should pretty accurately reflect an actual RSI chart topping the OB and OS lines (default 70 and 30, respectively). (They're still very close with different responsiveness and smoothing values)
The conversion or scaling of RSI value onto price comes with a bit of a quirk which I decided to leave to the user to determine how they want it applied. So the setting "Responsiveness" will impact the sort of aggressiveness of the RSI trend line as well as the the size of the bands. You could think of this in some ways as the OPPOSITE of the multiple setting on a Bollinger or Keltner band-- 1.0 will make for the widest band, 2.0 is the default and my preference, and you can move it up to a value of 5.0.
Here are some examples of how you could use the indicator for trade signals--
And here's my thought on the current state (as of 10/06) on indices with regards to this indicator-

Market Strength ScannerHey traders, this is a table-based market relative strength and true strength scanner, designed to allow the users to get data from multiple pairs without having to go onto that pair for their strength's. This indicator uses functions to fetch data from other pairs so that the code is optimised and prevents slow loading. Furthermore, the indicator is easy to understand and use as there isn't a lot of settings for it, you can adjust the length of the true strength index or the relative strength index through one input box, you can change the data type from RSI to TSI without changing the code, and you can customise what pairs you want to display. Furthermore, the user can set alerts for the pairs that they want to have such as setting alerts for overbought and oversold zones. That's all to this indicator and I hope it is of use to some people :)

RelativeStrengthComparative_IBD_YRKI am publising Relative Strength Comparative.
It is be used to compare a Stock's Performance against another stock/index (Default NIFTY50)
I also devised a Plot RS Rating which is inspired from IBD's RS Rating and matches to some extent. You can turn off/on the RS Rating as per need.
Example: ITC vs NIFTY 50 it will be ITC / NIFTY
The Indicator can be used in Multiple ways:
1) Check Relative Strength
2) Check RS Rating (This is not Accurate as of now since IBD compares the ratings of all the stocks in an Exchange)
3) Can be used as a Spread Chart for the Division (We need to not divide every time we change Stocks)
4) Design a Template exactly as MarketSmith by using the TradingView feature of "Move to --> Existing Pane Above"
The Formula i used for RS Rating is below with more weightage on the 3 month performance and lesser on 12 month Performance. I am open to Modification of this Formula if a better suggestion
// relative strength IBD style
ThreeMthRS = 0.4*(close/close)
SixMthRS = 0.2*(close/(close*2))
NineMthRS = 0.2*(close/(close*3))
TwelveMthRS = 0.2*(close/(close*4))
Choppiness Index and RSI by ceyhun
Choppiness Index and RSI by ceyhun
This indicator is based on the inverse relationship between CHOP and RSI.
Bar color
If the RSI is greater than CHOP, the Bar color will be blue.
If CHOP is greater than RSI, the bar color will be red.
CHOP
If CHOP is less than 38.2, the color will turn blue. positive
If the CHOP is between 38.2 and 61.8, the color will be yellow and neutral.
If CHOP is greater than 61.8, the color will turn red. negative
Rsi
If Rsi is greater than 61.8, the color will turn blue, positive
If Rsi is between 38.2 and 61.8, the color will be hexagonal and neutral
If Rsi is less than 38.2 the color will be red, negative
The Choppiness Index (CHOP) is an indicator designed to determine if the market is choppy (trading sideways) or not choppy (trading within a trend in either direction). The Choppiness Index is an example of an indicator that is not directional at all. CHOP is not meant to predict future market direction, it is a metric to be used to for defining the market's trendiness only. A basic understanding of the indicator would be; higher values equal more choppiness, while lower values indicate directional trending.
Relative Strength Index (RSI)
The Relative Strength Index (RSI) is a well versed momentum based oscillator which is used to measure the speed (velocity) as well as the change (magnitude) of directional price movements. Essentially the RSI, when graphed, provides a visual mean to monitor both the current, as well as historical, strength and weakness of a particular market. The strength or weakness is based on closing prices over the duration of a specified trading period creating a reliable metric of price and momentum changes. Given the popularity of cash settled instruments (stock indexes) and leveraged financial products (the entire field of derivatives); RSI has proven to be a viable indicator of price movements.

Rumpy's Dynamic Momentum IndexNote : I haven't been able to determine from the info I've found whether the variable length is used for the average gain/loss part of the calculation and/or for the relative strength portion of the calculation . If anyone knows for certain please let me know.
Type A only uses the variable length for the final relative strength calculation and the fixed RSI length for the average gain/loss.
Type B uses the variable length for both.
I do suspect that Type B is correct though as it is a lot more sensitive to momentum changes while Type A tends to just exaggerate normal RSI
-------------------------------------------------------------------------------------------------------------------------------------------
This indicator, developed by Tushar Chande and Stanley Kroll, is similar to the relative strength index (RSI). The main difference between the two is that the RSI uses a fixed number of time periods (usually 14) in its calculation, while the dynamic momentum index uses different time periods as volatility changes, typically between five and 30.
The dynamic momentum index uses fewer periods in its calculation when volatility is high, and more periods when volatility is low.
The number of time periods used in the dynamic momentum index decreases as volatility in the underlying security increases, making this indicator more responsive to changing prices than the RSI. This is particularly useful when an asset's price moves quickly as it approaches key support or resistance levels. Because the indicator is more sensitive, traders can potentially find earlier entry and exit points than with the RSI.
-------------------------------------------------------------------------------------------------------------------------------------------
If you find it useful please consider a tip/donation :
BTC - 3BMEXEDyWJ58eXUEALYPadbn1wwWKmf6sA
[ALERTS] ADX and DIThe average directional index (ADX) is a technical analysis metric. Analysts use it to determine the relative strength of a trend, with the direction of the trend either upwards or downwards.
The Average Directional Index (ADX) along with the Negative Directional Indicator (-DI) and the Positive Directional Indicator (+DI) are momentum strength indicators that evolved for use in stock trading. Commodities trader J. Welles Wilder pioneered their use. Technical traders who use charting techniques want to know when first spotting a shifting trend how strong that trend is and how likely it is to sustain itself over time. The ADX helps investors determine trend strength as they plan their investment strategies.
Confirmation on a chart and other momentum indicators help investors spot trend reversals. But some trends are more potent than others and investors want to better understand the strength of a trend. The ADX identifies a strong positive trend when the ADX is over 25 and a weak trend when the ADX is below 20. Investors can determine directional movement by analyzing the difference between two consecutive low prices and their correlated highs. The movement is +DM when the current high price, less the previous high price, is greater than the previous low price less the current low. The opposite applies in determining the negative or –DI.
When analyzing charts, stock price is the single most important variable to follow. ADX and other indicators are supplementary to price movements in providing additional directional information and support. For example, some of the best trends come about from price range consolidation. It is those tugs of war between buying and selling volumes that lead to breakouts and other trading opportunities.
The Inventor of the Average Directional Index
J. Welles Wilder, Jr. is a former American engineer and real estate developer who went on to revolutionize trading analysis by applying mathematical systems to the world of investing. In addition to developing the ADX, Wilder is also responsible for several other commonly used technical analysis tools including the Average True Range (ATR), the Relative Strength Index (RSI) and the Parabolic SAR.
www.investopedia.com
This script has alerts and includes the filter for markets with no trend defined.
Green Alert --> Long
Red Alert --> Short
Yellow Area --> Weak trend. ADX below threshold
Green candles --> Bullish Market
Red Candles --> Bearish Market
Orange candles --> No defined trend
Enjoy!

Relative Momentum Index Strategy The Relative Momentum Index (RMI) was developed by Roger Altman. Impressed
with the Relative Strength Index's sensitivity to the number of look-back
periods, yet frustrated with it's inconsistent oscillation between defined
overbought and oversold levels, Mr. Altman added a momentum component to the RSI.
As mentioned, the RMI is a variation of the RSI indicator. Instead of counting
up and down days from close to close as the RSI does, the RMI counts up and down
days from the close relative to the close x-days ago where x is not necessarily
1 as required by the RSI). So as the name of the indicator reflects, "momentum" is
substituted for "strength".
WARNING:
- This script to change bars colors.

Currency Relative Strengths V.2 [GM]Version 2 Updates
Speed has been increased by ~7X
Highest and lowest pairs now highlighted using brighter colors
Re-ordered pairs from highest to lowest 'flight to risk' rating
I created this tool for the purpose of determining strongest and weakest currencies over different periods of time. Each major currency is compared to the field of other majors and its average change is measured over a predetermined period of time. The result is displayed as a percentage. I use it for trend following but it can also be used to fade exhaustion.
Instructions
Add indicator to chart
Select a time frame under settings
Place cursor over period of interest
Click "Data Window" on right hand side bar
View % change avg values for each currency

Relative Momentum Index The Relative Momentum Index (RMI) was developed by Roger Altman. Impressed
with the Relative Strength Index's sensitivity to the number of look-back
periods, yet frustrated with it's inconsistent oscillation between defined
overbought and oversold levels, Mr. Altman added a momentum component to the RSI.
As mentioned, the RMI is a variation of the RSI indicator. Instead of counting
up and down days from close to close as the RSI does, the RMI counts up and down
days from the close relative to the close x-days ago where x is not necessarily
1 as required by the RSI). So as the name of the indicator reflects, "momentum" is
substituted for "strength".

EMA-RSI-ADX Trend Bands
📌 EMA-RSI-ADX Trend Bands (ERA Trend Bands)
🔥 Overview
The ERA Trend Bands indicator combines Exponential Moving Average (EMA), Relative Strength Index (RSI), and Average Directional Index (ADX) into a powerful multi-factor trend system.
It helps traders:
Identify trend direction (Bullish / Bearish)
Measure trend strength using EMA deviation bands
Confirm momentum with RSI & ADX filters
Visualize conditions with dynamic colors, labels, tables, and signals
⚡ Key Features
📍 EMA Trend Bands
EMA100 with gradient glow effect showing trend bias
Strength bands around EMA (Very Weak → Hyper levels)
Bands color-coded for bullish/bearish extremes
📊 RSI + ADX Confluence
Bullish Signal: RSI ≥ threshold & ADX ≥ threshold → 🟢
Bearish Signal: RSI ≤ threshold & ADX ≤ threshold → 🔴
Candles recolored when conditions are met
Auto-generated labels show live RSI/ADX values
🧩 Strength Levels
Classifies deviation from EMA into 8 levels:
Neutral → Very Weak → Weak → Moderate → Strong → Very Strong → Extreme → Hyper
Dashboard table shows deviation % ranges & strength colors
Dynamic labels display Trend, Strength, Deviation %, RSI & ADX
🎨 Visual Enhancements
Gradient EMA line with glow effect
Bullish (greens) & bearish (reds) vibrant palettes
Background coloring (optional) based on strength
Symbols & labels for entry confirmation
🎯 How to Use
Trend Direction – EMA color + deviation bands show whether market is bullish or bearish.
Strength Confirmation – Use strength labels & dashboard table to gauge overextension.
Entry Signals – Watch for RSI/ADX confluence (green/red labels on chart).
Exits – Monitor when strength fades back toward Neutral/Weak levels.
⚙️ Settings & Inputs
EMA Settings → Length, Line Width, Gradient Intensity
RSI Settings → Length & Thresholds (Bullish / Bearish)
ADX Settings → Length & Thresholds (Bullish / Bearish)
Bands → Enable/disable EMA deviation bands
Labels/Table → Toggle strength info display
Colors → Fully customizable vibrant palettes
🚨 Alerts & Signals
Bullish Condition → RSI & ADX above thresholds
Bearish Condition → RSI & ADX below thresholds
Visual confirmation with labels, candles, and background
⚠️ Disclaimer
This script is for educational purposes only.
It does not constitute financial advice.
Always backtest and use proper risk management before trading live.
✨ Add EMA-RSI-ADX Trend Bands (ERA Trend Bands) to your chart to trade with clarity, strength, and precision.

Bollinger Bands (SMA 21, 2.618σ)Indicator Description: Bollinger Bands (2.618σ, 21 SMA) + RSI with Fibonacci
This custom indicator combines Bollinger Bands and Relative Strength Index (RSI), enhanced with Fibonacci-based configurations, to provide confluence signals for rejection candles, reversal setups, and continuation patterns.
Bollinger Bands Settings (Customized)
Middle Band → 21-period Simple Moving Average (SMA)
Upper Band → SMA + 2.618 standard deviations
Lower Band → SMA − 2.618 standard deviations
These parameters expand the bands compared to the traditional (20, 2.0) settings, making them better suited for volatility extremes and higher timeframe swing analysis.
Color Scheme
Middle Band = Orange
Upper Band = Red
Lower Band = Green
This color-coding emphasizes key rejection levels visually.
Candle Rejection Logic
The indicator is designed to highlight potential rejection candles when price interacts with the outer Bollinger Bands:
At the Upper Band, rejection signals suggest overextension and potential downside reaction.
At the Lower Band, rejection signals suggest oversold conditions and potential upside reaction.
Rejection Candle Types Tracked
Hammer (bullish reversal, lower rejection wick at bottom band)
Inverted Hammer (bearish reversal, upper rejection wick at top band)
Doji candles (indecision at band extremes)
Double Top formations near the upper band
Double Bottom formations near the lower band
Relative Strength Index (RSI) Settings
RSI is configured with Fibonacci retracement levels instead of traditional 30/70 thresholds.
Fibonacci sequence levels used include:
23.6% (0.236)
38.2% (0.382)
50% (0.5)
61.8% (0.618)
78.6% (0.786)
This alignment with Fibonacci ratios provides deeper market structure insights into momentum strength and exhaustion points.
Trading Confluence Zones
Upper Band + RSI at 0.618–0.786 zone → High probability bearish rejection.
Lower Band + RSI at 0.236–0.382 zone → High probability bullish reversal.
Band interaction + Doji or Hammer candles → Stronger signal confirmation.
Use Cases
Identifying trend exhaustion when price repeatedly fails to break above the upper band.
Spotting accumulation or distribution phases when price consolidates around Fibonacci-based RSI zones.
Detecting false breakouts when candle patterns (like Doji or Inverted Hammer) occur beyond the bands.
Why 2.618 Deviation & 21 SMA?
Standard Bollinger Bands (20, 2.0) capture ~95% of price action.
By widening to 2.618σ, we target extreme volatility outliers — areas where reversals are statistically more likely.
A 21-period SMA aligns better with common cycle lengths (3 trading weeks on daily charts) and Fibonacci-related time cycles.
Practical Strategy
Step 1: Watch when price touches or pierces the upper/lower band.
Step 2: Check for candle rejection patterns (Hammer, Inverted Hammer, Doji, Double Top/Bottom).
Step 3: Confirm with RSI Fibonacci levels for confluence.
Step 4: Trade with the prevailing trend or look for reversal setups if multiple confluence factors align.
Cautions
Not all touches of the bands signal reversals — strong trends can ride along the bands for extended periods.
Always combine with price action structure, volume, and higher timeframe trend bias.
📌 Summary
This indicator blends volatility-based bands with Fibonacci momentum analysis and classical candle rejection patterns. The combination of Bollinger Bands (21, 2.618σ) and RSI Fibonacci levels helps traders detect high-probability rejection zones, reversal opportunities, and overextended conditions with improved accuracy over traditional default settings.
