[blackcat] L2 Rhythm RiderOVERVIEW
The L2 Rhythm Rider is an advanced technical analysis tool meticulously crafted to assist traders in identifying intricate market rhythms and uncovering lucrative trading opportunities. By integrating sophisticated calculations such as weighted averages, deviations from Simple Moving Averages (SMAs), and bespoke oscillators, this indicator offers profound insights into market dynamics, momentum, and trend reversals. Whether you're a seasoned trader looking to refine your strategies or a novice seeking robust analytical tools, the Rhythm Rider provides a comprehensive suite of features tailored to enhance your decision-making process 📊✅.
FEATURES
Comprehensive Calculation Suite:
Percentage Deviation from SMA: Quantifies the deviation of the current price from the Simple Moving Average, providing a nuanced understanding of price behavior relative to historical trends.
Normalized Price Range: Standardizes price movements within a defined range, offering a clearer perspective on market volatility and stability.
Explore Line and Average: Utilizes Exponential Moving Averages (EMAs) to gauge market momentum, helping traders anticipate potential shifts in direction.
Banker Fund and Average: Evaluates market sentiment across varying timeframes, enabling traders to align their strategies with broader market trends.
RSI-Like Indicator: Delivers a Relative Strength Index-inspired metric that assesses the magnitude of price changes, akin to traditional RSI but with unique enhancements.
Bear Power: Analyzes selling pressure by examining recent highs and lows, providing valuable insights into bearish market conditions.
Enhanced Color Coding:
Overbought Conditions: Values exceeding 70 are emphasized with warm hues like red and orange, signaling potential overbought scenarios where caution is advised 🔥.
Oversold Conditions: Values falling below 60 are accentuated with cool tones such as blue and cyan, indicating oversold situations ripe for potential buying opportunities ❄️.
Adjusted Line Widths:
Improved Visibility: Line widths have been fine-tuned to ensure clear differentiation between various plotted elements, making it easier to interpret complex market data at a glance 👀.
Visual Representation:
Explore Line: Displayed in blue or red, depending on its value, to signify bullish or bearish momentum.
Banker Fund: Illustrated in orange or aqua, reflecting differing levels of market sentiment.
Bear Power: Depicted through purple columns, highlighting areas of significant selling pressure.
Trade Signals:
Buy ('B') and Sell ('S') Labels: Clearly marked on the chart to indicate optimal entry and exit points, facilitating swift and informed trading decisions 🏷️.
Automated Alerts:
Customizable Notifications: Generate alerts based on predefined conditions, ensuring traders never miss out on critical market movements 🔔.
HOW TO USE
Adding the Indicator:
Navigate to your TradingView chart and select the L2 Rhythm Rider from the indicators list.
Interpreting Visual Elements:
Familiarize yourself with the various plotted lines and columns, each representing distinct facets of market momentum and sentiment.
Monitoring Trade Opportunities:
Keep an eye on the chart for buy and sell labels, which signal potential trading opportunities based on the indicator's calculations.
Setting Up Alerts:
Configure alerts to notify you when specific conditions are met, allowing for timely action without constant chart monitoring 📲.
Combining Insights:
Integrate the information derived from all plotted elements to form a holistic view of the market, enhancing the reliability of your trading decisions.
LIMITATIONS
Market Volatility: In highly volatile or ranging markets, the indicator might produce false signals, necessitating additional confirmation from other analytical tools 🌪️.
Supplementary Analysis: For enhanced accuracy, users should complement this indicator with other forms of technical and fundamental analysis.
Asset and Timeframe Sensitivity: The performance of the indicator can fluctuate based on the asset type and chosen timeframe, requiring periodic adjustments and evaluations.
NOTES
Data Sufficiency: Ensure ample historical data is available to facilitate precise calculations and reliable results.
Demo Testing: Thoroughly test the indicator on demo accounts prior to deploying it in live trading environments to understand its nuances and limitations 🔍.
Personalization: Tailor the indicator’s settings and visual preferences to better suit individual trading styles and objectives.
Search in scripts for "relative strength"

RSI Forecast [Titans_Invest]RSI Forecast
Introducing one of the most impressive RSI indicators ever created – arguably the best on TradingView, and potentially the best in the world.
RSI Forecast is a visionary evolution of the classic RSI, merging powerful customization with groundbreaking predictive capabilities. While preserving the core principles of traditional RSI, it takes analysis to the next level by allowing users to anticipate potential future RSI movements.
Real-Time RSI Forecasting:
For the first time ever, an RSI indicator integrates linear regression using the least squares method to accurately forecast the future behavior of the RSI. This innovation empowers traders to stay one step ahead of the market with forward-looking insight.
Highly Customizable:
Easily adapt the indicator to your personal trading style. Fine-tune a variety of parameters to generate signals perfectly aligned with your strategy.
Innovative, Unique, and Powerful:
This is the world’s first RSI Forecast to apply this predictive approach using least squares linear regression. A truly elite-level tool designed for traders who want a real edge in the market.
⯁ SCIENTIFIC BASIS LINEAR REGRESSION
Linear Regression is a fundamental method of statistics and machine learning, used to model the relationship between a dependent variable y and one or more independent variables 𝑥.
The general formula for a simple linear regression is given by:
y = β₀ + β₁x + ε
Where:
y = is the predicted variable (e.g. future value of RSI)
x = is the explanatory variable (e.g. time or bar index)
β0 = is the intercept (value of 𝑦 when 𝑥 = 0)
𝛽1 = is the slope of the line (rate of change)
ε = is the random error term
The goal is to estimate the coefficients 𝛽0 and 𝛽1 so as to minimize the sum of the squared errors — the so-called Random Error Method Least Squares.
⯁ LEAST SQUARES ESTIMATION
To minimize the error between predicted and observed values, we use the following formulas:
β₁ = /
β₀ = ȳ - β₁x̄
Where:
∑ = sum
x̄ = mean of x
ȳ = mean of y
x_i, y_i = individual values of the variables.
Where:
x_i and y_i are the means of the independent and dependent variables, respectively.
i ranges from 1 to n, the number of observations.
These equations guarantee the best linear unbiased estimator, according to the Gauss-Markov theorem, assuming homoscedasticity and linearity.
⯁ LINEAR REGRESSION IN MACHINE LEARNING
Linear regression is one of the cornerstones of supervised learning. Its simplicity and ability to generate accurate quantitative predictions make it essential in AI systems, predictive algorithms, time series analysis, and automated trading strategies.
By applying this model to the RSI, you are literally putting artificial intelligence at the heart of a classic indicator, bringing a new dimension to technical analysis.
⯁ VISUAL INTERPRETATION
Imagine an RSI time series like this:
Time →
RSI →
The regression line will smooth these values and extend them n periods into the future, creating a predicted trajectory based on the historical moment. This line becomes the predicted RSI, which can be crossed with the actual RSI to generate more intelligent signals.
⯁ SUMMARY OF SCIENTIFIC CONCEPTS USED
Linear Regression Models the relationship between variables using a straight line.
Least Squares Minimizes the sum of squared errors between prediction and reality.
Time Series Forecasting Estimates future values based on historical data.
Supervised Learning Trains models to predict outputs from known inputs.
Statistical Smoothing Reduces noise and reveals underlying trends.
⯁ WHY THIS INDICATOR IS REVOLUTIONARY
Scientifically-based: Based on statistical theory and mathematical inference.
Unprecedented: First public RSI with least squares predictive modeling.
Intelligent: Built with machine learning logic.
Practical: Generates forward-thinking signals.
Customizable: Flexible for any trading strategy.
⯁ CONCLUSION
By combining RSI with linear regression, this indicator allows a trader to predict market momentum, not just follow it.
RSI Forecast is not just an indicator — it is a scientific breakthrough in technical analysis technology.
⯁ Example of simple linear regression, which has one independent variable:
⯁ In linear regression, observations ( red ) are considered to be the result of random deviations ( green ) from an underlying relationship ( blue ) between a dependent variable ( y ) and an independent variable ( x ).
⯁ Visualizing heteroscedasticity in a scatterplot against 100 random fitted values using Matlab:
⯁ The data sets in the Anscombe's quartet are designed to have approximately the same linear regression line (as well as nearly identical means, standard deviations, and correlations) but are graphically very different. This illustrates the pitfalls of relying solely on a fitted model to understand the relationship between variables.
⯁ The result of fitting a set of data points with a quadratic function:
_______________________________________________________________________
🥇 This is the world’s first RSI indicator with: Linear Regression for Forecasting 🥇_______________________________________________________________________
_________________________________________________
🔮 Linear Regression: PineScript Technical Parameters 🔮
_________________________________________________
Forecast Types:
• Flat: Assumes prices will remain the same.
• Linreg: Makes a 'Linear Regression' forecast for n periods.
Technical Information:
ta.linreg (built-in function)
Linear regression curve. A line that best fits the specified prices over a user-defined time period. It is calculated using the least squares method. The result of this function is calculated using the formula: linreg = intercept + slope * (length - 1 - offset), where intercept and slope are the values calculated using the least squares method on the source series.
Syntax:
• Function: ta.linreg()
Parameters:
• source: Source price series.
• length: Number of bars (period).
• offset: Offset.
• return: Linear regression curve.
This function has been cleverly applied to the RSI, making it capable of projecting future values based on past statistical trends.
______________________________________________________
______________________________________________________
⯁ WHAT IS THE RSI❓
The Relative Strength Index (RSI) is a technical analysis indicator developed by J. Welles Wilder. It measures the magnitude of recent price movements to evaluate overbought or oversold conditions in a market. The RSI is an oscillator that ranges from 0 to 100 and is commonly used to identify potential reversal points, as well as the strength of a trend.
⯁ HOW TO USE THE RSI❓
The RSI is calculated based on average gains and losses over a specified period (usually 14 periods). It is plotted on a scale from 0 to 100 and includes three main zones:
• Overbought: When the RSI is above 70, indicating that the asset may be overbought.
• Oversold: When the RSI is below 30, indicating that the asset may be oversold.
• Neutral Zone: Between 30 and 70, where there is no clear signal of overbought or oversold conditions.
______________________________________________________
______________________________________________________
⯁ ENTRY CONDITIONS
The conditions below are fully flexible and allow for complete customization of the signal.
______________________________________________________
______________________________________________________
🔹 CONDITIONS TO BUY 📈
______________________________________________________
• Signal Validity: The signal will remain valid for X bars .
• Signal Sequence: Configurable as AND or OR .
📈 RSI Conditions:
🔹 RSI > Upper
🔹 RSI < Upper
🔹 RSI > Lower
🔹 RSI < Lower
🔹 RSI > Middle
🔹 RSI < Middle
🔹 RSI > MA
🔹 RSI < MA
📈 MA Conditions:
🔹 MA > Upper
🔹 MA < Upper
🔹 MA > Lower
🔹 MA < Lower
📈 Crossovers:
🔹 RSI (Crossover) Upper
🔹 RSI (Crossunder) Upper
🔹 RSI (Crossover) Lower
🔹 RSI (Crossunder) Lower
🔹 RSI (Crossover) Middle
🔹 RSI (Crossunder) Middle
🔹 RSI (Crossover) MA
🔹 RSI (Crossunder) MA
🔹 MA (Crossover) Upper
🔹 MA (Crossunder) Upper
🔹 MA (Crossover) Lower
🔹 MA (Crossunder) Lower
📈 RSI Divergences:
🔹 RSI Divergence Bull
🔹 RSI Divergence Bear
📈 RSI Forecast:
🔮 RSI (Crossover) MA Forecast
🔮 RSI (Crossunder) MA Forecast
______________________________________________________
______________________________________________________
🔸 CONDITIONS TO SELL 📉
______________________________________________________
• Signal Validity: The signal will remain valid for X bars .
• Signal Sequence: Configurable as AND or OR .
📉 RSI Conditions:
🔸 RSI > Upper
🔸 RSI < Upper
🔸 RSI > Lower
🔸 RSI < Lower
🔸 RSI > Middle
🔸 RSI < Middle
🔸 RSI > MA
🔸 RSI < MA
📉 MA Conditions:
🔸 MA > Upper
🔸 MA < Upper
🔸 MA > Lower
🔸 MA < Lower
📉 Crossovers:
🔸 RSI (Crossover) Upper
🔸 RSI (Crossunder) Upper
🔸 RSI (Crossover) Lower
🔸 RSI (Crossunder) Lower
🔸 RSI (Crossover) Middle
🔸 RSI (Crossunder) Middle
🔸 RSI (Crossover) MA
🔸 RSI (Crossunder) MA
🔸 MA (Crossover) Upper
🔸 MA (Crossunder) Upper
🔸 MA (Crossover) Lower
🔸 MA (Crossunder) Lower
📉 RSI Divergences:
🔸 RSI Divergence Bull
🔸 RSI Divergence Bear
📉 RSI Forecast:
🔮 RSI (Crossover) MA Forecast
🔮 RSI (Crossunder) MA Forecast
______________________________________________________
______________________________________________________
🤖 AUTOMATION 🤖
• You can automate the BUY and SELL signals of this indicator.
______________________________________________________
______________________________________________________
⯁ UNIQUE FEATURES
______________________________________________________
Linear Regression: (Forecast)
Signal Validity: The signal will remain valid for X bars
Signal Sequence: Configurable as AND/OR
Condition Table: BUY/SELL
Condition Labels: BUY/SELL
Plot Labels in the Graph Above: BUY/SELL
Automate and Monitor Signals/Alerts: BUY/SELL
Linear Regression (Forecast)
Signal Validity: The signal will remain valid for X bars
Signal Sequence: Configurable as AND/OR
Condition Table: BUY/SELL
Condition Labels: BUY/SELL
Plot Labels in the Graph Above: BUY/SELL
Automate and Monitor Signals/Alerts: BUY/SELL
______________________________________________________
📜 SCRIPT : RSI Forecast
🎴 Art by : @Titans_Invest & @DiFlip
👨💻 Dev by : @Titans_Invest & @DiFlip
🎑 Titans Invest — The Wizards Without Gloves 🧤
✨ Enjoy!
______________________________________________________
o Mission 🗺
• Inspire Traders to manifest Magic in the Market.
o Vision 𐓏
• To elevate collective Energy 𐓷𐓏

EMA 9/21/50 + VWAP + MACD + RSI Pro [v6]Overview:
A powerful multi-indicator tool combining Exponential Moving Averages (EMA 9, 21, 50), Volume-Weighted Average Price (VWAP), Moving Average Convergence Divergence (MACD), and Relative Strength Index (RSI) into a single, easy-to-read system. Designed for traders who want a clean, all-in-one dashboard for trend analysis, momentum confirmation, and overbought/oversold conditions.
Key Features:
1. Triple EMA System (9, 21, 50)
Identifies short-term and medium-term trends.
Bullish Signal: EMA 9 > EMA 21 > EMA 50 (Green Highlight)
Bearish Signal: EMA 9 < EMA 21 < EMA 50 (Red Highlight)
Helps confirm trend direction and potential reversals.
2. VWAP (Volume-Weighted Average Price)
Tracks intraday fair value price based on volume.
Bullish: Price above VWAP (Green)
Bearish: Price below VWAP (Red)
3. MACD (Standard 12, 26, 9 Settings)
Shows momentum shifts.
Bullish: MACD line > Signal line (Green)
Bearish: MACD line < Signal line (Red)
Histogram confirms strength of momentum.
4. RSI (14-Period Default)
Identifies overbought (>70) and oversold (<30) conditions.
Red: Overbought (Potential Reversal)
Green: Oversold (Potential Bounce)
5. Signal Dashboard (Top-Right Table)
Real-time summary of all indicators in one place.
Color-coded for quick interpretation (Green = Bullish, Red = Bearish).
How to Use This Indicator?
✅ Trend Confirmation:
Trade in the direction of EMA alignment (9 > 21 > 50 for uptrends).
Use VWAP as dynamic support/resistance.
✅ Momentum Entries:
Look for MACD crossovers while RSI is not extreme.
Avoid buying when RSI > 70 or selling when RSI < 30 (unless strong trend).
✅ Mean Reversion:
Fade extreme RSI readings (overbought/oversold) when price is at key levels.
Who Is This For?
✔ Swing Traders – EMA + MACD combo for trend-following.
✔ Day Traders – VWAP + EMA for intraday bias.
✔ RSI Traders – Clear overbought/oversold signals.
Settings Customization:
Adjust EMA lengths, RSI periods, and MACD settings as needed.
Toggle VWAP visibility on/off.
Why Use This Script?
📌 All-in-One: No need for multiple indicators cluttering your chart.
📌 Visual Clarity: Color-coded signals for quick decision-making.
📌 Flexible: Works on any timeframe (1M, 5M, 1H, Daily, etc.).
Install now and enhance your trading strategy with a professional-grade multi-indicator system!
Not a financial advice. Use at your own discretion and always apply risk management

Machine Learning RSI ║ BullVisionOverview:
Introducing the Machine Learning RSI with KNN Adaptation – a cutting-edge momentum indicator that blends the classic Relative Strength Index (RSI) with machine learning principles. By leveraging K-Nearest Neighbors (KNN), this indicator aims at identifying historical patterns that resemble current market behavior and uses this context to refine RSI readings with enhanced sensitivity and responsiveness.
Unlike traditional RSI models, which treat every market environment the same, this version adapts in real-time based on how similar past conditions evolved, offering an analytical edge without relying on predictive assumptions.
Key Features:
🔁 KNN-Based RSI Refinement
This indicator uses a machine learning algorithm (K-Nearest Neighbors) to compare current RSI and price action characteristics to similar historical conditions. The resulting RSI is weighted accordingly, producing a dynamically adjusted value that reflects historical context.
📈 Multi-Feature Similarity Analysis
Pattern similarity is calculated using up to five customizable features:
RSI level
RSI momentum
Volatility
Linear regression slope
Price momentum
Users can adjust how many features are used to tailor the behavior of the KNN logic.
🧠 Machine Learning Weight Control
The influence of the machine learning model on the final RSI output can be fine-tuned using a simple slider. This lets you blend traditional RSI and machine learning-enhanced RSI to suit your preferred level of adaptation.
🎛️ Adaptive Filtering
Additional smoothing options (Kalman Filter, ALMA, Double EMA) can be applied to the RSI, offering better visual clarity and helping to reduce noise in high-frequency environments.
🎨 Visual & Accessibility Settings
Custom color palettes, including support for color vision deficiencies, ensure that trend coloring remains readable for all users. A built-in neon mode adds high-contrast visuals to improve RSI visibility across dark or light themes.
How It Works:
Similarity Matching with KNN:
At each candle, the current RSI and optional market characteristics are compared to historical bars using a KNN search. The algorithm selects the closest matches and averages their RSI values, weighted by similarity. The more similar the pattern, the greater its influence.
Feature-Based Weighting:
Similarity is determined using normalized values of the selected features, which gives a more refined result than RSI alone. You can choose to use only 1 (RSI) or up to all 5 features for deeper analysis.
Filtering & Blending:
After the machine learning-enhanced RSI is calculated, it can be optionally smoothed using advanced filters to suppress short-term noise or sharp spikes. This makes it easier to evaluate RSI signals in different volatility regimes.
Parameters Explained:
📊 RSI Settings:
Set the base RSI length and select your preferred smoothing method from 10+ moving average types (e.g., EMA, ALMA, TEMA).
🧠 Machine Learning Controls:
Enable or disable the KNN engine
Select how many nearest neighbors to compare (K)
Choose the number of features used in similarity detection
Control how much the machine learning engine affects the RSI calculation
🔍 Filtering Options:
Enable one of several advanced smoothing techniques (Kalman Filter, ALMA, Double EMA) to adjust the indicator’s reactivity and stability.
📏 Threshold Levels:
Define static overbought/oversold boundaries or reference dynamically adjusted thresholds based on historical context identified by the KNN algorithm.
🎨 Visual Enhancements:
Select between trend-following or impulse coloring styles. Customize color palettes to accommodate different types of color blindness. Enable neon-style effects for visual clarity.
Use Cases:
Swing & Trend Traders
Can use the indicator to explore how current RSI readings compare to similar market phases, helping to assess trend strength or potential turning points.
Intraday Traders
Benefit from adjustable filters and fast-reacting smoothing to reduce noise in shorter timeframes while retaining contextual relevance.
Discretionary Analysts
Use the adaptive OB/OS thresholds and visual cues to supplement broader confluence zones or market structure analysis.
Customization Tips:
Higher Volatility Periods: Use more neighbors and enable filtering to reduce noise.
Lower Volatility Markets: Use fewer features and disable filtering for quicker RSI adaptation.
Deeper Contextual Analysis: Increase KNN lookback and raise the feature count to refine pattern recognition.
Accessibility Needs: Switch to Deuteranopia or Monochrome mode for clearer visuals in specific color vision conditions.
Final Thoughts:
The Machine Learning RSI combines familiar momentum logic with statistical context derived from historical similarity analysis. It does not attempt to predict price action but rather contextualizes RSI behavior with added nuance. This makes it a valuable tool for those looking to elevate traditional RSI workflows with adaptive, research-driven enhancements.

Trading-Focused RSI with Quality SignalsOverview
Transforms the classic Relative Strength Index into a comprehensive trading system that delivers clear, high-quality signals. Unlike basic RSI indicators that leave interpretation to the trader, TraderRSI filters out noise and highlights only the most promising trading opportunities.
Key Features
Signal Quality Over Quantity
Smart Divergence Detection that identifies only significant, tradable divergences (not every minor oscillation)
Automated Signal Confirmation requiring persistence for multiple bars to eliminate false signals
Clear BUY/SELL Labels appear only on high-probability setups where multiple conditions align
Enhanced Visualization
Color-Coded RSI Line instantly communicates bullish/bearish momentum
Signal Line Crossovers to confirm trend changes early
Trend-Based Background Coloring providing immediate market context
Uncluttered Chart designed specifically for day traders and swing traders
Integrated Market Context
Optional Trend Filter using a 50-period moving average for directional bias
Overbought/Oversold Zones with subtle background highlighting
Divergence Strength Filtering ensures only meaningful divergences are displayed
Trading Applications
For Day Traders
Find precise entry and exit points with clear visual signals. Divergence signals combined with RSI crossovers provide powerful intraday setups.
For Swing Traders
The quality-focused signal system identifies only high-probability trend reversals, perfect for multi-day positions. Background coloring provides immediate trend context.
For Investors
Easily identify overbought or oversold conditions in your watchlist. The trend filter helps distinguish between temporary pullbacks and major reversals.
How to Use
Strong Buy Signal: When a green "BUY" label appears, RSI has crossed above the oversold level with bullish divergence confirmation and (optional) trend alignment
Strong Sell Signal: When a red "SELL" label appears, RSI has crossed below the overbought level with bearish divergence confirmation and (optional) trend alignment
Alert System: Set alerts on any of the eight customizable conditions to never miss a quality trade setup

Hamid Double RSIRSI with Moving Average and Another RSI
This script combines two Relative Strength Index (RSI) indicators with configurable moving averages. It allows traders to track momentum and market strength with adjustable periods for both the RSI and moving averages. The script also allows you to choose different data sources for each RSI, offering flexibility in analysis.
Features:
Two RSIs: One with a shorter period and another with a longer period .
Moving Averages: Each RSI has its own configurable moving average . The moving averages help smooth out the RSI and provide clearer trends.
Customizable Inputs: Adjust the RSI period and the length of the moving averages. You can also choose different sources for each RSI (e.g., close, open, high, low).
Mid Line: A horizontal line at 50, which is commonly used as the neutral level for the RSI. It helps identify whether the RSI is above or below neutral, indicating bullish or bearish conditions.
Overbought and Oversold Levels: Horizontal lines at 70 (overbought) and 30 (oversold) to highlight when the asset might be overbought or oversold according to the RSI.
How it works:
RSI Calculation: The script calculates two RSIs using different lengths
Moving Averages: A Simple Moving Average (SMA) is applied to both RSIs to smooth their values and help identify trends.
Overbought/Oversold Indicators: The script includes horizontal lines at 70 and 30 to show overbought and oversold conditions. The mid line is plotted at 50 to highlight neutral levels.
This indicator is useful for traders who want to compare the behavior of two RSIs over different time periods and use the moving averages to filter out noise. The ability to customize the source data for each RSI makes this script adaptable to different trading strategies.

IDX - 5UPThe UDX-5UP is a custom indicator designed to assist traders in identifying trends, entry and exit signals, and market reversal moments with greater accuracy. It combines price analysis, volume, and momentum (RSI) to provide clear buy ("Buy") and sell ("Sell") signals across any asset and timeframe, whether you're a scalper on the 5M chart or a swing trader on the 4H chart. Inspired by robust technical analysis strategies, the UDX-5UP is ideal for traders seeking a reliable tool to operate in volatile markets such as cryptocurrencies, forex, stocks, and futures.
Components of the UDX-5UP
The UDX-5UP consists of three main panels that work together to provide a comprehensive view of the market:
Main Panel (Price):
Pivot Supertrend: A dynamic line that changes color to indicate the trend. Green for an uptrend (look for buys), red for a downtrend (look for sells).
SMAs (Simple Moving Averages): Two SMAs (8 and 21 periods) to confirm the trend direction. When the SMA 8 crosses above the SMA 21, it’s a bullish signal; when it crosses below, it’s a bearish signal.
Entry/Exit Signals: "Buy" (green) and "Sell" (red) labels are plotted on the chart when entry or exit conditions are met.
Volume Panel:
Colored Volume Bars: Green bars indicate dominant buying volume, while red bars indicate dominant selling volume.
Volume Moving Average (MA 20): A blue line that helps identify whether the current volume is above or below the average, confirming the strength of the movement.
RSI Panel:
RSI (Relative Strength Index): Calculated with a period of 14, with overbought (70) and oversold (30) lines to identify momentum extremes.
Divergences: The indicator detects divergences between the RSI and price, plotting signals for potential reversals.
How the UDX-5UP Works
The UDX-5UP uses a combination of rules to generate buy and sell signals:
Buy Signal ("Buy"):
The Pivot Supertrend changes from red to green.
The SMA 8 crosses above the SMA 21.
The volume is above the MA 20, with green bars (indicating buying pressure).
The RSI is rising and, ideally, below 70 (not overbought).
Example: On the 4H chart, the price of Tether (USDT) is at 0.05515. The Pivot Supertrend turns green, the SMA 8 crosses above the SMA 21, the volume shows green bars above the MA 20, and the RSI is at 46. The UDX-5UP plots a "Buy".
Sell Signal ("Sell"):
The Pivot Supertrend changes from green to red.
The SMA 8 crosses below the SMA 21.
The volume is above the MA 20, with red bars (indicating selling pressure).
The RSI is falling and, ideally, above 70 (overbought).
Example: On the 4H chart, the price of Tether rises to 0.05817. The Pivot Supertrend turns red, the SMA 8 crosses below the SMA 21, the volume shows red bars, and the RSI is above 70. The UDX-5UP plots a "Sell".
RSI Divergences:
The indicator identifies bullish divergences (price makes a lower low, but RSI makes a higher low) and bearish divergences (price makes a higher high, but RSI makes a lower high), plotting alerts for potential reversals.
Adjustable Settings
The UDX-5UP is highly customizable to suit your trading style:
Pivot Supertrend Period: Default is 2. Increase to 3 or 4 for more conservative signals (fewer false positives, but more lag).
SMA Periods: Default is 8 and 21. Adjust to 5 and 13 for smaller timeframes (e.g., 5M) or 13 and 34 for larger timeframes (e.g., 1D).
RSI Period: Default is 14. Reduce to 10 for greater sensitivity or increase to 20 for smoother signals.
Overbought/Oversold Levels: Default is 70/30. Adjust to 80/20 in volatile markets.
Display Panels: You can enable/disable the volume and RSI panels to simplify the chart.
How to Use the UDX-5UP
Identify the Trend:
Use the Pivot Supertrend and SMAs to determine the market direction. Uptrend: look for buys. Downtrend: look for sells.
Confirm with Volume and RSI:
For buys: Volume above the MA 20 with green bars, RSI rising and below 70.
For sells: Volume above the MA 20 with red bars, RSI falling and above 70.
Enter the Trade:
Enter a buy when the UDX-5UP plots a "Buy" and all conditions are aligned.
Enter a sell when the UDX-5UP plots a "Sell" and all conditions are aligned.
Plan the Exit:
Use Fibonacci levels or support/resistance on the price chart to set targets.
Exit the trade when the UDX-5UP plots an opposite signal ("Sell" after a buy, "Buy" after a sell).
Tips for Beginners
Start with Larger Timeframes: Use the 4H or 1D chart for more reliable signals and less noise.
Combine with Other Indicators: Use the UDX-5UP with tools like Fibonacci or the Candles RSI (another powerful indicator) to confirm signals.
Practice in Demo Mode: Test the indicator in a demo account before using real money.
Manage Risk: Always use a stop-loss and don’t risk more than 1-2% of your capital per trade.
Why Use the UDX-5UP?
Simplicity: Clear "Buy" and "Sell" signals make trading accessible even for beginners.
Versatility: Works on any asset (crypto, forex, stocks) and timeframe.
Multiple Confirmations: Combines price, volume, and momentum to reduce false signals.
Customizable: Adjust the settings to match your trading style.
Author’s Notes
The UDX-5UP was developed based on years of trading and technical analysis experience. It is an evolution of tested strategies, designed to help traders navigate volatile markets with confidence. However, no indicator is infallible. Always combine the UDX-5UP with proper risk management and fundamental analysis, especially in unpredictable markets. Feedback is welcome – leave a comment or reach out with suggestions for improvements!

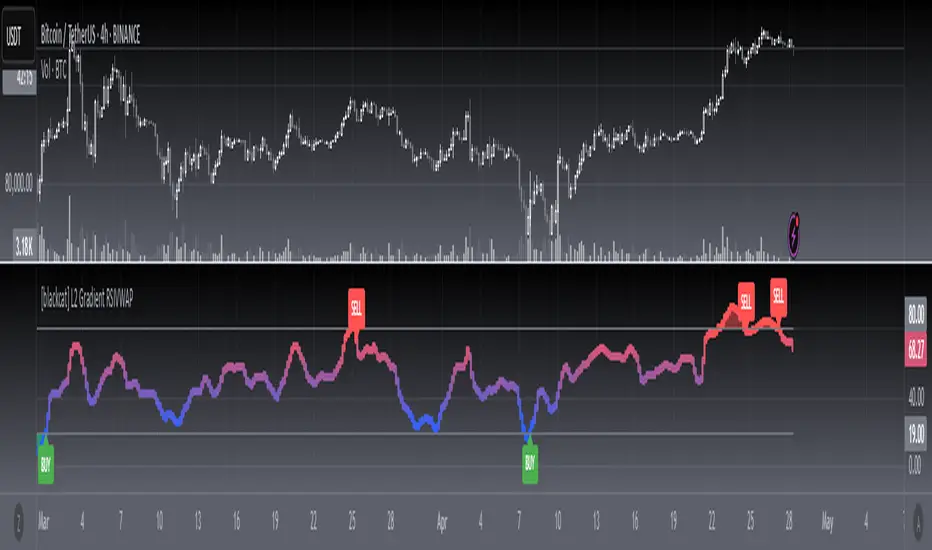
[blackcat] L2 Gradient RSIVWAPOVERVIEW
The L2 Gradient RSIVWAP indicator offers traders a powerful tool for assessing market conditions by combining Relative Strength Index (RSI) with Volume Weighted Average Price (VWAP). It features dynamic coloring and clear buy/sell signals to enhance decision-making.
Customizable Inputs: Adjust key parameters such as RSI-VWAP length, oversold/overbought levels, and smoothing period.
Gradient Color Visualization: Provides intuitive gradient coloring to represent RSI-VWAP values.
Buy/Sell Indicators: On-chart labels highlight potential buying and selling opportunities.
Transparent Fills: Visually distinguishes overbought and oversold zones without obscuring other data.
Access the TradingView platform and select the chart where you wish to implement the indicator.
Go to “Indicators” in the toolbar and search for “ L2 Gradient RSIVWAP.”
Click “Add to Chart” to integrate the indicator into your chart.
Customize settings via the input options:
Toggle between standard RSI and RSI-based VWAP.
Set preferred lengths and thresholds for RSI-VWAP calculations.
Configure the smoothing period for ALMA.
Performance can vary based on asset characteristics like liquidity and volatility.
Historical backtests do not predict future market behavior accurately.
The ALMA function, developed by Arnaud Legoux, enhances response times relative to simple moving averages.
Buy and sell signals are derived from RSI-VWAP crossovers; consider additional factors before making trades.
Special thanks to Arnaud Legoux for creating the ALMA function.
Composite Reversal IndicatorOverview
The "Composite Reversal Indicator" aggregates five technical signals to produce a composite score that ranges from -5 (strongly bearish) to +5 (strongly bullish). These signals come from:
Relative Strength Index (RSI)
Moving Average Convergence Divergence (MACD)
Accumulation/Distribution (A/D)
Volume relative to its moving average
Price proximity to support and resistance levels
Each signal contributes a value of +1 (bullish), -1 (bearish), or 0 (neutral) to the total score. The raw score is plotted as a histogram, and a smoothed version is plotted as a colored line to highlight trends.
Step-by-Step Explanation
1. Customizable Inputs
The indicator starts with user-defined inputs that allow traders to tweak its settings. These inputs include:
RSI: Length (e.g., 14), oversold level (e.g., 30), and overbought level (e.g., 70).
MACD: Fast length (e.g., 12), slow length (e.g., 26), and signal length (e.g., 9).
Volume: Moving average length (e.g., 20) and multipliers for high (e.g., 1.5) and low (e.g., 0.5) volume thresholds.
Price Levels: Period for support and resistance (e.g., 50) and proximity percentage (e.g., 2%).
Score Smoothing: Length for smoothing the score (e.g., 5).
These inputs make the indicator adaptable to different trading styles, assets, or timeframes.
2. Indicator Calculations
The script calculates five key indicators using the input parameters:
RSI: Measures momentum and identifies overbought or oversold conditions.
Formula: rsi = ta.rsi(close, rsi_length)
Example: With a length of 14, it analyzes the past 14 bars of closing prices.
MACD: Tracks trend and momentum using two exponential moving averages (EMAs).
Formula: = ta.macd(close, macd_fast, macd_slow, macd_signal)
Components: MACD line (fast EMA - slow EMA), signal line (EMA of MACD line).
Accumulation/Distribution (A/D): A volume-based indicator showing buying or selling pressure.
Formula: ad = ta.accdist
Reflects cumulative flow based on price and volume.
Volume Moving Average: A simple moving average (SMA) of trading volume.
Formula: vol_ma = ta.sma(volume, vol_ma_length)
Example: A 20-bar SMA smooths volume data.
Support and Resistance Levels: Key price levels based on historical lows and highs.
Formulas:
support = ta.lowest(low, price_level_period)
resistance = ta.highest(high, price_level_period)
Example: Over 50 bars, it finds the lowest low and highest high.
These calculations provide the raw data for generating signals.
3. Signal Generation
Each indicator produces a signal based on specific conditions:
RSI Signal:
+1: RSI < oversold level (e.g., < 30) → potential bullish reversal.
-1: RSI > overbought level (e.g., > 70) → potential bearish reversal.
0: Otherwise.
Logic: Extreme RSI values suggest price may reverse.
MACD Signal:
+1: MACD line > signal line → bullish momentum.
-1: MACD line < signal line → bearish momentum.
0: Equal.
Logic: Crossovers indicate trend shifts.
A/D Signal:
+1: Current A/D > previous A/D → accumulation (bullish).
-1: Current A/D < previous A/D → distribution (bearish).
0: Unchanged.
Logic: Rising A/D shows buying pressure.
Volume Signal:
+1: Volume > high threshold (e.g., 1.5 × volume MA) → strong activity (bullish).
-1: Volume < low threshold (e.g., 0.5 × volume MA) → weak activity (bearish).
0: Otherwise.
Logic: Volume spikes often confirm reversals.
Price Signal:
+1: Close near support (within proximity %, e.g., 2%) → potential bounce.
-1: Close near resistance (within proximity %) → potential rejection.
0: Otherwise.
Logic: Price near key levels signals reversal zones.
4. Composite Score
The raw composite score is the sum of the five signals:
Formula: score = rsi_signal + macd_signal + ad_signal + vol_signal + price_signal
Range: -5 (all signals bearish) to +5 (all signals bullish).
Purpose: Combines multiple perspectives into one number.
5. Smoothed Score
A smoothed version of the score reduces noise:
Formula: score_ma = ta.sma(score, score_ma_length)
Example: With a length of 5, it averages the score over 5 bars.
Purpose: Highlights the trend rather than short-term fluctuations.
6. Visualization
The indicator plots two elements:
Raw Score: A gray histogram showing the composite score per bar.
Style: plot.style_histogram
Color: Gray.
Smoothed Score: A line that changes color:
Green: Score > 0 (bullish).
Red: Score < 0 (bearish).
Gray: Score = 0 (neutral).
Style: plot.style_line, thicker line (e.g., linewidth=2).
These visuals make it easy to spot potential reversals.
How It Works Together
The indicator combines signals from:
RSI: Momentum extremes.
MACD: Trend shifts.
A/D: Buying/selling pressure.
Volume: Confirmation of moves.
Price Levels: Key reversal zones.
By summing these into a composite score, it filters out noise and provides a unified signal. A high positive score (e.g., +3 to +5) suggests a bullish reversal, while a low negative score (e.g., -3 to -5) suggests a bearish reversal. The smoothed score helps traders focus on the trend.
Practical Use
Bullish Reversal: Smoothed score is green and rising → look for buying opportunities.
Bearish Reversal: Smoothed score is red and falling → consider selling or shorting.
Neutral: Score near 0 → wait for clearer signals.
Traders can adjust inputs to suit their strategy, making it versatile for stocks, forex, or crypto.

[blackcat] L3 Composite Trading System with ControlOVERVIEW
This indicator combines three distinct trading strategies into a unified decision-making framework. Utilizing KDJ oscillators, MACD divergence analysis, and adaptive signal filtering techniques, it provides actionable buy/sell signals validated against multi-period momentum trends and structural support/resistance levels.
FEATURES
Integrated KDJ oscillator with weighted moving average smoothing
Dynamic MACD difference visualization normalized against price volatility
Multi-layered confirmation process: • Momentum convergence/divergence tracking
• Candle pattern recognition (Yellow/Fuchsia flags)
• SMAs cross-validation (20/60-day thresholds)
Adaptive risk controls via tunable α parameter adjustment
HOW TO USE
Set Alpha Period parameter matching market cycle characteristics
Monitor primary trend direction via candle coloring (green/red zones)
Confirm directional bias using: ▪️ KDJ-J line position relative to zero axis ▪️ MACD histogram slope persistence (>3 bar validation)
Execute trades only when: • Buy/Sell labels align across both oscillator panels • Coincide with candle flag transitions (e.g., red→yellow) • Validate against concurrent SMA breakout conditions
LIMITATIONS
Lag inherent in EMA-based components during rapid reversals
Requires minimum 60-bar history for full functionality
Sensitive to fractal scaling due to normalization methods
Does not account for liquidity/volume dynamics
NOTES
• Yellow/Fuchsia flags reflect relative strength changes vs prior session
• SMA crossover validations have 16-bar lookback memory retention

Multi-Oscillator Adaptive Kernel | AlphaAlgosMulti-Oscillator Adaptive Kernel | AlphaAlgos
Overview
The Multi-Oscillator Adaptive Kernel (MOAK) is an advanced technical analysis tool that combines multiple oscillators through sophisticated kernel-based smoothing algorithms. This indicator is designed to provide clearer trend signals while filtering out market noise, offering traders a comprehensive view of market momentum across multiple timeframes.
Key Features
• Fusion of multiple technical oscillators (RSI, Stochastic, MFI, CCI)
• Advanced kernel smoothing technology with three distinct mathematical models
• Customizable sensitivity and lookback periods
• Clear visual signals for trend shifts and reversals
• Overbought/oversold zones for precise entry and exit timing
• Adaptive signal that responds to varying market conditions
Technical Components
The MOAK indicator utilizes a multi-layer approach to signal generation:
1. Oscillator Fusion
The core of the indicator combines normalized readings from up to four popular oscillators:
• RSI (Relative Strength Index) - Measures the speed and change of price movements
• Stochastic - Compares the closing price to the price range over a specific period
• MFI (Money Flow Index) - Volume-weighted RSI that includes trading volume
• CCI (Commodity Channel Index) - Measures current price level relative to an average price
2. Kernel Smoothing
The combined oscillator data is processed through one of three kernel functions:
• Exponential Kernel - Provides stronger weighting to recent data with exponential decay
• Linear Kernel - Applies a linear weighting from most recent to oldest data points
• Gaussian Kernel - Uses a bell curve distribution that helps filter out extreme values
3. Dual Signal Lines
• Fast Signal Line - Responds quickly to price changes
• Slow Signal Line - Provides confirmation and shows the underlying trend direction
Configuration Options
Oscillator Selection:
• Enable/disable each oscillator (RSI, Stochastic, MFI, CCI)
• Customize individual lookback periods for each oscillator
Kernel Settings:
• Kernel Type - Choose between Exponential, Linear, or Gaussian mathematical models
• Kernel Length - Adjust the smoothing period (higher values = smoother line)
• Sensitivity - Fine-tune the indicator's responsiveness (higher values = more responsive)
Display Options:
• Color Bars - Toggle price bar coloring based on indicator direction
How to Interpret the Indicator
Signal Line Direction:
• Upward movement (teal) indicates bullish momentum
• Downward movement (magenta) indicates bearish momentum
Trend Shifts:
• Small circles mark the beginning of new uptrends
• X-marks indicate the start of new downtrends
Overbought/Oversold Conditions:
• Values above +50 suggest overbought conditions (potential reversal or pullback)
• Values below -50 suggest oversold conditions (potential reversal or bounce)
Trading Strategies
Trend Following:
• Enter long positions when the signal line turns teal and shows an uptrend
• Enter short positions when the signal line turns magenta and shows a downtrend
• Use the slow signal line (area fill) as confirmation of the underlying trend
Counter-Trend Trading:
• Look for divergences between price and the indicator
• Consider profit-taking when the indicator reaches overbought/oversold areas
• Wait for trend shift signals before entering counter-trend positions
Multiple Timeframe Analysis:
• Use the indicator across different timeframes for confirmation
• Higher timeframe signals carry more weight than lower timeframe signals
Best Practices
• Experiment with different kernel types for various market conditions
• Gaussian kernels often work well in ranging markets
• Exponential kernels can provide earlier signals in trending markets
• Combine with volume analysis for higher probability trades
• Use appropriate stop-loss levels as the indicator does not guarantee price movements
This indicator is provided as-is with no guarantees of profit. Always use proper risk management when trading with any technical indicator. Nothing is financial advise.
Smart Liquidity Wave [The_lurker]"Smart Liquidity Wave" هو مؤشر تحليلي متطور يهدف لتحديد نقاط الدخول والخروج المثلى بناءً على تحليل السيولة، قوة الاتجاه، وإشارات السوق المفلترة. يتميز المؤشر بقدرته على تصنيف الأدوات المالية إلى أربع فئات سيولة (ضعيفة، متوسطة، عالية، عالية جدًا)، مع تطبيق شروط مخصصة لكل فئة تعتمد على تحليل الموجات السعرية، الفلاتر المتعددة، ومؤشر ADX.
فكرة المؤشر
الفكرة الأساسية هي الجمع بين قياس السيولة اليومية الثابتة وتحليل ديناميكي للسعر باستخدام فلاتر متقدمة لتوليد إشارات دقيقة. المؤشر يركز على تصفية الضوضاء في السوق من خلال طبقات متعددة من التحليل، مما يجعله أداة ذكية تتكيف مع الأدوات المالية المختلفة بناءً على مستوى سيولتها.
طريقة عمل المؤشر
1- قياس السيولة:
يتم حساب السيولة باستخدام متوسط حجم التداول على مدى 14 يومًا مضروبًا في سعر الإغلاق، ويتم ذلك دائمًا على الإطار الزمني اليومي لضمان ثبات القيمة بغض النظر عن الإطار الزمني المستخدم في الرسم البياني.
يتم تصنيف السيولة إلى:
ضعيفة: أقل من 5 ملايين (قابل للتعديل).
متوسطة: من 5 إلى 20 مليون.
عالية: من 20 إلى 50 مليون.
عالية جدًا: أكثر من 50 مليون.
هذا الثبات في القياس يضمن أن تصنيف السيولة لا يتغير مع تغير الإطار الزمني، مما يوفر أساسًا موثوقًا للإشارات.
2- تحليل الموجات السعرية:
يعتمد المؤشر على تحليل الموجات باستخدام متوسطات متحركة متعددة الأنواع (مثل SMA، EMA، WMA، HMA، وغيرها) يمكن للمستخدم اختيارها وتخصيص فتراتها ، يتم دمج هذا التحليل مع مؤشرات إضافية مثل RSI (مؤشر القوة النسبية) وMFI (مؤشر تدفق الأموال) بوزن محدد (40% للموجات، 30% لكل من RSI وMFI) للحصول على تقييم شامل للاتجاه.
3- الفلاتر وطريقة عملها:
المؤشر يستخدم نظام فلاتر متعدد الطبقات لتصفية الإشارات وتقليل الضوضاء، وهي من أبرز الجوانب المخفية التي تعزز دقته:
الفلتر الرئيسي (Main Filter):
يعمل على تنعيم التغيرات السعرية السريعة باستخدام معادلة رياضية تعتمد على تحليل الإشارات (Signal Processing).
يتم تطبيقه على السعر لاستخراج الاتجاهات الأساسية بعيدًا عن التقلبات العشوائية، مع فترة زمنية قابلة للتعديل (افتراضي: 30).
يستخدم تقنية مشابهة للفلاتر عالية التردد (High-Pass Filter) للتركيز على الحركات الكبيرة.
الفلتر الفرعي (Sub Filter):
يعمل كطبقة ثانية للتصفية، مع فترة أقصر (افتراضي: 12)، لضبط الإشارات بدقة أكبر.
يستخدم معادلات تعتمد على الترددات المنخفضة للتأكد من أن الإشارات الناتجة تعكس تغيرات حقيقية وليست مجرد ضوضاء.
إشارة الزناد (Signal Trigger):
يتم تطبيق متوسط متحرك على نتائج الفلتر الرئيسي لتوليد خط إشارة (Signal Line) يُقارن مع عتبات محددة للدخول والخروج.
يمكن تعديل فترة الزناد (افتراضي: 3 للدخول، 5 للخروج) لتسريع أو تبطيء الإشارات.
الفلتر المربع (Square Filter):
خاصية مخفية تُفعّل افتراضيًا تعزز دقة الفلاتر عن طريق تضييق نطاق التذبذبات المسموح بها، مما يقلل من الإشارات العشوائية في الأسواق المتقلبة.
4- تصفية الإشارات باستخدام ADX:
يتم استخدام مؤشر ADX كفلتر نهائي للتأكد من قوة الاتجاه قبل إصدار الإشارة:
ضعيفة ومتوسطة: دخول عندما يكون ADX فوق 40، خروج فوق 50.
عالية: دخول فوق 40، خروج فوق 55.
عالية جدًا: دخول فوق 35، خروج فوق 38.
هذه العتبات قابلة للتعديل، مما يسمح بتكييف المؤشر مع استراتيجيات مختلفة.
5- توليد الإشارات:
الدخول: يتم إصدار إشارة شراء عندما تنخفض خطوط الإشارة إلى ما دون عتبة محددة (مثل -9) مع تحقق شروط الفلاتر، السيولة، وADX.
الخروج: يتم إصدار إشارة بيع عندما ترتفع الخطوط فوق عتبة (مثل 109 أو 106 حسب الفئة) مع تحقق الشروط الأخرى.
تُعرض الإشارات بألوان مميزة (أزرق للدخول، برتقالي للضعيفة والمتوسطة، أحمر للعالية والعالية جدًا) وبثلاثة أحجام (صغير، متوسط، كبير).
6- عرض النتائج:
يظهر مستوى السيولة الحالي في جدول في أعلى يمين الرسم البياني، مما يتيح للمستخدم معرفة فئة الأصل بسهولة.
7- دعم التنبيهات:
تنبيهات فورية لكل فئة سيولة، مما يسهل التداول الآلي أو اليدوي.
%%%%% الجوانب المخفية في الكود %%%%%
معادلات الفلاتر المتقدمة: يستخدم المؤشر معادلات رياضية معقدة مستوحاة من معالجة الإشارات لتنعيم البيانات واستخراج الاتجاهات، مما يجعله أكثر دقة من المؤشرات التقليدية.
التكيف التلقائي: النظام يضبط نفسه داخليًا بناءً على التغيرات في السعر والحجم، مع عوامل تصحيح مخفية (مثل معامل التنعيم في الفلاتر) للحفاظ على الاستقرار.
التوزيع الموزون: الدمج بين الموجات، RSI، وMFI يتم بأوزان محددة (40%، 30%، 30%) لضمان توازن التحليل، وهي تفاصيل غير ظاهرة مباشرة للمستخدم لكنها تؤثر على النتائج.
الفلتر المربع: خيار مخفي يتم تفعيله افتراضيًا لتضييق نطاق الإشارات، مما يقلل من التشتت في الأسواق ذات التقلبات العالية.
مميزات المؤشر
1- فلاتر متعددة الطبقات: تضمن تصفية الضوضاء وإنتاج إشارات موثوقة فقط.
2- ثبات السيولة: قياس السيولة اليومي يجعل التصنيف متسقًا عبر الإطارات الزمنية.
3- تخصيص شامل: يمكن تعديل حدود السيولة، عتبات ADX، فترات الفلاتر، وأنواع المتوسطات المتحركة.
4- إشارات مرئية واضحة: تصميم بصري يسهل التفسير مع تنبيهات فورية.
5- تقليل الإشارات الخاطئة: الجمع بين الفلاتر وADX يعزز الدقة ويقلل من التشتت.
إخلاء المسؤولية
لا يُقصد بالمعلومات والمنشورات أن تكون، أو تشكل، أي نصيحة مالية أو استثمارية أو تجارية أو أنواع أخرى من النصائح أو التوصيات المقدمة أو المعتمدة من TradingView.
#### **What is the Smart Liquidity Wave Indicator?**
"Smart Liquidity Wave" is an advanced analytical indicator designed to identify optimal entry and exit points based on liquidity analysis, trend strength, and filtered market signals. It stands out with its ability to categorize financial instruments into four liquidity levels (Weak, Medium, High, Very High), applying customized conditions for each category based on price wave analysis, multi-layered filters, and the ADX (Average Directional Index).
#### **Concept of the Indicator**
The core idea is to combine a stable daily liquidity measurement with dynamic price analysis using sophisticated filters to generate precise signals. The indicator focuses on eliminating market noise through multiple analytical layers, making it an intelligent tool that adapts to various financial instruments based on their liquidity levels.
#### **How the Indicator Works**
1. **Liquidity Measurement:**
- Liquidity is calculated using the 14-day average trading volume multiplied by the closing price, always based on the daily timeframe to ensure value consistency regardless of the chart’s timeframe.
- Liquidity is classified as:
- **Weak:** Less than 5 million (adjustable).
- **Medium:** 5 to 20 million.
- **High:** 20 to 50 million.
- **Very High:** Over 50 million.
- This consistency in measurement ensures that liquidity classification remains unchanged across different timeframes, providing a reliable foundation for signals.
2. **Price Wave Analysis:**
- The indicator relies on wave analysis using various types of moving averages (e.g., SMA, EMA, WMA, HMA, etc.), which users can select and customize in terms of periods.
- This analysis is integrated with additional indicators like RSI (Relative Strength Index) and MFI (Money Flow Index), weighted specifically (40% waves, 30% RSI, 30% MFI) to provide a comprehensive trend assessment.
3. **Filters and Their Functionality:**
- The indicator employs a multi-layered filtering system to refine signals and reduce noise, a key hidden feature that enhances its accuracy:
- **Main Filter:**
- Smooths rapid price fluctuations using a mathematical equation rooted in signal processing techniques.
- Applied to price data to extract core trends away from random volatility, with an adjustable period (default: 30).
- Utilizes a technique similar to high-pass filters to focus on significant movements.
- **Sub Filter:**
- Acts as a secondary filtering layer with a shorter period (default: 12) for finer signal tuning.
- Employs low-frequency-based equations to ensure resulting signals reflect genuine changes rather than mere noise.
- **Signal Trigger:**
- Applies a moving average to the main filter’s output to generate a signal line, compared against predefined entry and exit thresholds.
- Trigger period is adjustable (default: 3 for entry, 5 for exit) to speed up or slow down signals.
- **Square Filter:**
- A hidden feature activated by default, enhancing filter precision by narrowing the range of permissible oscillations, reducing random signals in volatile markets.
4. **Signal Filtering with ADX:**
- ADX is used as a final filter to confirm trend strength before issuing signals:
- **Weak and Medium:** Entry when ADX exceeds 40, exit above 50.
- **High:** Entry above 40, exit above 55.
- **Very High:** Entry above 35, exit above 38.
- These thresholds are adjustable, allowing the indicator to adapt to different trading strategies.
5. **Signal Generation:**
- **Entry:** A buy signal is triggered when signal lines drop below a specific threshold (e.g., -9) and conditions for filters, liquidity, and ADX are met.
- **Exit:** A sell signal is issued when signal lines rise above a threshold (e.g., 109 or 106, depending on the category) with all conditions satisfied.
- Signals are displayed in distinct colors (blue for entry, orange for Weak/Medium, red for High/Very High) and three sizes (small, medium, large).
6. **Result Display:**
- The current liquidity level is shown in a table at the top-right of the chart, enabling users to easily identify the asset’s category.
7. **Alert Support:**
- Instant alerts are provided for each liquidity category, facilitating both automated and manual trading.
#### **Hidden Aspects in the Code**
- **Advanced Filter Equations:** The indicator uses complex mathematical formulas inspired by signal processing to smooth data and extract trends, making it more precise than traditional indicators.
- **Automatic Adaptation:** The system internally adjusts based on price and volume changes, with hidden correction factors (e.g., smoothing coefficients in filters) to maintain stability.
- **Weighted Distribution:** The integration of waves, RSI, and MFI uses fixed weights (40%, 30%, 30%) for balanced analysis, a detail not directly visible but impactful on results.
- **Square Filter:** A hidden option, enabled by default, narrows signal range to minimize dispersion in high-volatility markets.
#### **Indicator Features**
1. **Multi-Layered Filters:** Ensures noise reduction and delivers only reliable signals.
2. **Liquidity Stability:** Daily liquidity measurement keeps classification consistent across timeframes.
3. **Comprehensive Customization:** Allows adjustments to liquidity thresholds, ADX levels, filter periods, and moving average types.
4. **Clear Visual Signals:** User-friendly design with easy-to-read visuals and instant alerts.
5. **Reduced False Signals:** Combining filters and ADX enhances accuracy and minimizes clutter.
#### **Disclaimer**
The information and publications are not intended to be, nor do they constitute, financial, investment, trading, or other types of advice or recommendations provided or endorsed by TradingView.

Custom TABI Model with LayersCustom Top and Bottom Indicator (TABI) (Is a Trend Adaptive Blow-Off Indicator) -
User Guide & Description
Introduction
The TABI (Trend Adaptive Blow-Off Indicator) is a refined, multi-layered RSI tool designed to enhance trend analysis, detect momentum shifts, and highlight overbought/oversold conditions with a more nuanced, color-coded approach. This indicator is useful for traders seeking to identify key reversal points, confirm trend strength, and filter trade setups more effectively than traditional RSI.
By incorporating volume-based confirmation and divergence detection, TABI aims to reduce false signals and improve trade timing.
How It Works
TABI builds on the Relative Strength Index (RSI) by introducing:
A smoothed RSI calculation for better trend readability.
11 color-coded RSI levels, allowing traders to visually distinguish weak, neutral, and extreme conditions.
Volume-based confirmation to detect high-conviction moves.
Bearish & Bullish Divergence Detection, inspired by Market Cipher methods, to spot potential reversals early.
Overbought & Oversold alerts, with optional candlestick color changes to highlight trade signals.
Key Features
✅ Color-Coded RSI for Better Readability
The RSI is divided into multi-layered color zones:
🔵 Light Blue: Extremely oversold
🟢 Lime Green: Mild oversold, potential trend reversal
🟡 Yellow & Orange: Neutral, momentum consolidation
🟠 Dark Orange: Caution, overbought conditions developing
🔴 Red: Extreme overbought, possible exhaustion
✅ Divergence Detection
Bearish Divergence: Price makes higher highs, RSI makes lower highs → Potential top signal
Bullish Divergence: Price makes lower lows, RSI makes higher lows → Potential bottom signal
✅ Volume Confirmation Filter
Requires a 50% above-average volume spike for strong buy/sell signals, reducing false breakouts.
✅ Dynamic Labels & Alerts
🚨 Blow-Off Top Warning: If RSI is overbought + volume spikes + divergence detected
🟢 Oversold Bottom Alert: If RSI is oversold + bullish divergence
Candlestick color changes when extreme conditions are met.
How to Use
📌 Entry & Exit Signals
Buy Consideration:
RSI enters Green Zone (oversold)
Bullish divergence detected
Volume confirms the move
Sell Consideration:
RSI enters Red Zone (overbought)
Bearish divergence detected
Volume confirms exhaustion
📌 Trend Confirmation
Use the yellow/orange levels to confirm strong trends before entering counter-trend trades.
📌 Filtering Trade Noise
The RSI smoothing helps reduce false whipsaws, making it easier to read true momentum shifts.
Customization Options
🔧 User-Defined RSI Thresholds
Adjust the overbought/oversold levels to match your trading style.
🔧 Divergence Sensitivity
Modify the lookback period to fine-tune divergence detection accuracy.
🔧 Volume Thresholds
Set custom volume multipliers to control confirmation requirements.
Why This is Unique
🔹 Unlike traditional RSI, TABI visually maps RSI zones into layered gradients, making it easy to spot momentum shifts.
🔹 The multi-layered color scheme adds an intuitive, heatmap-like effect to RSI, helping traders quickly gauge conditions.
🔹 Incorporates CCF-inspired divergence detection and volume filtering, making signals more robust.
🔹 Dynamic labeling system ensures clarity without cluttering the chart.
Alerts & Notifications
🔔 TradingView Alerts Included
🚨 Blow-Off Top Detected → RSI overbought + volume spike + bearish divergence.
🟢 Oversold Bottom Detected → RSI oversold + bullish divergence.
Set alerts to receive notifications without watching the charts 24/7.
Final Thoughts
TABI is designed to simplify RSI analysis, provide better trade signals, and improve decision-making. Whether you're day trading, swing trading, or long-term investing, this tool helps you navigate market conditions with confidence.
🔥 Use it to detect high-probability reversals, confirm trends, and improve trade entries/exits! 🚀

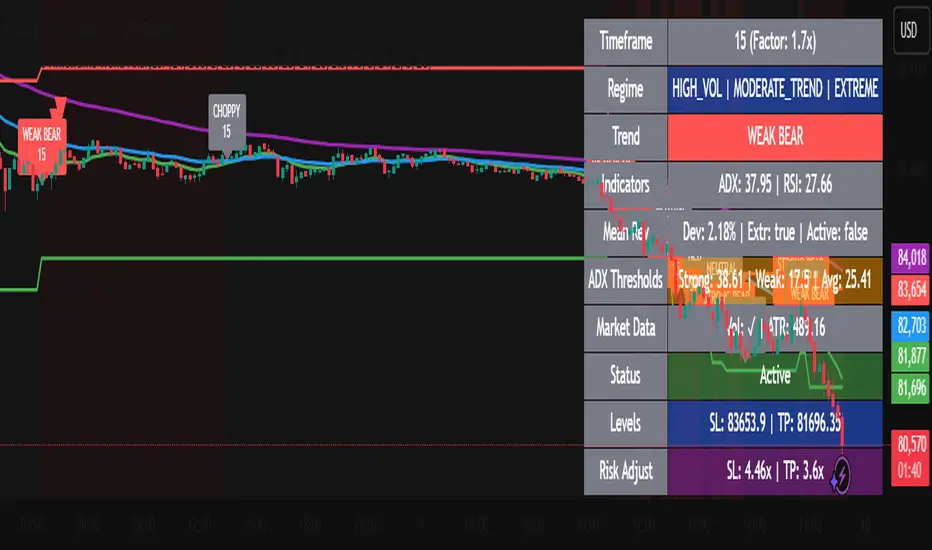
Dynamic Timeframe Trend AnalyzerPurpose and Core Logic
This indicator automatically adjusts its calculations based on the current chart’s timeframe, allowing traders to analyze trends, momentum, and mean reversion opportunities without manually changing indicator settings for each interval. It detects potential long or short setups by combining several techniques:
Dynamic Timeframe Factor
The script compares the current timeframe to a base (e.g., 5 minutes) and calculates a “factor” to scale certain parameters, such as EMA lengths or ATR settings. This reduces the need to reconfigure indicators when switching timeframes.
Regime Detection
It uses ADX (Average Directional Index) to classify the market as strongly trending, moderately trending, choppy, or in a potential mean-reversion phase.
RSI (Relative Strength Index) is also monitored for extreme levels (e.g., overbought/oversold) to detect potential reversal zones.
Volume is compared to a moving average to confirm or refute volatility conditions.
Trend & Mean Reversion Signals
EMA Alignment (8/21/55) helps identify bullish or bearish phases (strong bull if all EMAs align upward, strong bear if aligned downward).
For mean reversion opportunities, the script checks if ADX is sufficiently low (indicating weak or no trend) while price and RSI are at extreme levels—suggesting a snapback or countertrend move may occur.
Dynamic Stop Loss & Take Profit
Uses ATR (Average True Range) to set initial stop-loss (SL) and take-profit (TP) levels, then adjusts these levels further with “regime multipliers” based on whether the market is in a high-volatility trend or a quieter mean-reversion environment.
This approach aims to place stops and targets in a more adaptive way, reflecting current market conditions rather than a one-size-fits-all approach.
Visual Aids
Color-coded chart backgrounds (e.g., greenish for bullish trend, red for bearish, yellow/orange for mean reversion).
Triangles to show recent bullish/bearish signals.
A status table in the top-right corner (optional) displaying key metrics like ADX, RSI, dynamic thresholds, current SL/TP levels, and whether a stop loss has been hit.
How It Works Internally
ADX & Dynamic Thresholds:
A moving average (adx_mean) and standard deviation (adx_std) of the ADX are calculated over a lookback period to define “strong” vs. “weak” ADX thresholds.
This allows the script to adapt to changing volatility and trend strength in different markets or timeframes.
Mean Reversion Criteria:
The indicator checks if price deviates significantly from its own moving average, alongside RSI extremes. If ADX suggests no strong directional push (i.e., the market is “quiet”), it may classify conditions as mean-reverting.
Regime Multipliers:
Once the script identifies the market regime (e.g., strong uptrend, choppy, mean reversion), it applies different multipliers to the user-defined base values for stop-loss and take-profit. For instance, strong trending conditions might allow for wider stops to handle volatility, while mean reversion signals use tighter exits to capture quick reversals.
How to Use It
Timeframe Agnostic
Simply apply it to any timeframe (from 1-minute up to daily or weekly). The “Dynamic Timeframe Factor” will scale the indicator parameters automatically.
Look for Buy/Sell Triangles
When the script detects a valid bullish trend shift or a mean-reversion long setup, it plots a green triangle under the price bar. Conversely, it plots a red triangle above the price bar for bearish or mean-reversion short setups.
Check the Status Table
The table in the top-right corner summarizes the indicator’s current readings: ADX, RSI, volume trends, and the market regime classification.
The table also shows if a stop loss has been hit (SL Hit) and displays recommended SL/TP levels if a signal is active.
Stop Loss & Take Profit
The script plots lines for SL and TP on your chart after a new signal. These lines are automatically adjusted based on ATR, volume conditions, and ADX-derived multipliers.
Mean Reversion vs. Trend-Following
If you see a “Mean Rev” state in the table or the background turning yellow/orange, it suggests potential countertrend trades. Conversely, “STRONG BULL” or “STRONG BEAR” states favor momentum-based entries in the prevailing direction.
Originality & Benefits
Adaptive to Timeframe: Many indicators require reconfiguration when switching from short to long timeframes. This script automates that process using the “timeframe factor” logic.
Regime-Based SL/TP: Instead of fixed risk parameters, the script dynamically tunes stop and target levels depending on whether the market is trending or reverting.
Comprehensive Market View: It combines multiple factors—ADX, RSI, volume, moving averages, and volatility measurements—into a single, integrated framework that categorizes the market regime in real time.
Best Practices & Notes
Timeframes: It typically performs well on intraday timeframes (5m, 15m, 1H) but can also be used for swing trading on 4H or Daily charts.
Settings: The defaults are a good starting point, but you can adjust the base ATR multiplier or ADX lookbacks if you prefer a different balance between sensitivity and stability.
Risk Management: This indicator is not a guarantee of any specific results. Always use proper risk management (position sizing, stop-losses, and diversified strategies).
Alert Conditions: Built-in alert conditions can notify you when a new long or short signal appears, or when a stop loss is triggered.
Supertrend and Fast and Slow EMA StrategyThis strategy combines Exponential Moving Averages (EMAs) and Average True Range (ATR) to create a simple, yet effective, trend-following approach. The strategy filters out fake or sideways signals by incorporating the ATR as a volatility filter, ensuring that trades are only taken during trending conditions. The key idea is to buy when the short-term trend (Fast EMA) aligns with the long-term trend (Slow EMA), and to avoid trades during low volatility periods.
How It Works:
EMA Crossover:
1). Buy Signal: When the Fast EMA (shorter-term, e.g., 20-period) crosses above the Slow EMA (longer-term, e.g., 50-period), this indicates a potential uptrend.
2). Sell Signal: When the Fast EMA crosses below the Slow EMA, this indicates a potential downtrend.
ATR Filter:
1). The ATR (Average True Range) is used to measure market volatility.
2). Trending Market: If the ATR is above a certain threshold, it indicates high volatility and a trending market. Only when ATR is above the threshold will the strategy generate buy/sell signals.
3). Sideways Market: If ATR is low (sideways or choppy market), the strategy will suppress signals to avoid entering during non-trending conditions.
When to Buy:
1). Condition 1: The Fast EMA crosses above the Slow EMA.
2). Condition 2: The ATR is above the defined threshold, indicating that the market is trending (not sideways or choppy).
When to Sell:
1). Condition 1: The Fast EMA crosses below the Slow EMA.
2). Condition 2: The ATR is above the defined threshold, confirming that the market is in a downtrend.
When Not to Enter the Trade:
1). Sideways Market: If the ATR is below the threshold, signaling low volatility and sideways or choppy market conditions, the strategy will not trigger any buy or sell signals.
2). False Crossovers: In low volatility conditions, price action tends to be noisy, which could lead to false signals. Therefore, avoiding trades during these periods reduces the risk of false breakouts.
Additional Factors to Consider Adding:
=> RSI (Relative Strength Index): Adding an RSI filter can help confirm overbought or oversold conditions to avoid buying into overextended moves or selling too low.
1). RSI Buy Filter: Only take buy signals when RSI is below 70 (avoiding overbought conditions).
2). RSI Sell Filter: Only take sell signals when RSI is above 30 (avoiding oversold conditions).
=> MACD (Moving Average Convergence Divergence): Using MACD can help validate the strength of the trend.
1). Buy when the MACD histogram is above the zero line and the Fast EMA crosses above the Slow EMA.
2). Sell when the MACD histogram is below the zero line and the Fast EMA crosses below the Slow EMA.
=> Support/Resistance Levels: Adding support and resistance levels can help you understand market structure and decide whether to enter or exit a trade.
1). Buy when price breaks above a significant resistance level (after a valid buy signal).
2). Sell when price breaks below a major support level (after a valid sell signal).
=> Volume: Consider adding a volume filter to ensure that buy/sell signals are supported by strong market participation. You could only take signals if the volume is above the moving average of volume over a certain period.
=> Trailing Stop Loss: Instead of a fixed stop loss, use a trailing stop based on a percentage or ATR to lock in profits as the trade moves in your favor.
=> Exit Signals: Besides the EMA crossover, consider adding Take Profit or Stop Loss levels, or even using a secondary indicator like RSI to signal an overbought/oversold condition and exit the trade.
Example Usage:
=> Buy Example:
1). Fast EMA (20-period) crosses above the Slow EMA (50-period).
2). The ATR is above the threshold, confirming that the market is trending.
3). Optionally, if RSI is below 70, the buy signal is further confirmed as not being overbought.
=> Sell Example:
1). Fast EMA (20-period) crosses below the Slow EMA (50-period).
2). The ATR is above the threshold, confirming that the market is trending.
3). Optionally, if RSI is above 30, the sell signal is further confirmed as not being oversold.
Conclusion:
This strategy helps to identify trending markets and filters out sideways or choppy market conditions. By using Fast and Slow EMAs combined with the ATR volatility filter, it provides a reliable approach to catching trending moves while avoiding false signals during low-volatility, sideways markets.

RSI Classic calculationClassic RSI with Moving Average
This script implements the Classic RSI (Relative Strength Index) method with the option to use either an Exponential Moving Average (EMA) or a Simple Moving Average (SMA) for smoothing the gains and losses. This custom implementation primarily aims to resolve a specific issue I encountered when cross-referencing RSI values with Python-based data, which is calculated differently than in Pine Script. However, the methodology here can benefit anyone who needs to align RSI calculations across different programming languages or platforms.
The Problem:
When working with Python for data analysis, the RSI values are calculated differently. The smoothing method, for example, can vary—RMA (Relative Moving Average) may be used instead of SMA or EMA, resulting in discrepancies when comparing RSI values across systems. To solve this problem, this script allows for the same type of smoothing to be applied (EMA or SMA) as used in Python, ensuring consistency in the data.
Why This Implementation:
The main goal of this approach was to align RSI calculations across Python and Pine Script so that I could cross-check the results accurately. By offering both EMA and SMA options, this script bridges the gap between Pine Script and Python, ensuring that the data is comparable and consistent. While this particular issue arose from my work with Python, this solution is valuable for anyone dealing with cross-platform RSI comparisons in different coding languages or systems.
Benefits:
Cross-Platform Consistency: This script ensures that RSI values calculated in Pine Script are directly comparable to those from Python (or any other platform), which is crucial for accurate analysis, especially in automated trading systems.
Flexibility: The ability to choose between EMA and SMA provides flexibility in line with the specific needs of your strategy or data source.
Ease of Use: The RSI is plotted with overbought and oversold levels clearly marked, making it easy to visualize and use in decision-making processes.
Limitations:
Calculation Differences: While this script bridges the gap between Pine Script and Python, if you're working with a different platform or coding language that uses variations like RMA, small discrepancies may still arise.
Sensitivity Trade-Off: The choice between EMA and SMA impacts the sensitivity of the RSI. EMA responds quicker to recent price changes, which could lead to faster signals, while SMA provides a more stable but slower response.
Conclusion:
This Classic RSI script, with its customizable moving average type (EMA or SMA), not only solves the issue I faced with Python-based calculations but also provides a solution for anyone needing consistency across different programming languages and platforms. Whether you're working with Pine Script, Python, or other languages, this script ensures that your RSI values are aligned for more accurate cross-platform analysis. However, always be mindful of the small differences that can arise when different smoothing techniques (like RMA) are used in other systems.

Multi-Indicator Signals with Selectable Options by DiGetMulti-Indicator Signals with Selectable Options
Script Overview
This Pine Script is a multi-indicator trading strategy designed to generate buy/sell signals based on combinations of popular technical indicators: RSI (Relative Strength Index) , CCI (Commodity Channel Index) , and Stochastic Oscillator . The script allows you to select which combination of signals to display, making it highly customizable and adaptable to different trading styles.
The primary goal of this script is to provide clear and actionable entry/exit points by visualizing buy/sell signals with arrows , labels , and vertical lines directly on the chart. It also includes input validation, dynamic signal plotting, and clutter-free line management to ensure a clean and professional user experience.
Key Features
1. Customizable Signal Types
You can choose from five signal types:
RSI & CCI : Combines RSI and CCI signals for confirmation.
RSI & Stochastic : Combines RSI and Stochastic signals.
CCI & Stochastic : Combines CCI and Stochastic signals.
RSI & CCI & Stochastic : Requires all three indicators to align for a signal.
All Signals : Displays individual signals from each indicator separately.
This flexibility allows you to test and use the combination that works best for your trading strategy.
2. Clear Buy/Sell Indicators
Arrows : Buy signals are marked with upward arrows (green/lime/yellow) below the candles, while sell signals are marked with downward arrows (red/fuchsia/gray) above the candles.
Labels : Each signal is accompanied by a label ("BUY" or "SELL") near the arrow for clarity.
Vertical Lines : A vertical line is drawn at the exact bar where the signal occurs, extending from the low to the high of the candle. This ensures you can pinpoint the exact entry point without ambiguity.
3. Dynamic Overbought/Oversold Levels
You can customize the overbought and oversold levels for each indicator:
RSI: Default values are 70 (overbought) and 30 (oversold).
CCI: Default values are +100 (overbought) and -100 (oversold).
Stochastic: Default values are 80 (overbought) and 20 (oversold).
These levels can be adjusted to suit your trading preferences or market conditions.
4. Input Validation
The script includes built-in validation to ensure that oversold levels are always lower than overbought levels for each indicator. If the inputs are invalid, an error message will appear, preventing incorrect configurations.
5. Clean Chart Design
To avoid clutter, the script dynamically manages vertical lines:
Only the most recent 50 buy/sell lines are displayed. Older lines are automatically deleted to keep the chart clean.
Labels and arrows are placed strategically to avoid overlapping with candles.
6. ATR-Based Offset
The vertical lines and labels are offset using the Average True Range (ATR) to ensure they don’t overlap with the price action. This makes the signals easier to see, especially during volatile market conditions.
7. Scalable and Professional
The script uses arrays to manage multiple vertical lines, ensuring scalability and performance even when many signals are generated.
It adheres to Pine Script v6 standards, ensuring compatibility and reliability.
How It Works
Indicator Calculations :
The script calculates the values of RSI, CCI, and Stochastic Oscillator based on user-defined lengths and smoothing parameters.
It then checks for crossover/crossunder conditions relative to the overbought/oversold levels to generate individual signals.
Combined Signals :
Depending on the selected signal type, the script combines the individual signals logically:
For example, a "RSI & CCI" buy signal requires both RSI and CCI to cross into their respective oversold zones simultaneously.
Signal Plotting :
When a signal is generated, the script:
Plots an arrow (upward for buy, downward for sell) at the corresponding bar.
Adds a label ("BUY" or "SELL") near the arrow for clarity.
Draws a vertical line extending from the low to the high of the candle to mark the exact entry point.
Line Management :
To prevent clutter, the script stores up to 50 vertical lines in arrays (buy_lines and sell_lines). Older lines are automatically deleted when the limit is exceeded.
Why Use This Script?
Versatility : Whether you're a scalper, swing trader, or long-term investor, this script can be tailored to your needs by selecting the appropriate signal type and adjusting the indicator parameters.
Clarity : The combination of arrows, labels, and vertical lines ensures that signals are easy to spot and interpret, even in fast-moving markets.
Customization : With adjustable overbought/oversold levels and multiple signal options, you can fine-tune the script to match your trading strategy.
Professional Design : The script avoids clutter by limiting the number of lines displayed and using ATR-based offsets for better visibility.
How to Use This Script
Add the Script to Your Chart :
Copy and paste the script into the Pine Editor in TradingView.
Save and add it to your chart.
Select Signal Type :
Use the "Signal Type" dropdown menu to choose the combination of indicators you want to use.
Adjust Parameters :
Customize the lengths of RSI, CCI, and Stochastic, as well as their overbought/oversold levels, to match your trading preferences.
Interpret Signals :
Look for green arrows and "BUY" labels for buy signals, and red arrows and "SELL" labels for sell signals.
Vertical lines will help you identify the exact bar where the signal occurred.
Tips for Traders
Backtest Thoroughly : Before using this script in live trading, backtest it on historical data to ensure it aligns with your strategy.
Combine with Other Tools : While this script provides reliable signals, consider combining it with other tools like support/resistance levels or volume analysis for additional confirmation.
Avoid Overloading the Chart : If you notice too many signals, try tightening the overbought/oversold levels or switching to a combined signal type (e.g., "RSI & CCI & Stochastic") for fewer but higher-confidence signals.

MOKI V1The "MOKI V1" script is a trading strategy on the TradingView platform that uses a combination of two key indicators to identify buy and sell signals:
EMA200 (Exponential Moving Average 200): Used to determine the overall market trend. This line helps ensure that trades are made in the direction of the primary market trend.
RSI (Relative Strength Index): Used to measure the strength or weakness of a trend. In this strategy, a reading above 50 for the RSI indicates stronger buy signals.
Engulfing Pattern: This candlestick pattern occurs when a green (bullish) candle completely engulfs the previous red (bearish) candle. It is used as a buy signal when combined with the other indicators.
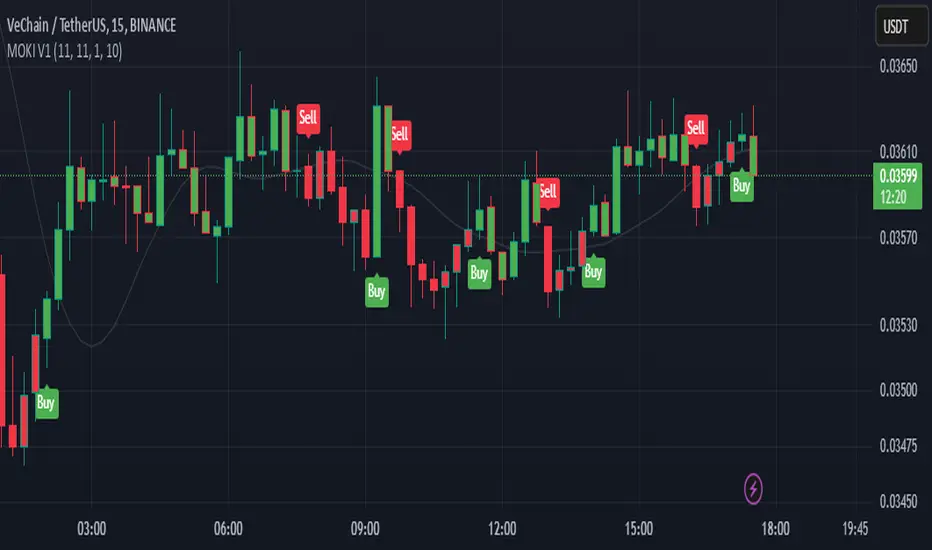
prime rsiThe "PRIME RSI" is a custom variation of the traditional RSI (Relative Strength Index) that offers enhanced flexibility and precision. This indicator provides an adaptable approach for tracking market conditions across different timeframes, making it an ideal tool for both short-term and long-term traders.
Key Features:
Custom Timeframe Selection: Users can select any timeframe to calculate the RSI, providing the ability to analyze data beyond the current chart's timeframe.
Smoothing Methods: Choose between Exponential Moving Average (EMA), Simple Moving Average (SMA), or the Relative Moving Average (RMA) for smoother, more accurate RSI values.
Signal Line: The signal line is smoothed using the selected method and visualized with dynamic coloring to indicate bullish (green) or bearish (red) market conditions.
Overbought/Oversold Levels: Clear levels at 70 (overbought) and 30 (oversold), with fill zones to highlight extreme market conditions, helping traders spot potential reversal points.
Midline at 50: The centerline at 50 serves as a neutral zone, allowing traders to identify shifts in market momentum quickly.
Practical Use:
Trend Confirmation: Use the PRIME RSI to confirm the prevailing market trend, with signals above 50 suggesting bullish momentum and signals below 50 indicating bearish trends.
Overbought/Oversold Conditions: The indicator’s overbought and oversold regions help pinpoint potential market reversals, giving traders valuable entry and exit signals.
Ideal For: All types of traders who want a more flexible and customizable RSI for better trend analysis, especially those working with smaller timeframes or seeking a more responsive momentum indicator.
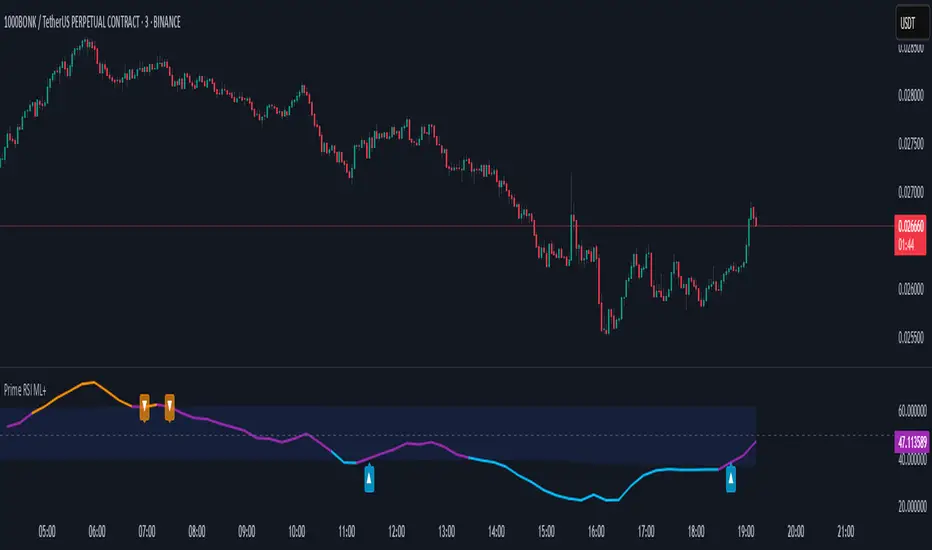
[COG]MTF RZP Heatmap MTF RZP Heatmap (Range Zone Pulse)
What It Does
This indicator creates three visual heatmaps that show how current price movement compares to the average range of different timeframes. It helps traders:
Identify when price moves are overextended
Compare momentum across different timeframes
Spot potential reversal points
Understand the relative strength of price movements
How It Works
Range Calculation:
For each selected timeframe, it calculates an average range based on the specified number of periods
The range is measured from high to low for each period
A moving average of these ranges creates a dynamic "normal" range for that timeframe
Position Calculation:
Measures how far price has moved from the period's opening price
Compares this movement to the average range
Converts the movement into a percentage (-100% to +100%)
Visual Display:
Shows three vertical heatmaps, one for each timeframe
Colors graduate from bearish (typically red) to bullish (typically green)
A dot indicator shows the current position within each range
Percentage labels show exact movement relative to average range
Trading Applications
Trend Trading:
Multiple timeframes aligned in the same color suggest strong trend
Use larger timeframes (Daily/Weekly) for trend direction
Use smaller timeframes (4H/1H) for entry timing
Mean Reversion:
Extreme readings (near +100% or -100%) suggest overextended moves
Look for divergences between timeframes
Use when shorter timeframes show extremes but larger timeframes don't
Volatility Trading:
Compare current moves to average ranges
Identify when markets are more volatile than usual
Adjust position sizes based on range expansion/contraction
Multi-Timeframe Analysis:
Compare price action across different time horizons
Identify conflicting signals between timeframes
Use for timeframe alignment in trading decisions
Best Practices for Usage
Timeframe Selection:
Set the first timeframe to your trading timeframe
Set the second timeframe to your trend timeframe
Set the third timeframe to your entry timeframe
Range Period Settings:
Default is 5 periods
Increase for more stable readings
Decrease for more responsive readings
Color Interpretation:
Darker colors indicate stronger moves
Look for alignment across timeframes
Watch for extremes in any timeframe
Trading Setups:
Wait for alignment in multiple timeframes
Use extreme readings for counter-trend trades
Combine with other indicators for confirmation
Multi-Timeframe Confluence IndicatorThe Multi-Timeframe Confluence Indicator strategically combines multiple timeframes with technical tools like EMA and RSI to provide robust, high-probability trading signals. This combination is grounded in the principles of technical analysis and market behavior, tailored for traders across all styles—whether intraday, swing, or positional.
1. The Power of Multi-Timeframe Confluence
Markets are influenced by participants operating on different time horizons:
• Intraday traders act on short-term price fluctuations.
• Swing traders focus on intermediate trends lasting days or weeks.
• Position traders aim to capture multi-month or long-term trends.
By aligning signals from a higher timeframe (macro trend) with a lower timeframe (micro trend), the indicator ensures that short-term entries are in harmony with the broader market direction. This multi-timeframe approach significantly reduces false signals caused by temporary market noise or counter-trend moves.
Example: A bullish trend on the daily chart (higher timeframe) combined with a bullish RSI and EMA alignment on the 15-minute chart (lower timeframe) provides a stronger confirmation than relying on the 15-minute chart alone.
2. Why EMA and RSI Are Essential
Each element of the indicator serves a unique role in ensuring accuracy and reliability:
• EMA (Exponential Moving Average):
• A dynamic trend filter that adjusts quickly to price changes.
• On the higher timeframe, it establishes the overall trend direction (e.g., bullish or bearish).
• On the lower timeframe, it identifies precise entry/exit zones within the trend.
• RSI (Relative Strength Index):
• Adds a momentum-based perspective, confirming whether a trend is backed by strong buying or selling pressure.
• Ensures that signals occur in areas of strength (RSI > 55 for bullish signals, RSI < 45 for bearish signals), filtering out weak or uncertain price movements.
By combining EMA (trend) and RSI (momentum), the indicator delivers confluence-based validation, where both trend and momentum align, making signals more reliable.
3. Cooldown Period for Signal Optimization
Trading in choppy or sideways markets often leads to overtrading and false signals. The cooldown period ensures that once a signal is generated, subsequent signals are suppressed for a defined number of bars. This prevents traders from entering low-probability trades during indecisive market phases, improving overall signal quality.
Example: After a bullish confluence signal, the cooldown period prevents a bearish signal from being triggered prematurely if the market enters a temporary retracement.
4. Use Cases Across Trading Styles
This indicator caters to various trading styles, each benefiting from the confluence of timeframes and technical elements:
• Intraday Trading:
• Use a 1-hour chart as the higher timeframe and a 5-minute chart as the lower timeframe.
• Benefit: Align intraday entries with the hourly trend for higher win rates.
• Swing Trading:
• Use a daily chart as the higher timeframe and a 1-hour chart as the lower timeframe.
• Benefit: Capture multi-day moves while avoiding counter-trend entries.
• Scalping:
• Use a 30-minute chart as the higher timeframe and a 1-minute chart as the lower timeframe.
• Benefit: Enhance scalping efficiency by ensuring short-term trades align with broader intraday trends.
• Position Trading:
• Use a weekly chart as the higher timeframe and a daily chart as the lower timeframe.
• Benefit: Time long-term entries more precisely, maximizing profit potential.
5. Robustness Through Customization
The indicator allows traders to customize:
• Timeframes for higher and lower analysis.
• EMA lengths for trend filtering.
• RSI settings for momentum confirmation.
• Cooldown periods to adapt to market volatility.
This flexibility ensures that the indicator can be tailored to suit individual trading preferences, market conditions, and asset classes, making it a comprehensive tool for any trading strategy.
Why This Mashup Stands Out
The Multi-Timeframe Confluence Indicator is more than a sum of its parts. It leverages:
• EMA’s ability to identify trends, combined with RSI’s insight into momentum, ensuring each signal is well-supported.
• A multi-timeframe perspective that incorporates both macro and micro trends, filtering out noise and improving reliability.
• A cooldown mechanism that prevents overtrading, a common pitfall for traders in volatile markets.
This integration results in a powerful, adaptable indicator that provides actionable, high-confidence signals, reducing uncertainty and enhancing trading performance across all styles.

Ichimoku MTF (best MTF 4H - Entry 15M)The Ichimoku Cloud is a collection of technical indicators that show support and resistance levels, as well as momentum and trend direction. It does this by taking multiple averages and plotting them on a chart. It also uses these figures to compute a “cloud” that attempts to forecast where the price may find support or resistance in the future.
The technical indicator shows relevant information at a glance by using averages.
The overall trend is up when the price is above the cloud, down when the price is below the cloud, and trendless or transitioning when the price is in the cloud.
Charles G. Koonitz. “Ichimoku Analysis & Strategies: The Visual Guide to Spot the Trends in Stock Market, Cryptocurrency and Forex Using Technical Analysis and Cloud Charts," Tripod Solutions Inc., 2019.
When Leading Span A is rising and above Leading Span B, this helps to confirm the uptrend and the space between the lines is typically colored green. When Leading Span A is falling and below Leading Span B, this helps confirm the downtrend. The space between the lines is typically colored red in this case.1
Traders will often use the Ichimoku Cloud as an area of support and resistance depending on the relative location of the price. The cloud provides support/resistance levels that can be projected into the future. This sets the Ichimoku Cloud apart from many other technical indicators that only provide support and resistance levels for the current date and time.
Traders should use the Ichimoku Cloud in conjunction with other technical indicators to maximize their risk-adjusted returns. For example, the indicator is often paired with the relative strength index (RSI), which can be used to confirm momentum in a certain direction. It’s also important to look at the bigger trends to see how the smaller trends fit within them. For example, during a very strong downtrend, the price may push into the cloud or slightly above it, temporarily, before falling again. Only focusing on the indicator would mean missing the bigger picture that the price was under strong longer-term selling pressure.
Crossovers are another way that the indicator can be used. Watch for the conversion line to move above the base line, especially when the price is above the cloud. This can be a powerful buy signal. One option is to hold the trade until the conversion line drops back below the base line. Any of the other lines could be used as exit points as well.

CHAKRA RISS ENGULFING CANDLESTICK STRATEGYChakra RISS Engulfing Candlestick Strategy
Type: Technical Indicator & Strategy
Platform: TradingView
Script Version: Pine Script v6
Overview:
The Chakra RISS Engulfing Candlestick Strategy combines a momentum-based approach using the Relative Strength Index (RSI) with Engulfing Candlestick Patterns to generate buy and sell signals. The strategy filters trades based on price movement relative to a 50-period Simple Moving Average (SMA), making it a trend-following strategy.
The indicator uses color-coded bars to visually represent market conditions, helping traders easily identify bullish and bearish trends. The strategy is designed to be dynamic, adapting to changing market conditions and filtering out noise using key technical indicators.
How It Works:
RSI-Based Color Conditions:
Green Bars: When the RSI crosses above a specified UpLevel (default: 50), indicating a bullish momentum and signaling potential buy conditions.
Red Bars: When the RSI crosses below a specified DownLevel (default: 50), indicating a bearish momentum and signaling potential sell conditions.
Buy Signal:
Triggered when the following conditions are met:
RSI crosses from below the UpLevel (default: 50) to above it, signaling increasing bullish momentum.
The close price is above the 50-period Simple Moving Average (SMA), confirming an uptrend.
The Buy Signal is plotted below the bar with a green arrow and a "BUY" label.
Sell Signal:
Triggered when the following conditions are met:
RSI crosses from above the DownLevel (default: 50) to below it, signaling increasing bearish momentum.
The close price is below the 50-period Simple Moving Average (SMA), confirming a downtrend.
The Sell Signal is plotted above the bar with a red arrow and a "SELL" label.
Stop Loss and Take Profit:
For long trades (buy signals), the stop loss is placed below the previous bar's low, and the take profit is set at 3% above the entry price.
For short trades (sell signals), the stop loss is placed above the previous bar's high, and the take profit is set at 3% below the entry price.
Dynamic Bar Coloring:
The bar colors change dynamically based on RSI levels:
Green Bars: Indicating a potential uptrend (bullish).
Red Bars: Indicating a potential downtrend (bearish).
These visual cues help traders quickly identify market trends and potential reversals.
Trend Filtering:
The 50-period Simple Moving Average (SMA) is used to filter trades based on the overall market trend:
Buy signals are only considered when the price is above the moving average, indicating an uptrend.
Sell signals are only considered when the price is below the moving average, indicating a downtrend.
Alerting System:
Alerts can be set for both buy and sell signals. These alerts notify traders in real-time when potential trades are generated, allowing them to act promptly.
Alerts can be configured to send notifications through email, SMS, or a webhook for integration with other services like IFTTT or Zapier.
Key Features:
RSI and Moving Average-Based Signals: Combines RSI with a moving average for more accurate trade signals.
Stop Loss and Take Profit: Dynamic risk management with custom stop loss and take profit levels based on previous high and low prices.
Buy and Sell Alerts: Provides real-time alerts when a buy or sell signal is triggered.
Trend Confirmation: Uses the 50-period Simple Moving Average to filter signals and confirm the direction of the trend.
Visual Bar Color Changes: Makes it easy to identify bullish or bearish trends with color-coded bars.
Usage:
This strategy is suitable for traders who prefer a trend-following approach and want to combine momentum indicators (RSI) with price action (Engulfing Candlestick patterns). It is particularly useful in volatile markets where quick identification of trend changes can lead to profitable trades.
Best Used For: Day trading, swing trading, and trend-following strategies.
Timeframes: Works well on various timeframes, from 1-minute charts for scalping to daily charts for swing trading.
Markets: Can be applied to any market with sufficient liquidity (stocks, forex, crypto, etc.).
Settings:
UpLevel: The RSI level above which the market is considered bullish (default: 50).
DownLevel: The RSI level below which the market is considered bearish (default: 50).
SMA Length: The period of the Simple Moving Average used to filter trades (default: 50).
Risk Management: Customizable stop loss and take profit settings based on price action (default: 3% above/below the entry price).
