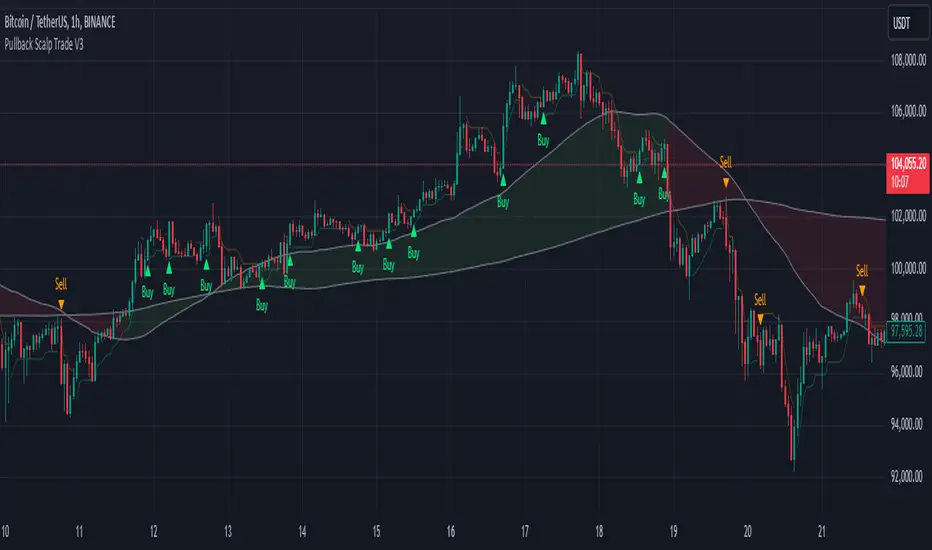
Pullback Scalp Trade V2Pullback Scalp Trading Indicator
This indicator combines multiple technical analysis tools to identify potential pullback trading opportunities in trending markets. It uses a dual moving average system along with RSI for confirmation, providing a comprehensive approach to trend-following and momentum trading.
Key Features:
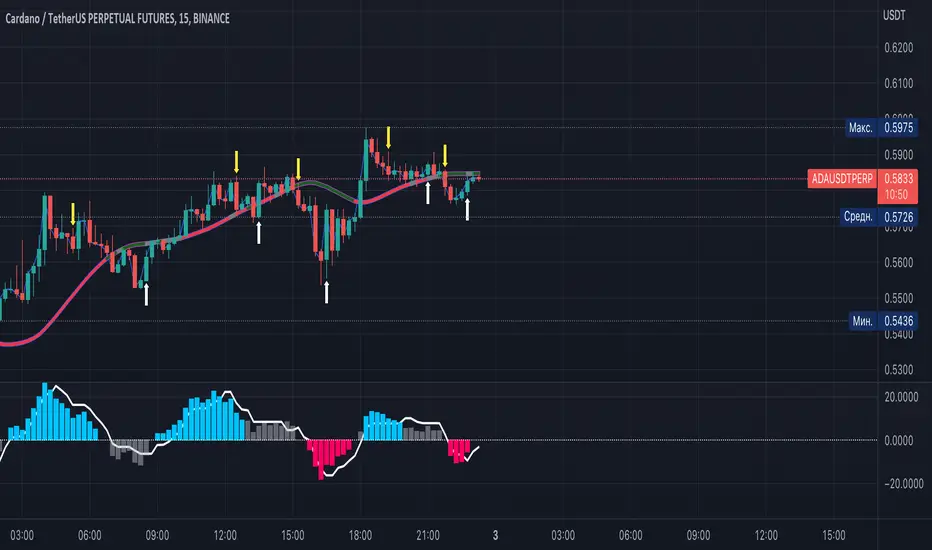
1. Trend Identification:
- Uses 50 and 200 period moving averages to define the overall trend
- Visual trend zone highlighting for clear market direction
- Customizable MA periods for different timeframes
2. Signal Generation System:
- Combines RSI crossovers with trend direction
- Buy signals occur when:
* Price is above 200 MA (uptrend)
* RSI crosses above its SMA
* RSI is below the lower threshold (default 50)
- Sell signals occur when:
* Price is below 200 MA (downtrend)
* RSI crosses below its SMA
* RSI is above the upper threshold (default 50)
3. Customizable Parameters:
- Short and Long MA periods
- MA types (SMA, EMA, VWMA)
- RSI length and RSI-SMA length
- RSI signal thresholds
- Trend MA periods
Usage Guidelines:
- Best used on higher timeframes (1H and above) for trend trading
- Wait for price to respect the trend zone before taking trades
- Use additional confirmation from price action or other indicators
- Adjust RSI levels based on market volatility
Limitations:
- Like all indicators, this tool may generate false signals in choppy markets
- Should not be used as a sole decision-making tool
- Past performance does not guarantee future results
----------
Türkçe Açıklama:
Bu indikatör, trendli piyasalarda potansiyel geri çekilme fırsatlarını belirlemek için birden fazla teknik analiz aracını birleştirir. Trend takibi ve momentum ticareti için kapsamlı bir yaklaşım sunan ikili hareketli ortalama sistemi ile RSI'yı bir arada kullanır.
Temel Özellikler:
1. Trend Belirleme:
- Genel trendi tanımlamak için 50 ve 200 periyotlu hareketli ortalamalar
- Görsel trend bölgesi vurgulaması
- Farklı zaman dilimleri için özelleştirilebilir MA periyotları
2. Sinyal Üretim Sistemi:
- RSI kesişimlerini trend yönü ile birleştirir
- Alış sinyalleri şu durumlarda oluşur:
* Fiyat 200 MA'nın üzerinde (yükseliş trendi)
* RSI, SMA'sını yukarı keser
* RSI alt eşiğin altında (varsayılan 50)
- Satış sinyalleri şu durumlarda oluşur:
* Fiyat 200 MA'nın altında (düşüş trendi)
* RSI, SMA'sını aşağı keser
* RSI üst eşiğin üzerinde (varsayılan 50)
3. Özelleştirilebilir Parametreler:
- Kısa ve Uzun MA periyotları
- MA tipleri (SMA, EMA, VWMA)
- RSI uzunluğu ve RSI-SMA uzunluğu
- RSI sinyal seviyeleri
- Trend MA periyotları
Kullanım Önerileri:
- Trend ticareti için yüksek zaman dilimlerinde (1S ve üzeri) kullanılması önerilir
- İşlem almadan önce fiyatın trend bölgesine saygı göstermesini bekleyin
- Fiyat hareketi veya diğer indikatörlerden ek teyit alın
- RSI seviyelerini piyasa volatilitesine göre ayarlayın
Sınırlamalar:
- Tüm indikatörler gibi, dalgalı piyasalarda yanlış sinyaller üretebilir
- Tek başına karar verme aracı olarak kullanılmamalıdır
- Geçmiş performans, gelecekteki sonuçların garantisi değildir
Pine Script® indicator