DMT 369 DRAGRONFLY STRATSuccessful traders trade with a fixed plan and without emotion, but this a lot harder than many new traders think. Many never master this skill and suffer continual drawdowns on their accounts as they overtrade high leverage positions in volatile markets.
ĐΜŦ Autobot resolves this issue by taking the human element out of the equation, allowing full automation of trades using TradingView alerts to trigger your favourite trading bot, such as Alertatron or 3Commas.
Being a Trend Reversal Indicator based on Volatility & Average True Range, ĐΜŦ Autobot is designed to identify spots in the market that offer suitable scalp and swing trade opportunities.
Due to popular demand we have expanded our ĐΜŦ Autobot product line to include the new ĐΜŦ Autobot Dragonfly 3-6-9 Edition which combines DMT with 3-6-9 Vortex mathematics, our Titan indicator and a multi-ladder scalping strategy to ensure you maintain a preferable average entry when price action moves against your position.
Indicator View
It its default state the DMT Autobot Dragonfly indicator displays key signal information, such as:
• Support & resistance range lines
• Titan Body Small & Large Time Frame lines
• Long & Short entry positions
• Long & Short position ladders
• Profit targets
Dragonfly displays a range between resistance (upper line) and support (lower line) on the chart.
Once the price is granted support in the range the lower line will turn green. As price action develops it will make repeated attempts to test support. If support holds price will attempt to test the resistance line (red).
When resistance is broken and the price is above the upper line, the line will turn blue confirming the bullish momentum and provide a potential buy opportunity.
Price action will make attempts to test the upper line as support and will keep rising while support is granted.
Once support is lost the upper line will become red once more. As price action develops it will make repeated attempts to test resistance. If resistance holds, the price will attempt to test the support line (green).
When support is broken and the price goes below the lower line, the line will turn red confirming the bearish momentum and provide a potential selling opportunity.
Price action will make attempts to test the lower line as resistance and will keep dropping while resistance is granted.
Titan Body
The Titan Body Small & Large time frame options in the indicator add additional trendlines to the chart to provide further clarity and confirmation to the Support & Resistance range indication.
Once price is granted support by the Small Time Frame trend line the line will turn green. As price action develops it will make repeated attempts to test the Small Time Frame support. Once the price is below the Small Time Frame trend line, the line will turn red and can act as resistance in a trend reversal.
When price is granted support by the Large Time Frame trend line the line will turn cyan. As price action develops it will make repeated attempts to test the Large Time Frame support. Once the price is below the Large Time Frame trend line, the line will turn orange and can act as resistance in a trend reversal.
The Titan Body enabled and customized in the indicator’s style settings,
Alert indicators
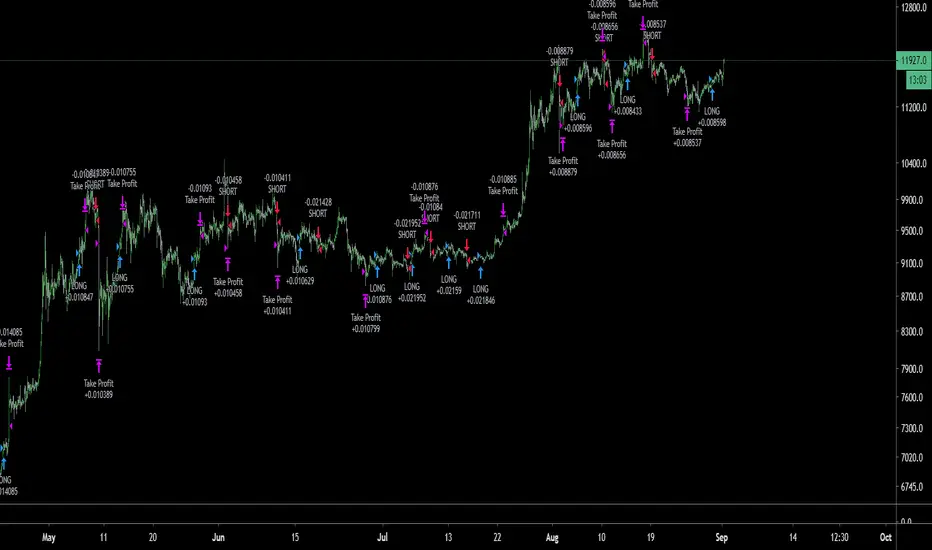
DMT Autobot Dragonfly Edition generates signals that can be used to scalp trade a volatile asset.
Signals are enabled and customized in the indicator’s input settings Additional options can be found in the options, but it is recommended that these are left at the default, as shown below. The indicator generates many
Entry and Profit levels can be disabled or customized in the indicator’s style settings,
Tradingview Alerts
Using Tradingview alerts, DMT Autobot Dragonfly signals can be used to trigger a trading bot.
To trigger a long or short position, set the Tradingview Alert Condition to DMT 369 Dragonfly and select the long or short option.
It is recommended that long or short positions are configured to trigger Once Per Bar Close
Ladders can also be triggered using alerts. To trigger a ladder order, set the Tradingview Alert Condition to DMT 369 Dragonfly and select the appropriate Long or Short ADD option that is to be triggered by the relevant values defined in the indicator’s configuration.
It is recommended that ladder orders are configured to trigger Once Per Bar,
To trigger a take profit order, set the Tradingview Alert Condition to DMT 369 Dragonfly and select the Long or Short TP option that is to be triggered by the relevant values defined in the indicator’s configuration.
Take profit orders can be configured as Once Per Bar Close or Once Per Minute.
If you wish to trigger a take profit signal immediately when the indicator’s defined take profit value is achieved, then use the Once Per Bar option.
Selecting Once Per Bar Close to generate a take profit signal is a gamble as the candle may close far away from the defined profit target – positive or negative.
While stops can be used, they are not applicable to the recommended ladder strategy.
Ladder Strategy
The DMT Autobot Dragonfly indicator always turns an underwater position into a win by utilizing a ladder strategy.
By using the recommended defaults, the indicator will trigger ladder orders at 3%, 6% & 9% using increasing order sizes,
Order sizes increase exponentially to ensure a good average price is maintained. If you are not using DMT Autobot Dragonfly signals to trigger ladder or take profit orders, please ensure your trading bot is configured to recalculate the new ladder entry and profit target based on the new average position entry price as each ladder is filled.
If you are using DMT Autobot Dragonfly on a leveraged asset, please ensure the leverage position is configured suitably so that your position is not liquidated if the price rapidly moves against you.
If u are looking for more information or access to the script please private msg me in trading view chat thx for support
Search in scripts for "scalping"

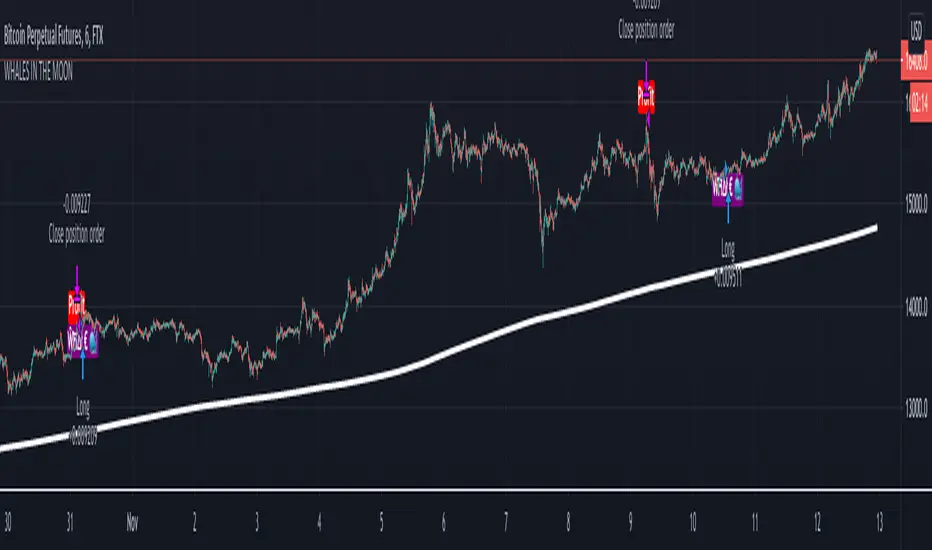
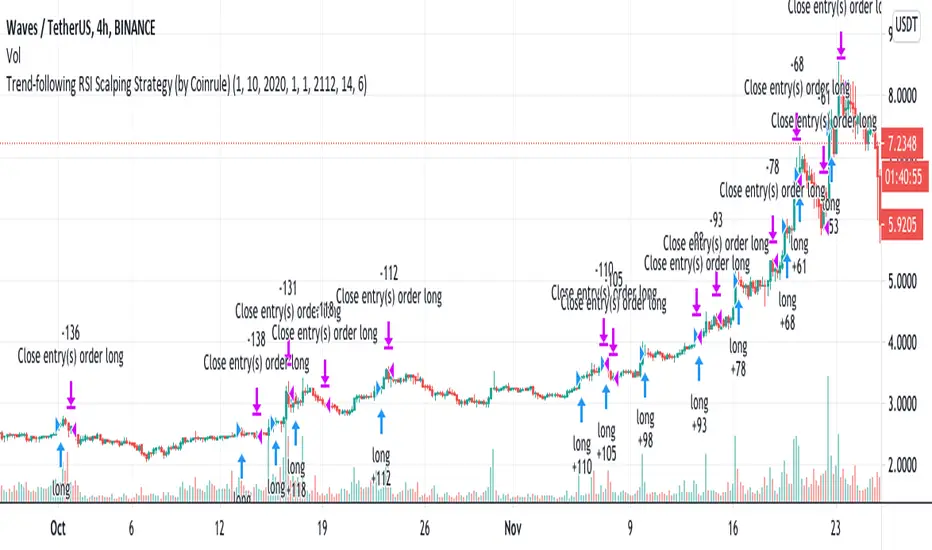
Trend-following RSI Strategy According to classical technical analysis, an RSI above 70 should signal overbought conditions and, thus, a sell-signal. Cryptocurrencies represent a whole new asset class, and they reshape the classical concepts of technical analysis. FOMO-buying can be very powerful, and coins can remain in overbought conditions enough to provide excellent opportunities for scalping trades on the upside.
Building a trend-following trading strategy based on the RSI, which is generally considered a contrarian indicator, may sound counter-intuitive. Over 200 backtests prove that this is a very interesting long-term setup.
The setup is optimized on a 4-hours time frame and trading cryptocurrencies versus USD or stable coins.
The strategy tries to catch coins on sustained uptrends to take advantage of further upside.
The strategy's buy-signal triggers when a coin has an RSI above 70 on a 4-hours time frame.
The strategy sells the coin if a profit of 6% is achieved. Alternatively, it closes the position if the RSI drops below 55, indicating a possible weakening of the trend.
The strategy assumes each order to trade 30% of the available capital. A trading fee of 0.1% is taken into account. The fee is aligned to the base fee applied on Binance, which is the largest cryptocurrency exchange.
Phenom 5.3.1This has been a private script until now. I will be sharing it in order to get some feedback until it is ready to be made "invite only"
WHAT IT IS:
This is a scalping method (mostly) that works on nearly all markets and timeframes. THIS IS A BACKTEST SCRIPT! PLAN ACCORDINGLY!
HOW IT WORKS:
This script uses common indicators (5) in non-standard ways. When combined together, they can give fairly accurate results (40-65%) with acceptable Profit Factor ratings (1.7-3+).
This uses CCI, Moving Average, Stochastic, PSAR, and Bollinger Bands.
With these we have 4 base strategies usable.
Each indicator can be disabled (one at a time).
Each indicator has a SL method (stackable).
Each indicator has a TP method (stackable).
BEST RESULTS:
I have received best results as a scalper on 5min or 1HR timeframes. Mostly used on Index CFD's and CRYPTO markets.
NOT RESPONSIBLE FOR MISUSE OR LOST FUNDS! D.Y.O.R

[astropark] DMI/ADX strategy [strategy]Dear Followers,
today I'm happy to share with you my DMI / ADX Strategy .
It provides directional trend information, so if a bullish or a bearish trend is going to start. Statistically it works better on lower timeframes (from 5 minutes to 1 hour).
It is both a Swing and Scalping Strategy indicator , based on a simple trend following theory , good for trading FOREX, Indexes, Stocks, Commodities and Cryptocurrencies.
To help in Taking Profits, the strategy integrates 2 special other than bull/bear signals:
Overbought and Oversold RSI Signals , which appear both as darker background (the darker the color, the more the price is in overbought/oversold) and green "ob"-"tp" / red "os"-"tp" labels (they optionally pop up only on a configurable stronger overbought/oversold condition) (you can enable/disable it optionally)
Peak Profit Tracker , which resets every time a new trade starts and keeps track of price fluctuation during the trade: the message is don't be too greedy and take profits or lock them with a stoploss in profit (you can enable/disable it optionally)
You can edit many options in order to
have more/less bull/bear signals
enable/disable showing bull/bear signals
enable/disable showing RSI TP signals (you can edit RSI length, overbought (OB) and oversold (OS) levels)
enable/disable showing peak profits on each trade
The user who wants to use this strategy, especially via an automated bot, must always set a stoploss (example 150$ from entry on bitcoin ) or use a proper risk management strategy .
This is not the "Holy Grail", so use it with caution. It's highly suggested to use a proper money management .
This script will let you backtest performance of the indicator based on bear/bull signals.
You can find the alarms version by searching for my DMI / ADX Strategy and choosing the "alarms" named.
Here there are some examples how this DMI / ADX strategy works on many markets:
LTC/USDT 15m
BTC/USD 15m
BNB/BTC 15m
ETH/USD 15m
GOLD (XAU/USD) 15m
GOLD (XAU/USD) 1h
FB 15m
AAPL 15m
TSLA 1h
BANKNIFTY Index 5m
NIFTY 50 Index 5m
This is a premium indicator , so send me a private message in order to get access to this script .

Algonize Pivot Strategy (APS)This study is based on several Price Action parameters of :-
• Pivot Points,
• Higher High and Lower Lows,
• High Low Index ,
• Support and Resistance.
► How To Use This Strategy?
This is a pure scalping strategy and it is advised to use this only with algo trading systems. Due to high trade frequency.
► This Strategy has inbuilt custom time frame backtester, which enables you to test for performance between any date or check for a single day.
► To Create Alerts for algo trading in this strategy simply Check "Activate Algo" from Settings then Create new alert , select your strategy in condition box, and now scroll down to message box and write
{{strategy.order.comment}}
That's it , Just Click on Create Alert Button
Backtest Values Used:-
Initial Capital : 1000000
Order Size (Lots) : 1 (Contract) Lots
Pyramiding : 0 orders
Commission : 0.003%
Sharpe Ratio : 1.741
Profit Factor : 1.174
Test Yourself and give feedback.
PM us to obtain access.

Triple EMA Scalper low lag stratHi all,
This strategy is based on the Amazing scalper for majors with risk management by SoftKill21
The change is in lines 11-20 where the sma's are replaced with Triple ema's to
lower the lag.
The original author is SoftKill21. His explanation is repeated below:
Best suited for 1M time frame and majors currency pairs.
Note that I tried it at 3M time frame.
Its made of :
Ema ( exponential moving average ) , long period 25
Ema ( exponential moving average ) Predictive, long period 50,
Ema ( exponential moving average ) Predictive, long period 100
Risk management , risking % of equity per trade using stop loss and take profits levels.
Long Entry:
When the Ema 25 cross up through the 50 Ema and 100 EMA . and we are in london or new york session( very important the session, imagine if we have only american or european currencies, its best to test it)
Short Entry:
When the Ema 25 cross down through the 50 Ema and 100 EMA , and we are in london or new york session( very important the session, imagine if we have only american or european currencies, its best to test it)
Exit:
TargetPrice: 5-10 pips
Stop loss: 9-12 pips

Amazing scalper for majors with risk managementHello,
Today I am glad to bring you an amazing simple and efficient scalper strategy.
Best suited for 1M time frame and majors currency pairs.
Its made of :
Ema (exponential moving average) , long period 25
Ema(exponential moving average) Predictive, long period 50,
Ema(exponential moving average) Predictive, long period 100
Risk management , risking % of equity per trade using stop loss and take profits levels.
Long Entry:
When the Ema 25 cross up through the 50 Ema and 100 EMA. and we are in london or new york session( very important the session, imagine if we have only american or european currencies, its best to test it)
Short Entry:
When the Ema 25 cross down through the 50 Ema and 100 EMA, and we are in london or new york session( very important the session, imagine if we have only american or european currencies, its best to test it)
Exit:
TargetPrice: 5-10 pips
Stop loss: 9-12 pips
Hope you enjoy it :)

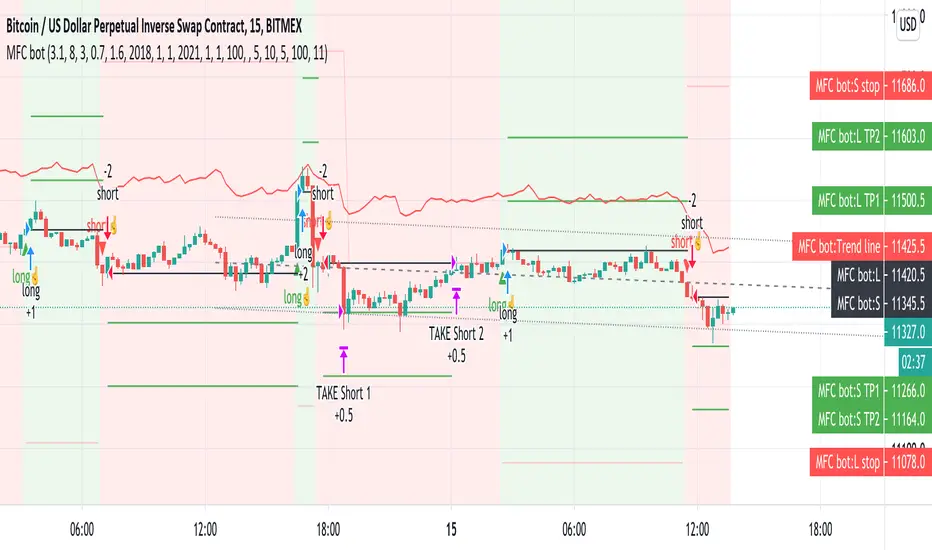
Money Flow Club Bot Strategy 1-15 min ALLENG:
Friends, in this script, there is a function that calls the closing of the candle by Heikin ASHI candles.
You can disable it in the indicator settings.
There is no redrawing of the indicator on regular candlesticks.
The indicator is easy to set up for any trading pairs and any exchanges.
It has an entry point and provides 2 take profit.
It also contains consolidation zones when the price moves for a short time in the range that is visible on the indicator.
In order to try the indicator write in your personal messages.
The strategy does not specify a condition for exiting the position when the first take is taken, the stop is moved to breakeven, so the chart in the strategy turned out to be torn.
RUS:
Друзья, в этом скрипте присутствует функция вызывающая закрытие свечи по свечам Хейкин Аши.
Её можно отключить в настройках индикатора. На обычных свечах перерисовка индикатора отсутствует.
Индикатор легко настроить на любые торговые пары и любые биржи. А нем есть точка входа и предусмотрены 2 тейк профита.
Так же в нем присутствуют зоны консолидации когда цена короткое время движется в диапазоне который виден на индикаторе.
Для того что бы попробовать индикатор напишите в личные сообщения.
В стратегии не прописано условие выхода из позиции когда первый тейк взят, то стоп переносится в безубыток, поэтому график в стратегии получился рваный.
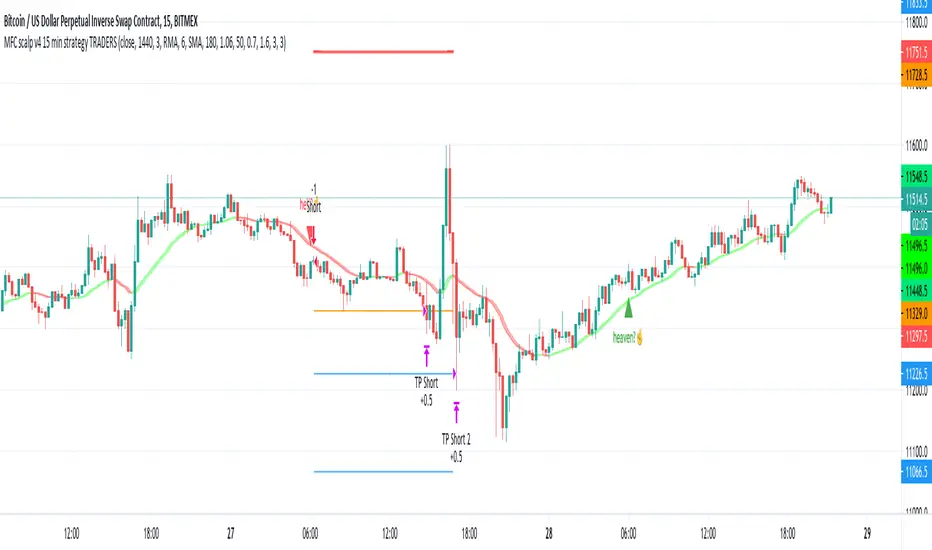
MFC scalp v4 15 min strategy TRADERSthis indicator to trade for a short time in a TF of 15 minutes.
We have created takeprofit zones for you so that you can understand where we can get to and take your profit. these points are mostly very helpful.
There are basic settings that allow you to adjust the indicator individually for each situation; because of this, this indicator can be used for any exchange and any currency pair.
For Scalp trading, we use 4 different strategies available to our clients. If you enter them correctly, you can never see the minus sign.
Use the link below to obtain access to this indicator.
Primus V1 - BybitHey everyone,
The current version its a scalping strategy for Bybit but for those that prefers swing trading algo I can do a different version as well for different exchanges.
This is the first version on my algo Primus, expect updates on the months to come.
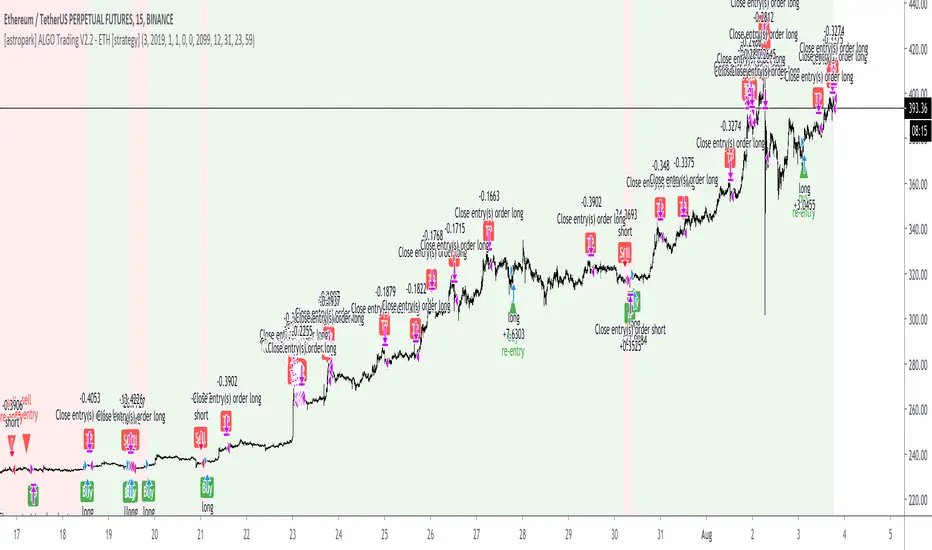
[astropark] ALGO Trading V2.2 - ETH [strategy]Dear Followers,
today another awesome Swing and Scalping Trading Strategy indicator : the upgraded version of ALGO Trading V2 for Binance Ethereum PERP on 15m timeframe!
It is runnable on a bot , just write me in order to help you do it.
If you are a scalper or you are a swing trader, you will love suggested entries for fast and long-lasting profit.
Keep in mind that a proper trailing stop strategy and risk management and money management strategies are very important (DM me if you need any clarification on these points).
This is an upgrade version of ALGO Trading V2 for Ethereum.
You can find ALGO Trading V2 indicator here below:
If you are interested in Bitcoin Trading , you will like for sure ALGO Trading V1.2, which is a customized version for Bitcoin trading:
This strategy has the following options:
enable/disable signals on chart
enable/disable bars and background coloring based on trend
enable/disable a Filter Noise option, which reduces overtrading
enable/disable a Trailing Stop option
enable/disable/config a Take Profit option, with Re-Entry
enable/disable a secret Smart Close Option which may improve profit on your chart (again, check it on you chart if it helps or not)
This strategy only trigger 1 buy (where to start a long trade) or 1 sell (for short trade). If you enable Take Profit / Stop Loss option, consider that many TP can be triggered before trend reversal, so take partial profit on every TP an eventually buy/sell back lower/higher on RE-ENTRY signal to maximize your profit.
Strategy results are calculated on the time window from December 2019 to now, so on more than 7 months, using 1000$ as initial capital and working at 1x leverage (so no leverage at all! If you like to use leverage, be sure to use a safe option, like 3x or 5x at most in order to have liquidation price very far).
This is not the "Holy Grail", so use proper money and risk management strategies.
In order to get notified when a signal is triggered, you need to use the "alarms" version of this indicator (just search for astropark's "ALGO Trading V2.2 - ETH" indicator and choose the one with "alarms" suffix).
This is a premium indicator , so send me a private message in order to get access to this script.
[astropark] ALGO Trading V1.2 [strategy]Dear Followers,
today another awesome Swing and Scalping Trading Strategy indicator : the upgraded version of ALGO Trading V1 for Binance Bitcoin PERP on 15m timeframe!
It is runnable on a bot , just write me in order to help you do it.
If you are a scalper or you are a swing trader, you will love suggested entries for fast and long-lasting profit.
Keep in mind that a proper trailing stop strategy and risk management and money management strategies are very important (DM me if you need any clarification on these points).
This strategy has the following options:
enable/disable signals on chart
enable/disable bars and background coloring based on trend
enable/disable a Filter Noise option, which reduces overtrading
enable/disable a Trailing Stop option
enable/disable/config a Take Profit option, with Re-Entry
enable/disable a secret Smart Close Option which may improve profit on your chart (again, check it on you chart if it helps or not)
This strategy only trigger 1 buy (where to start a long trade) or 1 sell (for short trade). If you enable Take Profit / Stop Loss option, consider that many TP can be triggered before trend reversal, so take partial profit on every TP an eventually buy/sell back lower/higher on RE-ENTRY signal to maximize your profit.
Strategy results are calculated on the time window from December 2019 to now, so on more than 7 months, using 1000$ as initial capital and working at 1x leverage (so no leverage at all! If you like to use leverage, be sure to use a safe option, like 3x or 5x at most in order to have liquidation price very far).
This is not the "Holy Grail", so use proper money and risk management strategies.
In order to get notified when a signal is triggered, you need to use the "alarms" version of this indicator (just search for astropark's "ALGO Trading V1.2" indicator and choose the one with "alarms" suffix).
You can check out previous ALGO Trading V1 indicator here below:
This is a premium indicator , so send me a private message in order to get access to this script.

Ehlers Bandpass FilterThis script uses @cheatcountry script to determine Ehlers Bandpass Filter.
Backtest offers 3 capital management tools. One that will always calculate order size as initial capital/close, one that uses the same calculation but adds or substracts profit. The last one allows you to enter manually the size you want to trade.
The time-based stop will close the position after a set number of bars.

BlueFX Strategy We are re publishing the script so the Script Title doesn't display the old version number, to stop further confusion with our members.
This title will now remain constant, until you click into the strategy and the latest version number will be shown.
The previous release notes below are copied from the previous descriptions with the release note updates shown.
Hi Traders,
I hope everyone is great - its a long one - but worth the read, I promise....
Firstly, thank you to our members for being patient with this release - it took longer than anticipated but now with even more functionality too - and some improved profitability in back-testing on our H1 time frame especially - explained further below.
Secondly, thank you to the individuals that have made this happen - you know who you are! Sounds like an Oscar speech right.... sorry.
This tool we believe really does change the game - please read on to find out more.
As a brief reminder this builds upon on initial V1 and V2 indicator/scripts ...
The strategy itself
Our strategy will help you identify the current trend in the markets and highlight when this is changing. The strategy itself is based upon 4 indicators lining up in total confluence to increase the probability of the trade being a success.
Absolutely no technical analysis is needed to trade this successfully - this can be used on all time frames and all pairs - obviously with varying profitability as all pairs work differently - this can be reviewed quickly in 'Strategy Tester' to hone in on your own desired settings.
When all criteria is in alignment the strategy will convert all candles to the relevant colour - Green for an uptrend and Red for a downtrend; a candle that is printed normally simply shows that no current trend is in place to warrant a colour change. A normal coloured candle could possibly indicate a change in current market direction or the market consolidating before a further move in the initial direction.
When a new signal is valid, 'Blue FX Buy'' or 'Blue FX Sell' will be displayed and the small arrow shown on candle open for entry. (*Now along with Entry Price (EP), Stop Loss (SL), Take Profit (TP) and Lot size that is based on the risk parameters you have set personally on V3)
Version 2 was created with H4 confluence built in and also a display of a suggested Stop Loss (SL) and multiple Take Profits (TP's) on the H1 (One Hour) time frame - thus making your entry even easier and your SL more reliable - these suggested SL's and targets were based on the ATR of that pair at that time - a popular choice amongst traders - automatically built in.
What is a Trading View Script?
A script is like an indicator but better, we can prove the success of our strategy by using Trading Views strategy tester function. As shown below and on the chart - you can see the 'Buy' and 'Close Buy' on the chart, supported by a live trading log showing you the entry, entry price date, volume and closing price.
This is a great function for numerous reasons; firstly, you know you are using a profitable strategy, secondly you can use this as a trading journal to support your trading too. This in itself can help you with your trading psychology - letting winning trades run is a prime example of this. Take confidence in the statistics and performance over time.
Ultimately, we believe we have saved YOU the need to firstly, find an edge and a strategy - and all of the time it takes to BACKTEST a strategy - to then find it may or may not work - and then you start again!
Well guess what?
We know this works and it takes you seconds to see it.
Everyone can see the statistics themselves for 2020 to date (and previous!); an account gain of over 500% if you managed to catch all trades risking 1% per trade. I understand that catching all trades is difficult but even if you caught a third, that's still not too bad right?
Disclaimer alert; Please remember past performance is exactly that - how our strategy performed over those dates tested, it is not obviously a guarantee of future performance.
Even better, you/we can still hone in these settings to find an improved performance per pair on any given time frame and money management plan. (We are currently looking into automating this process too)
Default settings are set for use with the H1 time frame - no extra confluence checking is needed with these settings.
So what are the specific changes I hear you ask?
- Visibility of the SL and TP labels across all time frames.
- Visibility of all previous SL and TP labels with the click of a button (Prev. was only 2).
- Proof of the profitability of the strategy - we had this in V1 but this was based on trend following with the exit - we didn't in V2 when we added the SL and TP display function.
- The ability to customise the parameters and see the instant impact of the desired pair/time-frame and testing date range - of course some work better than others and will do at different times - once we have found a way to test this in an automated way we could look to do this monthly/quarterly to ensure we are using 'optimal' parameters at all times.
- Another game changer here is the addition of a lot size calculator - set your balance, set your risk and the LOT SIZE you should be trading will appear as if by magic - no need to use any other tool to do this. For inexperienced traders and especially trading stocks/ gold / commodities we suggest you check the contract sizes first as some brokers may operate differently. This visual cue will help ensure you are managing your risk and save you time in checking the right Lot Size for your trade (every pair has a different pip value and every trade a different SL).
- Although not required in our H1 settings currently - we have added more higher time frame confluences - which can improve the profitability of different pairs on different time frames in testing.
- As our tool can be used across all instruments we have a pull down menu for Crypto/Metals/Stocks/ Commodities , etc.
- The option to also test fixed lot size or percentage - see the benefit of compounding right away.
- The option to turn the testing function on and off.
Let's see an example......
An example trade - display Entry, SL, multiple TP, lot size and contract size.
snapshot
We have deliberately set the TP3 to be an increased target, this way we can capitalise on a large move in the market, should the move reverse and the opposite signal appears we close the trade anyway and follow the new signal.
I am unable to add other pictures in this Script description - but we will include in our Public channel and update our website to show them over the coming days.
I hope you can all see the functionality in this tool, the profitability in historic tests and how it can be used to give you your edge.
How do you access this I hear you ask?
Please visit our website for signup / purchase information in the first instance (the link is on our trading view profile / signature) or send us a private message on here - its impossible to keep track of comments on our posts so to ensure we don't miss you, a private DM will be great please.
Thank you for reading, we hope you choose to join our vastly growing community.
Kind regards
Darren
Blue FX
Jun 14
Release Notes: Default settings have been improved, providing a 600% gain YTD in back testing with less trades too.
Jul 4
Release Notes: Trend filter using ADX - our strategy is based on a trending market, adding the ADX filter to our strategy allows us to remove trades under the threshold level set. Previously - we tried to teach our members how to spot the ranging markets to help further increase their successes (although the stats were not based on any manual intervention) - now they don't have too.
Specific parameters set into the code - detects the pair and TF to shown them automatically - our method has been solid YOY growth based on a fixed 0.01 lot size to gain consistent yearly consistent results.
Trade volumes substantially reduced with a much higher win rate - due to the specific parameters and ADX filter.
No pull down menu when flicking between instruments - all done automatically; making it easier for trades flicking between trading instruments.
More TP options for testing - we have TP1/2/3 and other variables including FT (Follow Trend) / FT + SL (Follow trend with Stop loss) / TS (Trail Stop function)
Smaller labels showing entry, SL and TP, etc - much clearer on screen and on your app.
Lot sizes fixed - we had a previous bug affecting some currencies - as always where money is involved and managing risk, ensure you check and are comfortable this is correct of course
Filter for days of the week - some pairs hate specific days, a great tool, see how removing Fridays affects the performance in seconds.
Back testing on all instruments - not previously available - trade stocks like Tesla or Lloyds - or indices? We can give you back testing data for them all.
Filter for trading sessions - like the days of the week - if you are only trading London and US sessions, back testing data for other sessions is pretty pointless - now you can remove them too!
If you wish to just stay with the default V3 settings its simple, turn 'Use pre-defined parameter?' Off - and turn off ADX - your chart will then look like the initial v3.0 strategy anyway. However, every pair has improved performance we have found when including ADX - each pair is affected differently with a higher or lower ADX Threshold - this is parameter #9.
I don't think there is much more that can be added now - fuelled by our ambition - to provide our members with an easy yet profitable trading strategy for both beginner or experienced trader. We have this at the forefront of our minds when adding and reviewing functions.
Follow the trades, stay disciplined and don't focus on the money. Focus on the 'process' of following the strategy, its much easier on your mind too. Far easier following instructions than trying to do something without - follow your plan, the process and the money will follow.
If you wish to see all of the back testing data for each pair - hop into our Discord Server and check out the #public-backtesting-channel - all of them will be there when I post them tonight.
Jul 5
Release Notes: Another quick update.
More days of week added - Sat and Sunday trading sessions - (Sat - just crypto is open on TV)
Also a specific setting for trading just a certain time of day - this is based on EST time you will will need to convert back to your time zone for this to work.
For example, if you would like to test trading EURUSD between 7am and 11am - you will need to find the EST time for this which is 2am to 6am, you will then see these trades in the list of trades section. This is ideal for scalping certain sessions where all trades will be open and closed promptly.
I use the 'Time Buddy' app for this as its quite straight forward.
Regards
Darren
18 hours ago
Release Notes: Update - correcting the entry price label error.

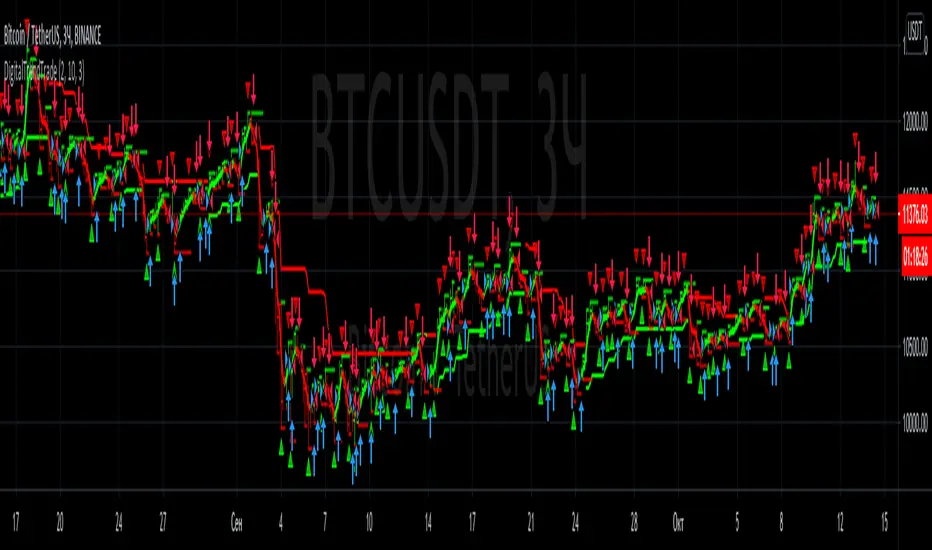
DigitalTrendTrade | 0.3The Digital Trend Trade trading strategy is designed for trading both local and global trends, as well as for displaying floating and fixed support levels and identifying price extremes.
The strategy consists of several main elements:
Global Average - On the chart, GA is displayed as the average price line, showing the current local trend direction with its color, as well as edging the bars to the trend color. Generates a signal when the local trend changes.
Global Trend - The second element of the strategy indicator is Global Trend, which forms the key support and resistance levels, when breaking through which the global trend changes and the corresponding signal is formed.
Bill Williams Fractal Levels - And the third element is the Bill Williams Fractal Levels block, which primarily fixes local extremes that can be used for scalping, as well as for setting a take profit and stop loss for a trade.
Support and resistance levels are also formed from local extremes.
To get access to the indicator, contact us via private messages.
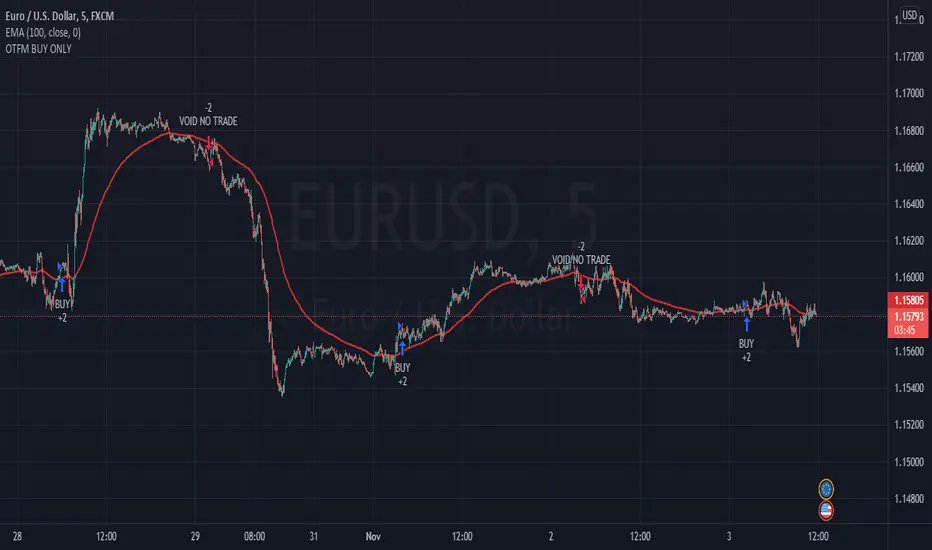
OTFMWHAT TYPE OF MARKET TO USE?
OTFM mainly uses for any forex pairs typically for scalping or Options with short-term expiry time such as hourly expiration.
HOW IT WORKS?
OTFM indicator uses a combination of moving averages and trend analysis to trigger a BUY (blue arrow pointing up) or a SELL (red arrow pointing down) signal. When certain condition is met, it will immediately pop up an alert signal for you to take. It will trigger with all types of market condition. There is no repaint since it is based of the previous closed candle.
HOW TO USE?
When the signal triggers a “BUY” or “SELL” you want to wait for that candle to close and then you enter the next candle as your entry. If you’re trading binary options, you want to take the OTM (Out the Money) contracts for low risk/ high reward and take profits once the market is going in your direction. This indicator works best when you scalp and not hold till expiry. You want to leave room for your hourly expiration typically within one hour or 2 hour. This will avoid any market reversal if it decides to go South. You can turn on push notification on your phone so you won’t have to miss any signals.
This indicator is a monthly subscription. If you’re interested in a one week free trial for testing. PM me to access the OTFM.
Trend plus !!
This script is like a toolbox for me. I don't use its long & short signals,but with default setting it's suitable for scalping in 1 minute chart in the direction of the trend.. its easy but you need to learn how to use it!!!!
so what do we have in it?
2 ema lines
1 sma line
2 wma line
1 hullma line
4 vwap line
bolinger bands
ichimoku
.....

PS3X Strategy TesterPS3X Strategy Tester is a completely new strategy built from the ground up as a successor to previous 1.0 and 2.0 versions of Profit Sniper.
Offering up huge improvements, including multiple position triggers, derived from Bollinger Bands and Chande Momentum as well as our own bespoke stochastic ribbons that provide trend pivots.
So how does it work?
PS3X Strategy Tester allows you to tailor your preference for waiting for either Stochastic Ribbon cross only, Ribbon Cross followed by Chande Confirmation, or Ribbon Cross followed by rising/falling MACD for additional market structure confidence.
Strategy exits can be configured to exit on % change of MACD histogram indicating a direction change, and additionally using our revolutionary "Profit Lockin" to provide a stepped lock in of profits according to your preferred risk strategy. Commision of 0.05% has been added to represent "limit in-market out" trading, but please tailor this again to your preferred trading approach.
If you would like access, please send me a PM.

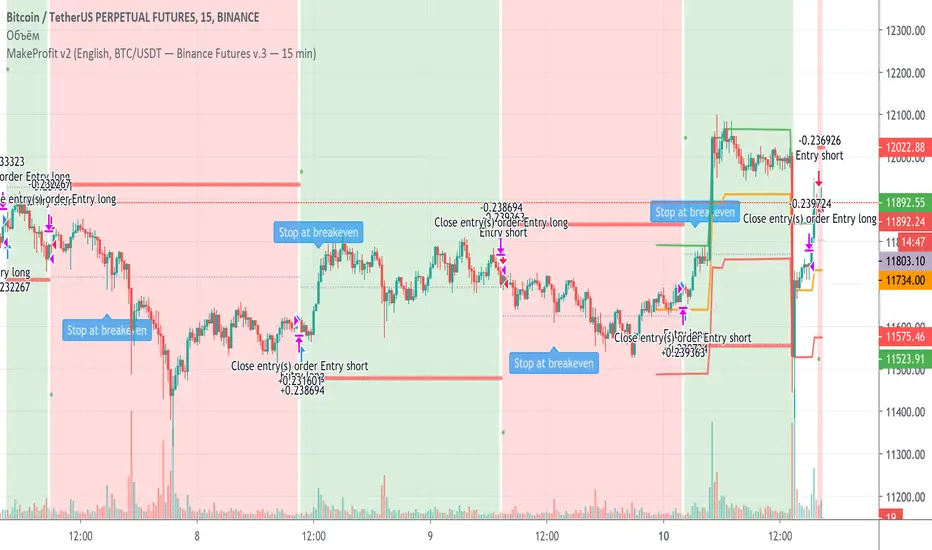
MakeProfit v2The Make Profit Club team has developed a new generation indicator that allows you to choose certain strategies calculated by us at a distance and simply enter a position based on our signals with our algorithms
Each partner who is trying to make money on the stock exchange shall from part of trust not only to us but to your head before you start earning.
We added the most popular strategies for Bitcoin and altcoins to the indicator, but we also didn't forget about currencies like EUR/USD and EUR/USD/RUB.
The indicator additionally works with scalpel levels, which you can buy back (as well as trade in the specified scalpel corridor).
Not only scalping strategies are included, but also trend trading. Let's say that the 45-minute strategy on bitcoin gave almost 700% of the profit for 45 weeks (1-4 hours and 1 day are also available).
For the most unintelligent, we have added entry levels, exit levels, levels where you can enter a trade if you do not have time for the signal, and many other features that you will not find anywhere else.
We will constantly add new strategies and improve our own.
You can get test access by contacting me.
Команда Make Profit Club разработала индикатор нового поколения, позволяющий выбрать определенные стратегии, просчитанные нами на дистанции и просто входить в позицию по нашим сигналам с нашими алгоритмами
Каждый партнер, который пытается заработать на бирже должен от части довериться не только нам, но и своей голове, прежде чем начать зарабатывать.
В индикатор мы добавили самые ходовые стратегии для Bitcoin и altcoins, но и не забыли про валюты по типу EUR/USD and EUR/USD/RUB.
Индикатор дополнительно работает со скальповыми уровнями, по которым вы сможете докупаться (а также торговать в указанном скальповом коридоре).
Включены не только скальповые стратегии, но и торговля по тренду. Допустим, стратегия по 45 минут на биткоине дала почти 700% прибыли за 45 недель (доступны еще и 1-4 часа, и 1 день).
Для самых несообразительных мы добавили уровни входа, уровни выхода, уровни, где можно зайти в сделку, если не успели по сигналу и еще очень много других функций, которых вы нигде не найдете.
Обратившись ко мне, вы можете получить тестовый доступ.
Fibonacci + RSI - StrategyStrategy: Fibonacci + RSI:
- Intraday trading strategy (Scalping).
Time Frames Tested with best Results:
30 Minutes.
5 Minutes.
15 Minutes.
1 Minute
Indicators Used:
RSI (30 / 70)
Fibonacci (1 - 0.784)
How it Works:
Once the Price Hits the 1 or -1 Fibonacci Level and bounces a little bit, It checks the RSI if Over Bought or Over Sold According to 30 - 70.
If both conditions are satisfied, it triggers a Long or Short Positions.
Further Notes:
- I have put a Stop-loss with a 2% just for further upgrades.
- Not advised to use in High Volatility Markets.
- No Repaint was observed during a 2-Weeks Tests.
If you have any suggestions or modifications please contact to add.
If you have observed any bad behavior please contact to fix.
Trade wisely.

OHO Trading Nifty50 15 Min 07.05.2020 IndicatorStudies Used:
We have used different type of moving averages, average true ranges, pivot points and relative strength indicator in this indicator.
Usage:
It can be used for scalping and intra-day trading. It works best on Nifty 15 Minutes time frame.
It provides easy to visualize multiple information:
1) It gives the correct Entry on Time.
2) Fake trends are shown on purple color of trend line.
3) Target levels.
4) It gives proper Exit on time. or Exit at the time of closing.
5) Trailing as per trend line.
How to read OHO Indicator?
Trend line color:
Red = Sell side trailing
Green = Buy side trailing
Purple = No trade zone or Trend Changing Time
Recommendations:
Trade is recommended to be closed when price is below UpTrend line (in case of buy side trade) or it is above DownTrend line (in case of sell side trade)
What time frame should I use?
15 Minutes is best time-frame, But you can check different time-frames in Strategy Testing section or as per your requirements.
Disclaimer:
Past performance is not the guarantee of future performance.
Best Indicator for range bound and volatile sessions.
For any type of queries kindly send us personal message.

BTC 5 min + ATRThis STUDY is optimized for bitcoin ( BTCPERP on deribit)
It catch fast trades going with the trend, so it should work in trends like in consolidation.
This strategy is based on S/R mixed with parabolic SAR , the point is to catch a movement when it's starting and confirmed.
It's optimized for 5 min timeframe, you might try it on other other tf but change the SL/TP too.
You should used it for few minutes scalp, fast enter and exit, on 5 min TF.
UPDATE ! This time it usenormal candle
The new idea is to filter trades by ATR, and by this way to NOT trade consolidation.
Have fun :)
Rules:
- Use small position, max leverage x5
- Place TP between 70$
- Place SL at 50$
- Entre in position by limit, you get paid for it
Enjoy, test it and make some money :)
No repaint.

KundaliniThe Kundalini is a technical indicator. Based on algorithm calculations, this indicator extrapolates the previous price for the next bar. Plus addition Multi time frame ATR volatility Reading environment for higher conditions
Here is how Dominator is calculated:
1. The study estimates the price projected for the next bar. The estimated price is based on the algorithm method.
2. The study extrapolates this value to find a projected price change for the next bar.
The resulting extrapolated value is shown as a histogram on a lower subgraph. By default, sections of the histogram where the extrapolated value is increasing are shown in green; sections corresponding to the decreasing value are shown in red.
Note: Value projection is purely mathematical as all calculations are based on algorithm averaging of previous values.
Overlay True
The strategy includes 3 different adjustable levels for the ladder , plus automatic adjustable stop loss and takes profit calculated from your average entry price after each ladder adds.
Adjustable BAcktest Window.
1 long signals
3 ladder long add signals
1 short signals
3 ladder short add signals
1 dynamic stop calculated from your average entry price
1 dynamic take profit calculated from your average entry price
Please Private Msg me if you like more info about the script Full pdf available or if you need access to it
thx for your time and support