PA High Frequency TradingThis is PA High Frequency Trading Strategy
High Frequency Trading
5min Scalping Strategy
Search in scripts for "scalping"

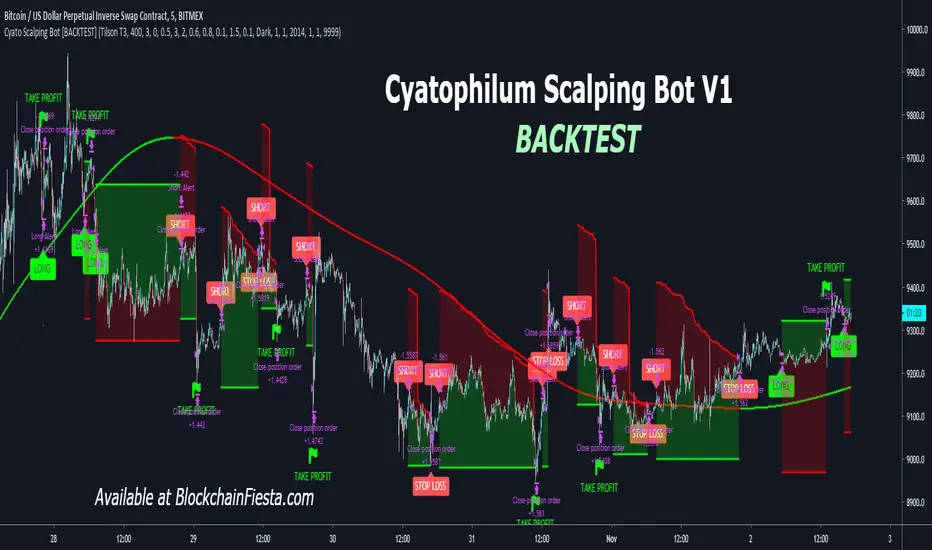
Cyatophilum Scalping Bot [BACKTEST]This indicator triggers Short or/and Long entries and exits.
Example with a Long trade:
The integrated stop loss will trigger an alert to exit the trade.
It is possible that a trend reverses during a trade.
In this case, the "LONG EXIT" alert will trigger at the same
time as the "SHORT ENTRY".
The Trend Detector feature, using EMA or Tilson T3 will filter trades that are against the main trend and thus increase profitability.
BONUS FEATURE
Trailing Take Profit with configurable % deviation.
SAMPLE USE CASES
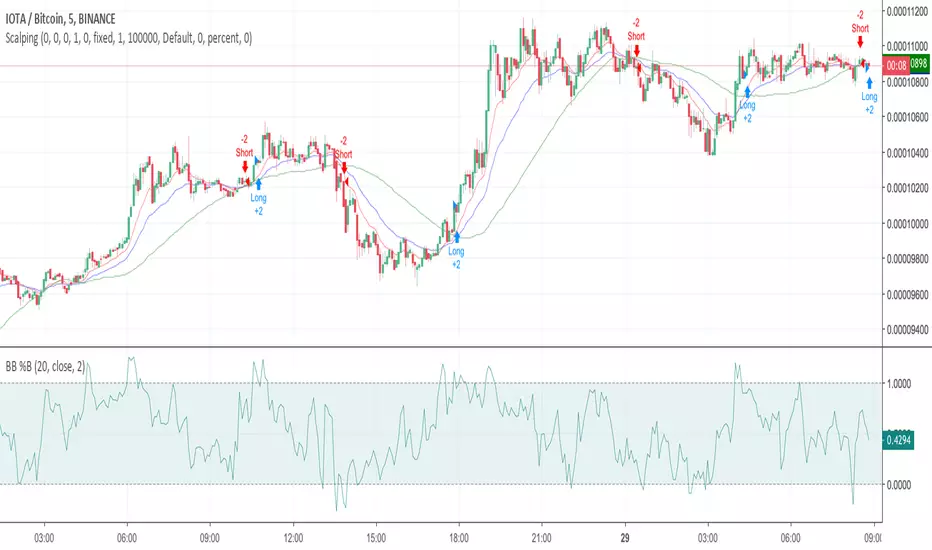
ETH/BTC
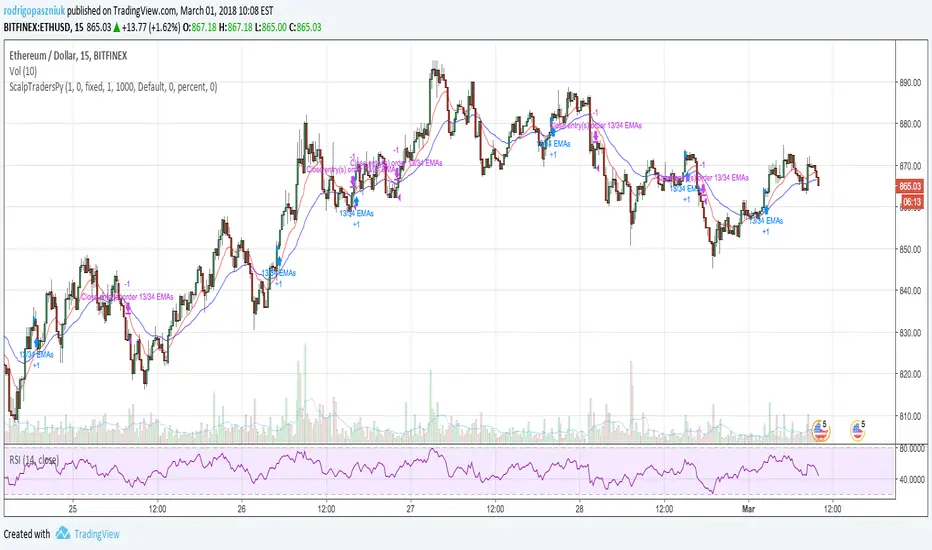
ETH/USD
FOREX: GBP/USD
FOREX: XAU/USD
BTC/USDT
LTC/BTC
XRP/BTC
Read More
> Get access to the Cyatophilum Indicators <
Mossy ADX and DI with Buy/Sell SignalsBasic ADX DI with colored bars to show buy and sell signals , made for 1min but shows general signals of strong or weak buy and sell signals.
Dark Red = Heavy Signal
Light Red = weak signal
Green = buy signal
Dark Green = Heavy Signal
Colors are to confirm or warn, Buy/Sell points are where to enter and exit.
Mossy ADX DI colored bars for quick scalping, works best with Heikin Ashi, confirm with other indicators, Mossy Pop is one shown and works well to confirm.

Oscillator Based Scalping (Forex Majors)This is a scalping strategy based on oscillator divergences.
Tested on ForexICE market data.
Signal might appear and disappear during candle making since it is based on Moving Average and therefore acts on close, but since candle closed signal is final and does not repaint.
1M timeframes is recommended for bot trading. 5M-15M is more suitable for manual trading.
Full list of tested intraday timeframes below:
EUR-USD - 1M-5M-15M
USD-JPY - 1M-5M
GBP-USD - 1M
AUD-USD - 1M-5M-15M
USD-CHF - 1M-15M
NZD-USD - 1M-5M-15M
USD-CAD - 1M-5M
There is 2 more similar trading strategies that im finishing now, 1 for BITMEX ETHUSD and XBTUSD contracts, and 1 for bitmex alts. Should be ready in a day or two.
Additional notes on executing trades:
-Trade should be entered as close to sell signal as possible. You can enter at market at red circle candle or at limit at top of sell signal candle. In both cases your target is red Moving Average and entering at market just makes overall R/R for a trade is lower yet limit order might not always get filled.
-This strategy doesnt have a defined stop loss by itself, but your target is a moving average and 1-1 risk reward should be enough. Although the win rate is much higher than 50% so you can be less greedy if you feel like playing it safer.
-Strategy itself uses pyramiding, so i would recommend averaging up if you get 2-3 consecutive sell signals above moving average.
-It is assumed that you have OANDA spread rates or better.
-- Free trial for 24 hours. Contact me here or at twitter.com --


Renkonator 5000www.dropbox.com www.dropbox.com
Renko scalping strategy. Paid TV subscription required to use Renko candles. For use with forex, crypto, stocks, anything, on any TF. Primary variables to tune are TF and Box Size (use Traditional setting).


SMA_CrossThis strategy is a variation of standard sma cross that comes as default with pine script
The idea is to NOT wait for a cross between fast and slow moving averages but to anticipate it considering the distance between the two MAs
Strategy can be used also for scalping, just need to be optimized for low tiime frames as 1 minute or 5 minute.
TIP: stay far from resistance and supports. I use my script "LCS/HCR Support and Resistance multi timeframes" to easily identify major supports
and resistance areas (note that I said areas and not lines).
Thanks to ChrisMoody: I used his code snippet for switching between various moving average types and calculation of TEMA and HULL ma.
Next improvements:
- money managment
- self optimization
- convert to study with alerts
This strategy is free to use but code is private. If you like or have question please use comment section.
Check also my other scripts at www.tradingview.com .
Thanks for your feedbaks.


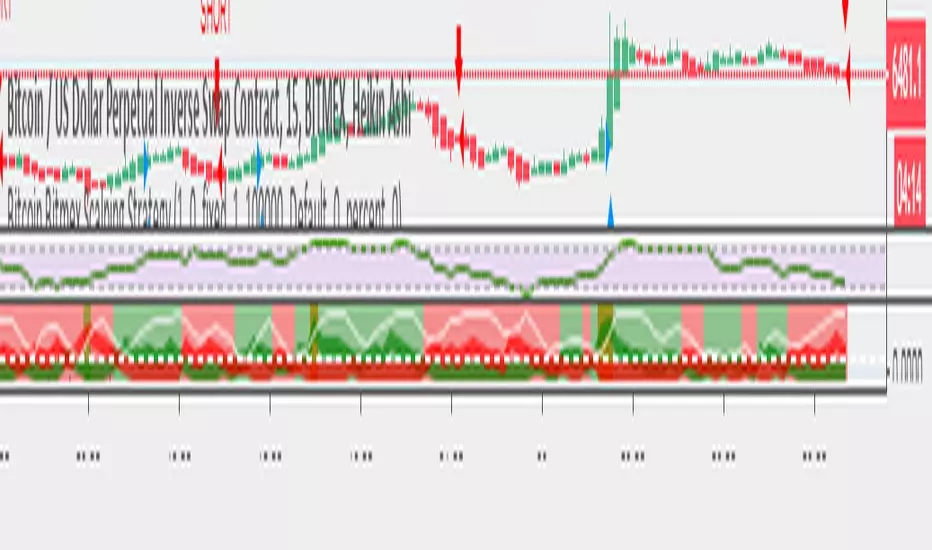
Heikin Ashi Margin Scalping script for BitmexA script made for a lot of trades (scalping) and good solid profits on the Tested and it generates very attractive profits. Test it for yourself.
- Made for BITCOIN / US DOLLAR PERPETUAL INVERSE SWAP CONTRACT XBTUSD on Bitmex.
- Only 40% of these trades are profitable, but within this 40 percent, it catches all the spikes and lows. And therefore a lot more profit then loss. The most loss is generated at the moment BTC is falling still and there is not a lot of volatility.
- I use it to create alerts and sent these to my bot, so i don't have to do manual trading.
You can ask for access and try this strategy for yourself for 5 days. When you are convinced and want to have the script with alerts to be shared with you, I ask for a small donation of 0.02 BTC. This allows me to create other scripts and to improve this script.
I only sell this script to 50 people, so that it remains exclusive.

Bitcoin Bitmex Scalping StrategyIf you are not greedy and just want 20-30 points gain then this strategy can give more then 90% accurate calls. Once you enter the trade place your sell order 20-30 points above/below your order or use trailing stop loss.
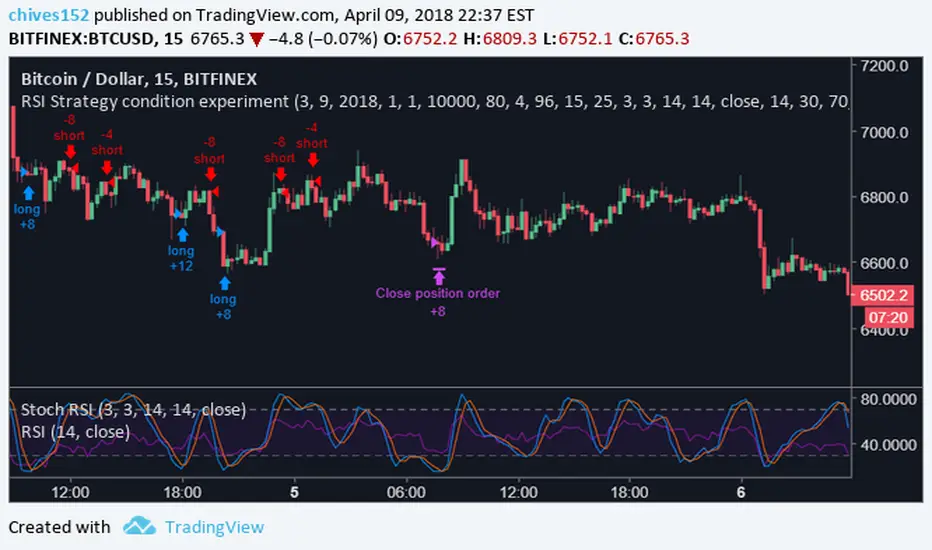
RSI Strategy condition experimentThis is a scalping indicator built for bitcoin on the 15m chart. It uses ADX and SRSI. A full indicator will be released very soon. Please comment with any questions or comments. The strategy ran below is the results if you started trading on 3/9/2018 with 10,000$ usd, and used 100% of your equity to enter positions. This is also designed to allow 2x leverage when certain conditions are met, which is the default. This feature can be turned off in settings.
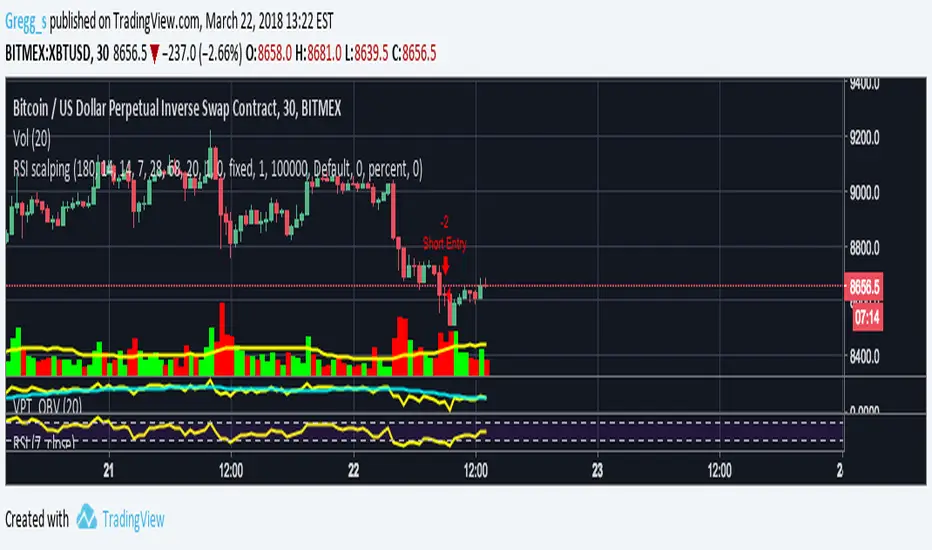
RSI scalpingLook for trending market on higher timeframe with ADX and SMA
Scalping with rsi shorter time frame

US100 Liquidity Precision StrategyScalping strategy 5-10 point sl / 17 points tp
Automatic BE
Consistent money over time

Scalping Krown Cross w/ VolitilityThis strategy attempts to capture market gains from short-term market volatility.
Strategy inputs:
BBWP
PMARP
Jewel Lite
Strategy entry criteria:
KC downside cross 21/55
BBWP MA down trend
Jewel lite > 62
Jewel lite first tick white upon closure
Strategy risk management:
PMARP < 15 on closure
NOTES:
Code for the Jewel Lite is not open so I've implemented my own version. It's not an exact match, but you can see it on the example image plotted alongside the Jewel Lite to see how close it is.
FUTURE IMPROVEMENTS:
I may work to align my Jewel Lite with the original to see if that provides better results.
CREDIT:
Caretaker - BBWP, PMARP
Krown - strategy idea

Leco Price ChaserScalping Strategy with one pyramiding entry only that chases the price movement using MACD, Stochastic and RSI with EMA. The pyramiding entry size rely between the gap on the strategy price and the close bar. Goes pretty well and I apreciatte any comments

Scalping EURUSD, GPBUSDShort-term trading strategy on the M5 frame, looking for excessive areas of the price to enter orders. Exit before the price reaches the next overextended area.
Only trade from the Asian session to the end of the American session.
Example using 25000 contract size with EURUSD , slippage is 1 and commission per order is 0.9$ with actual capital of 10000$, you can adjust other contract size for other pairs to consistent with reality.

Scalping Dips On Trend (by Coinrule)Coinrule's Community is an excellent source of inspiration for our trading strategies.
In these months of Bull Market, our traders opted mostly on buy-the-dips strategies, which resulted in great returns recently. But there has been an element that turned out to be the cause for deep division among the Community.
Is it advisable or not to use a stop-loss during a Bull Market?
This strategy comes with a large stop-loss to offer a safer alternative for those that are not used to trade with a downside protection.
Entry
The strategy buys only when the price is above the Moving Average 50 , making it less risky to buy the dip, which is set to 2%.
The preferred time frame is 1-hour.
The stop-loss is set to be quite loose to increase the chances of closing the trade in profit, yet protecting from unexpected larger drawdowns that could undermine the allocation's liquidity.
Exit
Stop loss: 10%
Take Profit: 3%
In times of Bull Market, such a trading system has a very high percentage of trades closed in profit (ranging between 70% to 80%), which makes it still overall profitable to have a stop-loss three times larger than the take profit.
Pro tip: use a larger stop-loss only when you expect to close in profit most of the trades!
The strategy assumes each order to trade 30% of the available capital and opens a trade at a time. A trading fee of 0.1% is taken into account.