KillZones + ACD Fisher [TradingFinder] Sessions + Reversal Level🔵 Introduction
🟣 ACD Method
"The Logical Trader" opens with a thorough exploration of the ACD Methodology, which focuses on pinpointing particular price levels associated with the opening range.
This approach enables traders to establish reference points for their trades, using "A" and "C" points as entry markers. Additionally, the book covers the concept of the "Pivot Range" and how integrating it with the ACD method can help maximize position size while minimizing risk.
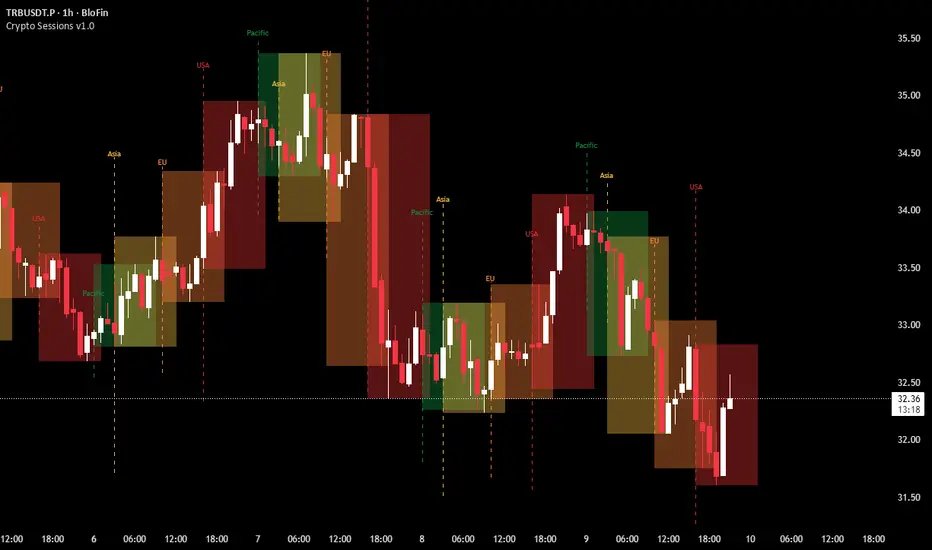
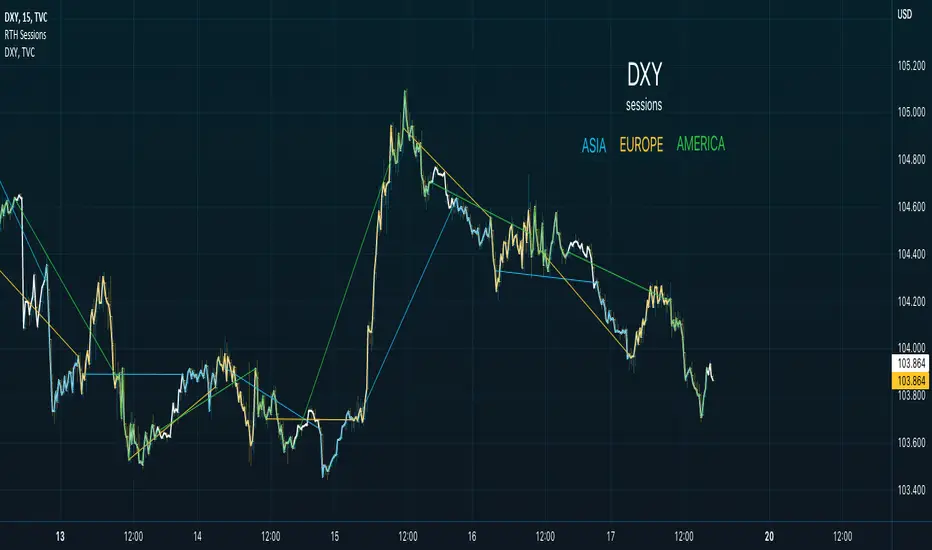
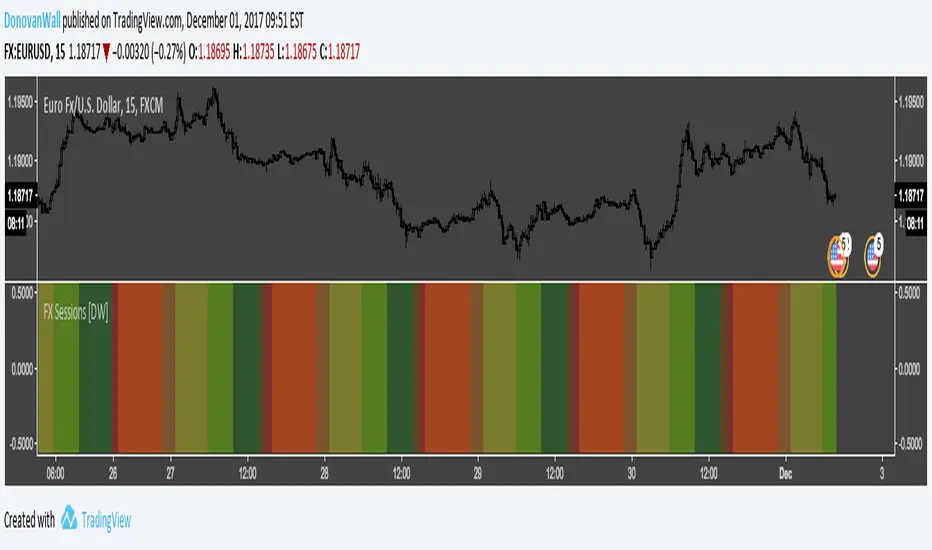
🟣 Session
The forex market is operational 24 hours a day, five days a week, closing only on Saturdays and Sundays. Typically, traders prefer to concentrate on one specific forex trading session rather than attempting to trade around the clock.
Trading sessions are defined time periods when a particular financial market is active, allowing for the execution of trades.
The most crucial trading sessions within the 24-hour cycle are the Asia, London, and New York sessions, as these are when substantial money flows and liquidity enter the market.
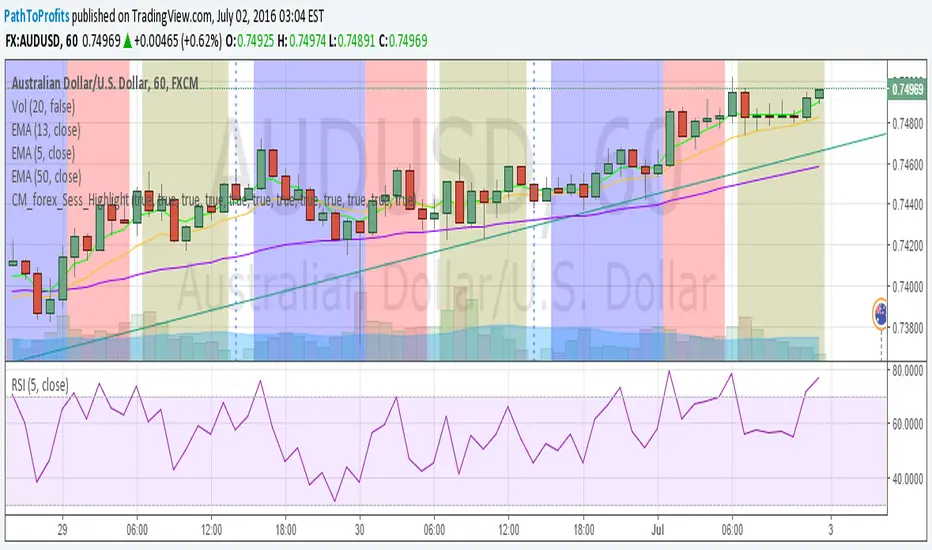
🟣 Kill Zone
Traders in financial markets earn profits by capitalizing on the difference between their buy/sell prices and the prevailing market prices.
Traders vary in their trading timelines.Some traders engage in daily or even hourly trading, necessitating activity during periods with optimal trading volumes and notable price movements.
Kill zones refer to parts of a session characterized by higher trading volumes and increased price volatility compared to the rest of the session.
🔵 How to Use
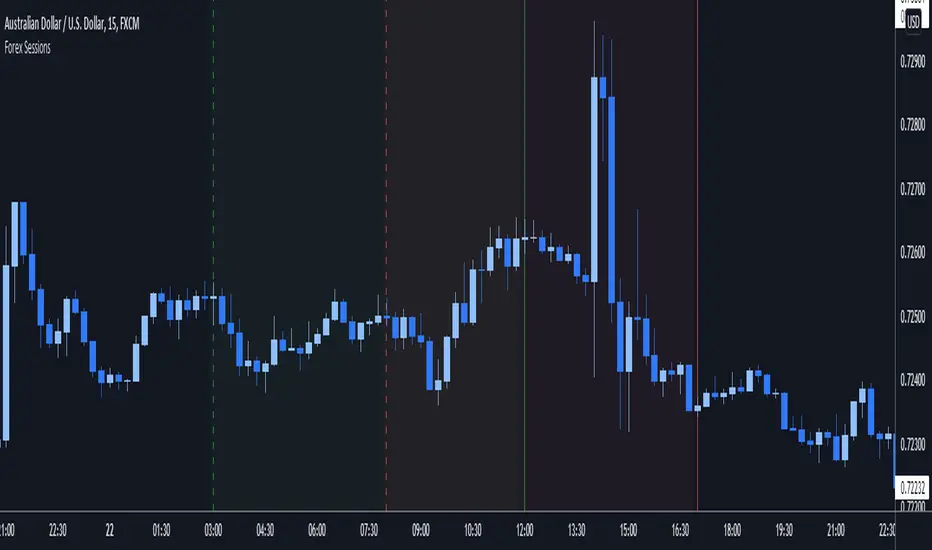
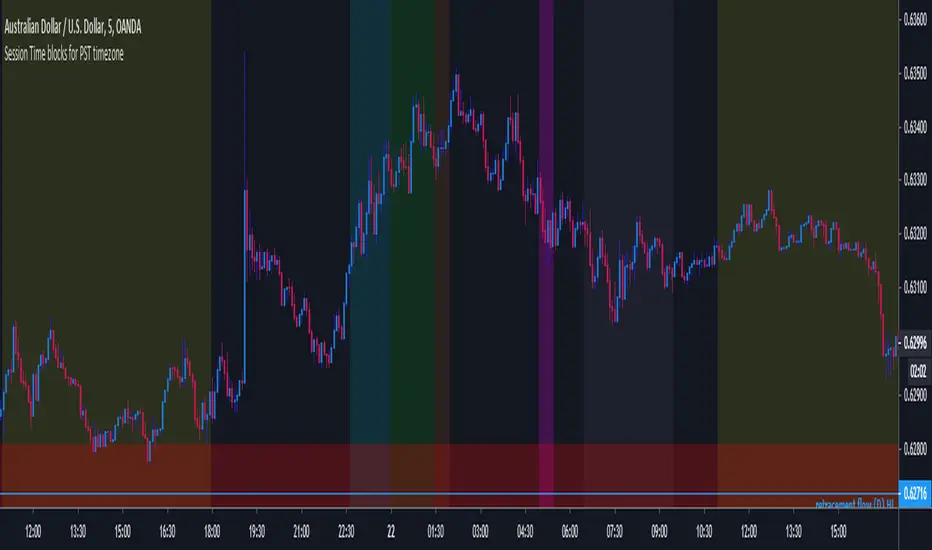
🟣 Session Times
The "Asia Session" comprises two parts: "Sydney" and "Tokyo." This session begins at 23:00 and ends at 06:00 UTC. The "Asia KillZone" starts at 23:00 and ends at 03:55 UTC.
The "London Session" includes "Frankfurt" and "London," starting at 07:00 and ending at 14:25 UTC. The "London KillZone" runs from 07:00 to 09:55 UTC.
The "New York" session starts at 14:30 and ends at 19:25 UTC, with the "New York am KillZone" beginning at 14:30 and ending at 22:55 UTC.
🟣 ACD Methodology
The ACD strategy is versatile, applicable to various markets such as stocks, commodities, and forex, providing clear buy and sell signals to set price targets and stop losses.
This strategy operates on the premise that the opening range of trades holds statistical significance daily, suggesting that initial market movements impact the market's behavior throughout the day.
Known as a breakout strategy, the ACD method thrives in volatile or strongly trending markets like crude oil and stocks.
Some key rules for employing the ACD strategy include :
Utilize points A and C as critical reference points, continually monitoring these during trades as they act as entry and exit markers.
Analyze daily and multi-day pivot ranges to understand market trends. Prices above the pivots indicate an upward trend, while prices below signal a downward trend.
In forex trading, the ACD strategy can be implemented using the ACD indicator, a technical tool that gauges the market's supply and demand balance. By evaluating trading volume and price, this indicator assists traders in identifying trend strength and optimal entry and exit points.
To effectively use the ACD indicator, consider the following :
Identifying robust trends: The ACD indicator can help pinpoint strong, consistent market trends.
Determining entry and exit points: ACD generates buy and sell signals to optimize trade timing.
Bullish Setup :
When the "A up" line is breached, it’s wise to wait briefly to confirm it’s not a "Fake Breakout" and that the price stabilizes above this line.
Upon entering the trade, the most effective stop loss is positioned below the "A down" line. It's advisable to backtest this to ensure the best outcomes. The recommended reward-to-risk ratio for this strategy is 1, which should also be verified through backtesting.
Bearish Setup :
When the "A down" line is breached, it’s prudent to wait briefly to ensure it’s not a "Fake Breakout" and that the price stabilizes below this line.
Upon entering the trade, the most effective stop loss is positioned above the "A up" line. Backtesting is recommended to confirm the best results. The recommended reward-to-risk ratio for this strategy is 1, which should also be validated through backtesting.
Advantages of Combining Kill Zone and ACD Method in Market Analysis :
Precise Trade Timing : Integrating the Kill Zone strategy with the ACD Method enhances precision in trade entries and exits. The ACD Method identifies key points for trading, while the Kill Zone focuses on high-activity periods, together ensuring optimal timing for trades.
Better Trend Identification : The ACD Method’s pivot ranges help spot market trends, and when combined with the Kill Zone’s emphasis on periods of significant price movement, traders can more effectively identify and follow strong market trends.
Maximized Profits and Minimized Risks : The ACD Method's structured approach to setting price targets and stop losses, coupled with the Kill Zone's high-volume trading periods, helps maximize profit potential while reducing risk.
Robust Risk Management : Combining these methods provides a comprehensive risk management strategy, strategically placing stop losses and protecting capital during volatile periods.
Versatility Across Markets : Both methods are applicable to various markets, including stocks, commodities, and forex, offering flexibility and adaptability in different trading environments.
Enhanced Confidence : Using the combined insights of the Kill Zone and ACD Method, traders gain confidence in their decision-making process, reducing emotional trading and improving consistency.
By merging the Kill Zone’s focus on trading volumes and the ACD Method’s structured breakout strategy, traders benefit from a synergistic approach that enhances precision, trend identification, and risk management across multiple markets.
Pine Script® indicator