Hotch SessionSimple Session timer with separate session for Asia, Europe, and the Americas plus an extra custom session timer. each can be turned on and off separately.
The indicator also plots the highs and lows of each session.
This code was modified from the Session timer code found in the original "The Arty" by PheonixBinary but expanded to better include all trading sessions.
The code was written in a manner to be as compact as possible. I had looked at many other Session timers and found entire input sections that were longer than the entirety of this indicator.
Please feel free to use this code in any manner you choose permission not required.
Search in scripts for "session"

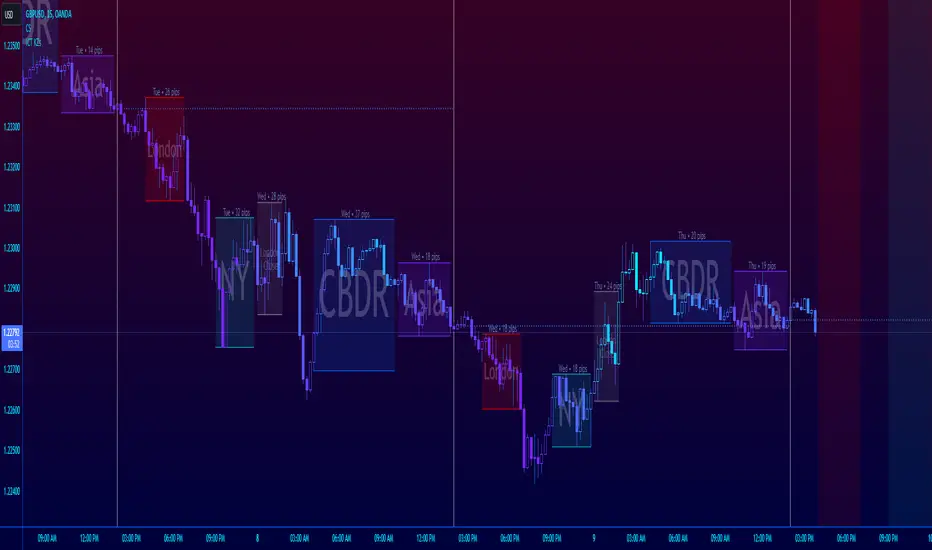
ICT Session Killzone Boxes & DeviationsICT Killzone Sessions Boxes & Deviations is a convenience indicator that marks out past and future ICT killzones for Asia, London, and New York, London Close and CBDR.
The boxes highlights the highest and lowest candle opens of that session/killzone, which is what the deviations are based on. Two lines mark out the highest high and lowest low of that session.
This indicator also includes New York midnight opening price and a vertical divider showing you that time.
Future killzones are also marked out.
All times are set to GMT-4 so these boxes should work across most exchanges. Times and code can be changed if a few don't match up.
Included are week of day labels for your convenience.
For those who are unfamiliar, ICT Killzones are optimal times to look for trades during or before a session, often providing entry for trades with orderblock tests, FVG fills or stophunts.
Please note: This indicator only works well on 1HR timeframe and below. The default max timeframe setting is set to 15min, which can be changed in the menu.
There may be some bugs so please highlight anything you find in the comments below :)
Shout out to @Ryazn for all the ideas!
Fusion: Forex sessions with daylight savingsThis has multiple ways to see Forex sessions as I found both on the main chart and on a separate chart useful at different times so this gives you the benefit of both.
When you want to use this separate from your main chart uncheck it the option "On main chart".
On the main chart we can show:
The legend
Boxes
Labels
Breakout check area
Start & end labels
On any other chart area we can show:
The legend
Horizontal bars representing the sessions.
All objects are color coded and the legend shows the color codes.
Credit:
Blended my own sessions indicator and "FX Market Sessions" by boidoki
The code is structured to easily drop into a bigger system so use it as a lone indicator or add the code to some bigger project you are creating.
Finally, if you find value please do make a comment, give thumbs up etc.
Enjoy and good luck!

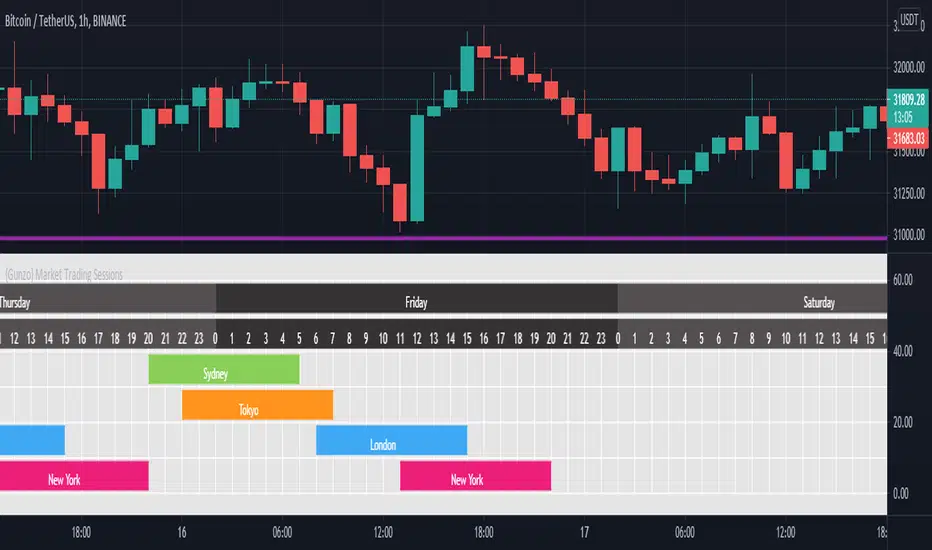
{Gunzo} Market Trading Sessions (Tokyo, London, New York)Market Trading Sessions is a tool designed to help traders to find the best times of the day for price action trading. It displays non-overlapping visuals for the major trading sessions : Oceania, Asia, Europe, and USA.
OVERVIEW :
This tool has been designed to match all the following requirements that I needed for optimal usage :
Display opening and closing of main markets
See clearly market sessions (non-overlapping colors)
Display Sydney session if wanted
Display GMT hours and days
Visually pleasing design and colors
Highly configurable
As I had trouble finding a script matching all these criteria, I created this tool and I'm sharing it with the TradingView community, hoping you will find it useful too.
SETTINGS :
Display market sessions on weekends : Display theoretical market sessions times on the weekend which can be useful for non forex markets.
Display session for Oceania\Sydney : Display "Oceania\Sydney" trading session
Display session for Asia\Tokyo : Display "Asia\Tokyo" trading session
Display session for Europe\London : Display "Europe\London" trading session
Display session for USA\New York : Display "USA\New York" trading session
Display session names : Display names of the session on the visual
Oceania color : Configurable color for the "Oceania\Sydney" sessions
Asia color : Configurable color for the "Asia\Tokyo" sessions
Europe color : Configurable color for the "Europe\London" sessions
USA color : Configurable color for the "USA\New York" sessions
Background color : Configurable color for the table background
Border color : Configurable color for the table borders
Text color : Configurable color for the table text
Header color : Configurable color for the table header (even days)
Header color (alternate) : Configurable color for the table header (odd days)
Simple Market Session by GavThis is a simple script to highlight market sessions.
It highlights Sydney, Tokyo, London, and New York sessions with transparent background colors.
You are able to change session times, color, and transparency.
Sessions with Opening/Closing, Multi timeframeSessions with Opening & Closing is a simple and lightweight TradingView indicator that automatically marks the opening and closing moments of the major trading sessions directly on your chart.
It visually highlights:
Asian Session
European Session
U.S. Session
Each session opening and closing is shown with:
A vertical line on the exact candle where the session starts or ends
A label showing the session name and whether it is an Open or Close
This helps traders easily identify session transitions, which are often associated with changes in liquidity, volatility, and market behavior.
How It Works
The script checks whether the current candle falls inside a predefined session time range based on a selected time zone.
When the session state changes:
From inactive → active → it draws an Open marker
From active → inactive → it draws a Close marker
This is done for each session independently (Asia, Europe, USA), so you can clearly see when one session starts or ends relative to the others.
The indicator does not repaint and uses only confirmed candle information.
Sessions Used (default)
These are the default session times (you can change them in the code):
Asia: 19:00 – 01:00
Europe: 02:00 – 10:00
USA: 09:30 – 16:00
All times are interpreted according to the selected time zone.
How to Change the Time Zone
At the top of the script you will find this line:
tz = "America/La_Paz"
To change the time zone, simply replace "America/La_Paz" with your desired zone.
Examples:
tz = "America/New_York" // New York
tz = "Europe/London" // London
tz = "Asia/Tokyo" // Tokyo
tz = "Australia/Sydney" // Sydney
tz = "UTC" // Coordinated Universal Time
TradingView uses standard IANA time zone names.
You can find the full list here: en.wikipedia.org
Who Is This Indicator For?
This indicator is useful for:
Session-based traders
Liquidity traders
Forex, indices, and crypto traders
Anyone who wants to understand when major market sessions begin and end
Final Notes
Works on all timeframes.
Does not repaint.
Can be used on Forex, Crypto, Indices, and Futures.
Fully customizable (sessions, colors, labels, and time zone).
If you like this indicator or find it useful, feel free to like it or leave feedback — and happy trading! 🚀📈

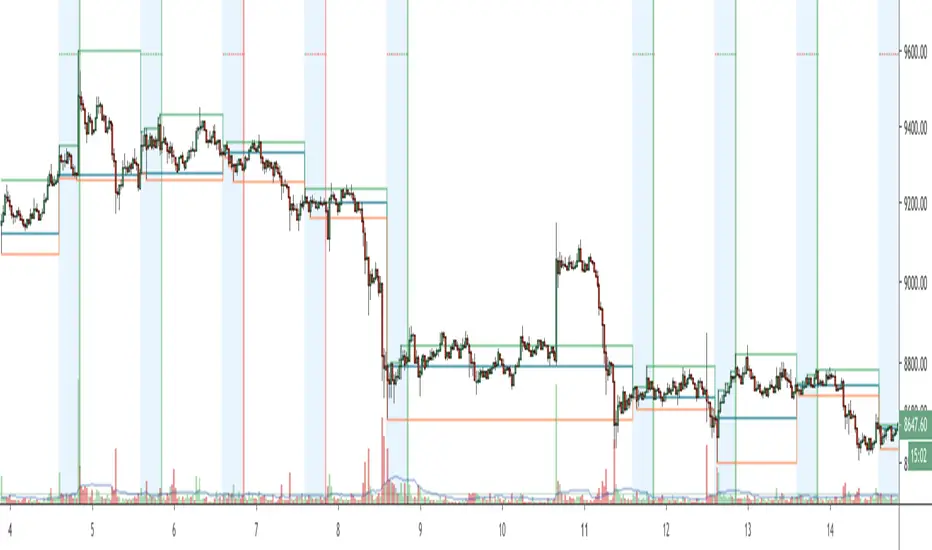
6-9 session & levels6-9 Session & Levels - Customizable Range Analysis Indicator
Description:
This indicator provides comprehensive session-based range analysis designed for intraday traders. It calculates and displays key levels based on a customizable session period (default 6:00-9:00 AM ET).
Core Features:
Session Tracking
Monitors user-defined session times with timezone support
Displays session open, high, and low levels
Highlights session range with optional box visualization
Shows previous day RTH (Regular Trading Hours: 9:30 AM - 4:00 PM) levels
Range Levels
25%, 50%, and 75% range levels within the session
Range deviations at 0.5x, 1.0x, and 2.0x multiples
Fibonacci extension levels (customizable, default 1.33x and 1.66x)
Optional fill zones between Fibonacci levels
Time Zone Highlighting
Marks the 9:40-9:50 AM period as a potential reversal zone
Vertical lines with shading to identify key time windows
Statistical Analysis
Calculates mean and median extension levels based on historical sessions
Displays statistics table showing current range, average range, range difference, and z-score
Customizable sample size (1-100 sessions) for statistical calculations
Option to anchor extensions from either session open or high/low points
Input Settings Explained:
Session Settings
Levels Session Time: Define your session window in HHMM-HHMM format (default: 0600-0900)
Time Zone: Choose from UTC, America/New_York, America/Chicago, America/Los_Angeles, Europe/London, or Asia/Tokyo
Anchor Settings
Show Session Anchor: Toggle the session anchor line (marks session open price at 6:00 AM)
Anchor Style/Color/Width: Customize appearance (Solid/Dashed/Dotted, color, 1-4 width)
Show Anchor Label: Display price label for the anchor
Session Open Line: Similar options for the session open reference line
Range Box Settings
Show Range Box: Display a shaded rectangle highlighting the session high-to-low range
Range Box Color: Set the box background color and transparency
Range Levels (25%/50%/75%)
Show Range Levels: Toggle all three intermediate levels on/off
Individual Level Styling: Each level (25%, 50%, 75%) has its own color, style, and width settings
Show Range Level Labels: Display price labels for each level
Range Deviations
Show Range Deviations: Toggle deviation levels on/off
0.5x/1.0x/2.0x Settings: Each deviation multiplier can be customized with its own color, line style (Solid/Dashed/Dotted), and width
Show Range Deviation Labels: Display labels showing the deviation price levels
Previous Day RTH Levels
Show Previous RTH Levels: Display yesterday's regular trading hours high and low
RTH High/Low Styling: Separate color, style, and width settings for each level
Show Previous RTH Labels: Toggle price labels for RTH levels
Time Zones
Show 9:40-9:50 AM Zone: Highlight this specific time period with vertical lines and shading
Zone Color: Set the background fill color for the time zone
Zone Label Color/Text: Customize the label appearance and text
Fibonacci Extension Settings
Show Fibonacci Extensions: Toggle Fib levels on/off
Fib Extension Color/Style/Width: Customize line appearance
Show Fib Extension Labels: Display price labels
Fib Ext Level 1/2: Set custom multipliers (default 1.33 and 1.66, range 0-5 in 0.1 increments)
Show Fibonacci Fills: Display shaded zones between Fib levels
Fib Fill Color: Customize the fill color and transparency
Session High/Low Settings
Show Session High/Low Lines: Display the actual session extremes
Style/Color/Width: Customize line appearance
Show Labels: Toggle price labels for high/low levels
Extension Stats Settings
Show Statistical Levels on Chart: Display mean and median extension levels based on historical data
Extension Anchor Point: Choose whether to anchor from "Open" or "High/Low" of the session
Number of Sessions for Statistics: Set sample size (1-100, default 60) for calculating averages
Mean/Median High Extension: Separate styling for each statistical level (color, style, width)
Mean/Median Low Extension: Separate styling for downside statistical levels
Tables
Show Statistics Table: Display a summary table with current range, average range, difference, z-score, and sample size
Table Position: Choose from 9 positions (Bottom/Middle/Top + Center/Left/Right)
Table Text Size: Select from Auto, Tiny, Small, Normal, Large, or Huge
Display Settings
Projection Offset: Number of bars to extend lines forward (default 24)
Label Size: Choose from Tiny, Small, Normal, or Large
Price Decimal Precision: Set decimal places for price labels (0-6)
How It Works:
The indicator tracks the specified session period and calculates the session's open, high, low, and range. At the end of the session (9:00 AM by default), it projects all configured levels forward for the trading day. The statistical features analyze the last N sessions (you choose the number) to calculate typical extension behavior from either the session open or the session high/low points.
The z-score calculation helps identify whether the current session's range is normal, expanded, or contracted compared to recent history, allowing traders to adjust expectations for the rest of the day.
Use Case:
This indicator helps traders identify key support and resistance levels based on early session price action, understand current range context relative to historical averages, and spot potential reversal zones during specific time periods.
Note: This indicator is for informational purposes only and does not constitute investment advice. Always perform your own analysis before making trading decisions.

TLC sessionA Professional Intraday Session Tracker with VWAP and Economic Event Integration
Description
This indicator provides visual tracking of major trading sessions (Asian, London, New York) combined with VWAP calculations and macroeconomic event zones. It's designed for intraday traders who need to monitor session overlaps, liquidity periods, and high-impact news events.
The basic script of trading sessions was taken as a basis and refined for greater convenience.
Key Features:
Customizable Session Tracking: Visualize up to 3 trading sessions with adjustable time zones (supports IANA & GMT formats)
Dynamic VWAP Integration: Built-in Volume-Weighted Average Price calculation
Macro Event Zones: Highlights key economic announcement windows (adjustable for summer/winter time)
Price Action Visualization: Displays open/close prices, session ranges, and average price levels
Automatic DST Adjustment: Uses IANA timezone database for daylight savings awareness
How It Works
1. Trading Session Detection
Three fully configurable sessions (e.g., Asia, London, New York)
Each session displays:
Colored background zone
Opening price (dashed line)
Closing price (dashed line)
Average price (dotted line)
Optional label with session name
2. VWAP Calculation
Standard Volume-Weighted Average Price plotted as circled line
Helps identify fair value within each session
3. Macro Event Zones
Special highlighted period for economic news releases
Automatically adjusts for summer/winter time
Default set to 1000-1200 (summer) or 0900-1100 (winter) GMT-5 (US session open)
Why This Indicator is Unique
Multi-Session Awareness
Unlike simple session indicators, this tool:
Tracks price development within each session
Shows session overlaps (critical for volatility periods)
Maintains separate VWAP calculations across sessions
Professional-Grade Features
IANA timezone support (automatic DST handling)
Customizable visual elements (toggle labels, ranges, averages)
Object-based architecture (clean, efficient rendering)
News event integration (helps avoid trading during high-impact releases)
Usage Recommendations
Best Timeframes
1-minute to 1-hour charts (intraday focus)
Not recommended for daily+ timeframes
Trading Applications
1. Session Breakout Strategy: Trade breakouts when London/New York sessions open
2. VWAP Reversion: Fade moves that deviate too far from VWAP
3. News Avoidance: Reduce position sizing during macro event windows
Visual Example
Asian session (red)
London session (blue)
New York session (purple)
Macro event zone (white)
VWAP line (gold circles)
The basic script of trading sessions was taken as a basis and refined for greater convenience.

ICT Macro Sessions by @zeusbottradingICT Macro Sessions Indicator
The ICT Macro Sessions Indicator is a powerful tool designed for traders who follow the ICT (Inner Circle Trader) methodology and want to optimize their trading during specific high-probability time intervals. This indicator highlights all the key macro sessions throughout the trading day in the GMT+8 (Hong Kong) time zone.
What Does the Indicator Do?
This indicator visually marks ICT Macro Sessions on your trading chart using background colors and optional labels. Each session corresponds to specific time intervals when institutional activity is most likely to drive price action. By focusing on these periods, traders can align their strategies with market volatility and liquidity, increasing their chances of success.
Highlighted Sessions
The indicator covers all major ICT Macro Sessions, each with a unique color for easy identification:
London Macro 1 (15:33–16:00 GMT+8):
- Marks the early London session, often characterized by strong directional moves.
London Macro 2 (17:03–17:30 GMT+8):
- Captures the mid-London session, where price frequently reacts to liquidity levels.
New York AM Macro 1 (22:50–23:10 GMT+8):
- Highlights the start of the New York session, a prime time for price reversals or continuations.
New York AM Macro 2 (23:50–00:10 GMT+8):
- Focuses on late-morning New York activity, often aligning with key news releases.
New York Lunch Macro (00:50–01:10 GMT+8):
- Covers the lunch period in New York, where price may consolidate or set up for afternoon moves.
New York PM Macro 1 (02:10–02:40 GMT+8):
- Tracks post-lunch activity in New York, often featuring renewed volatility.
New York PM Macro 2 (04:15–04:45 GMT+8):
- Captures late-session moves as institutional traders finalize their positions.
Features of the Indicator
Fixed Time: The indicator is pre-configured for GMT+8 but it will adapt automatically to your timezone. No need to change anything in the code.
Background Highlighting: Each session is visually marked with a unique background color for quick recognition.
Optional Labels: Traders can enable or disable labels for each session, providing flexibility in how information is displayed.
Session Toggles: You can choose which sessions to display based on your trading preferences and strategy.
Intraday Timeframes: The indicator is optimized for intraday charts with timeframes of 45 minutes or less. You can change it to anything you like.
Why Use This Indicator?
The ICT Macro Sessions Indicator helps traders focus on the most critical times of the trading day when institutional activity is at its peak. These periods often coincide with significant price movements, making them ideal for scalping, day trading, or even swing trading setups. By visually highlighting these sessions, the indicator eliminates guesswork and allows traders to plan their trades with precision.

[UTILS] Session Input ParserAn utility function to parse session inputs. Extracts hours, minutes and weekdays (if defined) and returns a tuple as the result.
_parseSession(sessionString) => (hourStart, minuteStart, hourEnd, minuteEnd, weekdaysArray)
Examples presented on the chart.

Trade Session Marker of trade session
If you do not want painting all session, you should set -1 in the SessionStart
and SessionEnd

Trading Sessions The sessions are individually selectable, meaning you can choose which sessions you want to display.
There is also a legend in the bottom left showing the corresponding trading hours.
Displayed sessions:
ASIA
LONDON
NEW YORK
#ZEBI

SESSIONS Golden Team SESSIONS — Multi-Session Forex Box & Range Analysis
This indicator displays the major Forex market sessions — London, New York, Tokyo, Sydney, and Frankfurt — directly on the chart. Each session is shown as a customizable colored box with optional Fibonacci levels and opening range markers.
It also calculates and displays the average pip range of each session over a user-defined number of past days, allowing traders to analyze volatility patterns for each trading period.
Key Features:
Configurable session times and time zones
Individual on/off toggle for each session
Custom colors, box transparency, and border styles
Optional Opening Range and Fibonacci retracement levels for each session
Average pip range table for quick volatility reference
Works on any intraday timeframe
How It Works:
The script identifies the start and end times of each session based on user settings.
A box is drawn around the high/low of the session period.
At the end of each session, the pip range is recorded, and an average is calculated over the last N sessions (default: 20).
The results are displayed in a statistics table showing average pips and whether the session is currently active.
Suggested Use:
Identify high-volatility sessions for breakout trading
Filter trades to active trading hours
Study historical volatility to refine entry timing

Institutional Sessions Overlay (Asia/London/NY)Institutional Sessions Overlay is a professional TradingView indicator that visually highlights the main trading sessions (Asia, London, and New York) directly on your chart.
Customizable: Easily adjust session start and end times (including minutes) for each market.
Timezone Alignment: Shift session boxes using the timezone offset parameter so sessions match your chart’s timezone exactly.
Clear Visuals: Colored boxes and optional labels display session opens and closes for fast institutional market structure reference.
Toggle Labels: Show or hide session open/close labels with a single click for a clean or detailed look.
Intuitive UI: User-friendly grouped settings for efficient configuration.
This tool is designed for day traders, institutional traders, and anyone who wants to instantly recognize global session timing and ranges for SMC, ICT, and other session-based strategies.
How to use:
Set your chart to your local timezone.
Use the "Session timezone offset" setting if session boxes do not match actual session opens on your chart.
Adjust the hours and minutes for each session as needed.
Enable or disable labels in the “Display” settings group.
Tip: Use the overlay to spot session highs and lows, volatility windows, and institutional liquidity sweeps.

Worldwide Sessions and Open Range BreakoutThis script shows when the various normal market hours for each of the major worldwide markets (Asia, New York, and London). It also draws a line on the opening range for each of these market sessions. The opening range defaults to the first 15 minutes of the session, but this can be customized.
This script does automatically handle the session times regardless of your time zone or what time frame you are on. No need to set anything! This probably can't handle non-normal trading days, such as partial days.
This script is made for futures, but would likely work for other markets, like Forex.

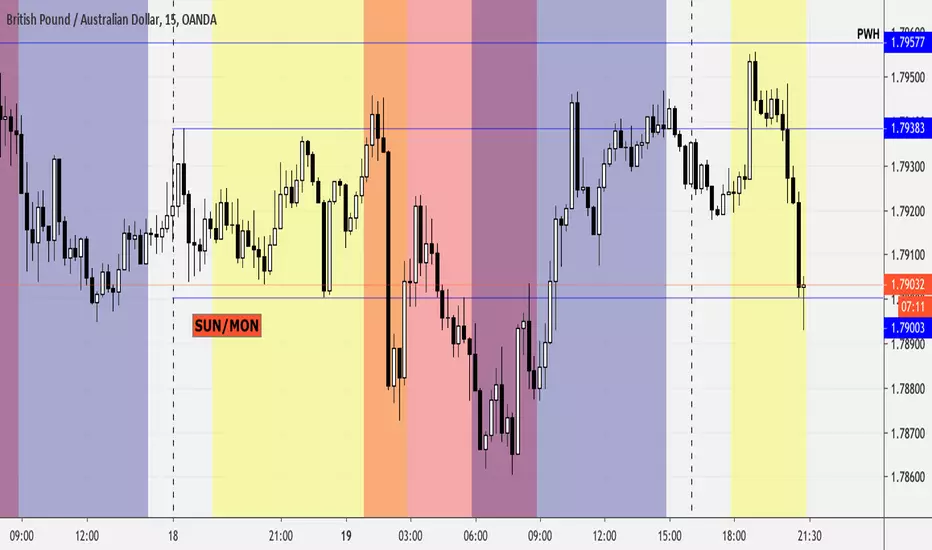
London/NY Sessions + SMC Levels📜 Indicator Description: London/NY Sessions + SMC Levels
Overview: This indicator highlights the key trading sessions — London, New York, NY Lunch, and Asian Range — providing structured visual guides based on Smart Money Concepts (SMC) and ICT principles.
It dynamically plots:
Session Backgrounds and Boxes for London, NY, Lunch, and Asian sessions
Reference Levels for the High, Low, and Close from today, previous day, or weekly data
Midnight Open line for ICT-style power of three setups
Real-time alerts for session starts, session closes, and important price level crossings
Features:
🕰️ Session Visualization:
Toggle London, NY, Lunch, and Asian session ranges individually, with customizable colors and transparent backgrounds.
🔔 Built-in Alerts:
Alerts for:
Price crossing the previous day's high/low
Price crossing the Midnight Open
Start and end of major sessions (London, NY, Lunch, Asian)
🟩 Reference Levels:
Plot selectable session reference levels:
Today’s intraday High/Low/Close
Previous Day’s High/Low/Close
This Week’s or Previous Week’s levels for broader context.
🌙 Midnight Open:
Track the Midnight New York Open as a reference point for daily bias shifts.
🎯 Customizable Settings:
Choose your session time zones (UTC, New York, London, etc.)
Customize all border colors, background colors, and session hours.
Use Cases:
Identify killzones and optimal trade entry windows for Smart Money Concepts (SMC) and ICT strategies.
Monitor liquidity pool sweeps and session transitions.
Confirm or refine your intraday or swing trading setups by referencing session highs/lows.
Recommended For:
ICT traders
Smart Money Concepts (SMC) practitioners
Forex, indices, crypto, and futures traders focusing on session-based volatility patterns
Anyone wanting a clean, professional session mapping tool
📈
Designed to help you trade with session precision and Smart Money accuracy.
Integrates seamlessly into any ICT, Wyckoff, or Liquidity-based trading approach.

NYSE Session for 24/7 marketsThis script is used for analyzing the correlation between 24/7 markets with regards to the price action during NYSE session. Defaults to showing daily session open/high/low but there is the option to show the weekly session data.
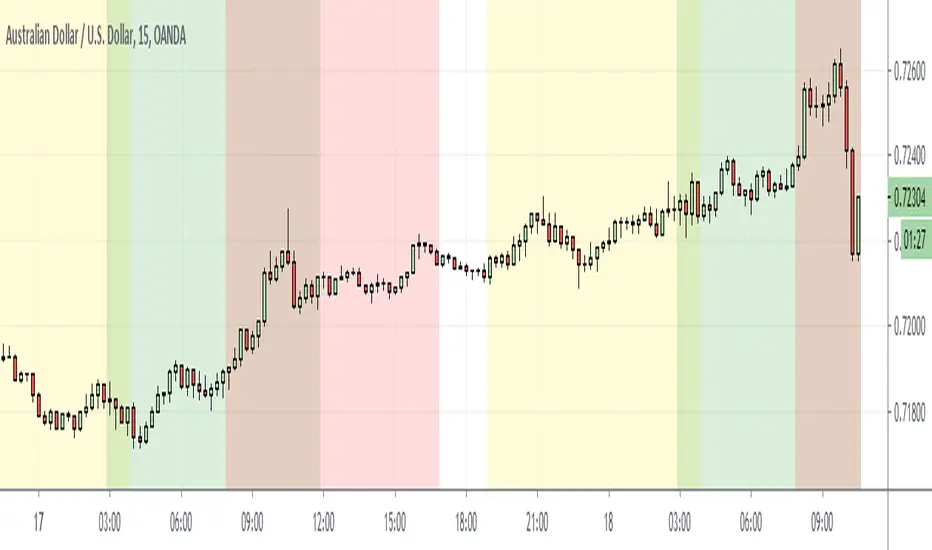
Forex Sessions (Asian, London, New York)This script lines up the different sessions for New York, Asian, and London. It also have overlap between the sessions and the colors have been adjusted to make it easier to read.
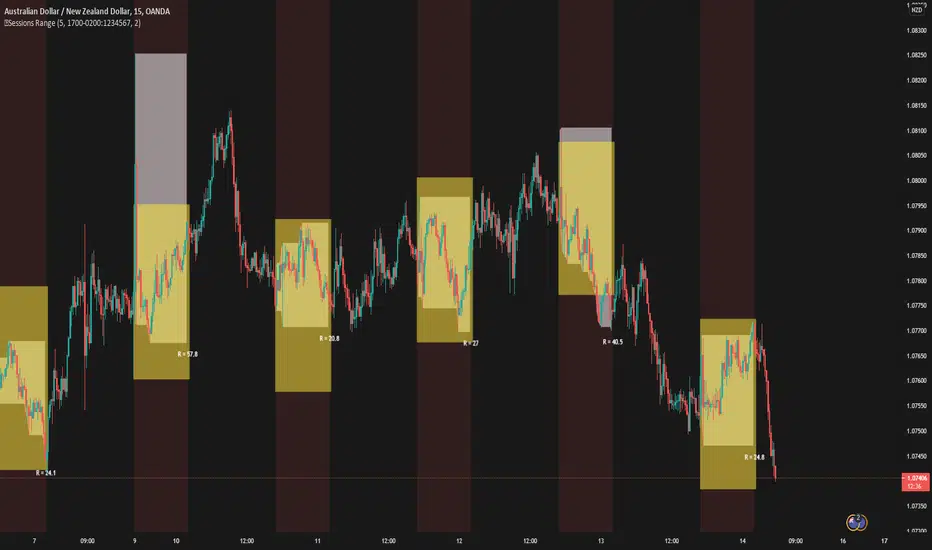
5 Sessions RangeThis script averages the range of the previous 5 sessions and displays it on the chart
The sessions are adjustable
Custom Colored Session (Pre, Open, Close, Post, Outside)Another script enabling coloring of sessions. Variables for all session timings and colors are exposed. Backgrounds and/or dividers can be enabled. If you only want dividers, just uncheck all of the background sections.
Note: Due to the way weekends are handled on some exchanges, displaying the divider on Friday is not possible.
Note: Displaying backgrounds or dividers in the future does not seem to be possible. I would gladly add this if I can figure it out.

Apex Edge - London Open Session# Apex Edge - London Open Session Trading System
## Overview
The London Open Session indicator captures institutional price action during the first hour of the London forex session (8:00-9:00 AM GMT) and identifies high-probability breakout and retest opportunities. This system tracks the session's high/low range and generates precise entry signals when price breaks or retests these key institutional levels.
## Core Strategy
**Session Tracking**: Automatically identifies and marks the London Open session boundaries, creating a trading zone from the first hour's price range.
**Dual Entry Logic**:
- **Breakout Entries**: Triggers when price closes beyond the session high/low and continues in that direction
- **Retest Entries**: Activates when price returns to test the broken level as new support/resistance
**Performance Analytics**: Built-in win rate tracking displays real-time performance statistics over user-defined lookback periods, enabling data-driven optimization for each currency pair.
## Key Features
### Automated Zone Detection
- Precise London session timing with timezone offset controls
- Visual session boundaries with customizable colours
- Automatic high/low range calculation and display
### Smart Entry System
- Breakout confirmation requiring candle close beyond zone
- Retest detection with configurable pip distance tolerance
- Separate risk/reward ratios for breakout vs retest entries
- Visual entry arrows with clear trade direction labels
### Performance HUD
- Real-time win rate calculation over customizable periods (7-365 days)
- Total trades tracking with win/loss breakdown
- Average risk-reward ratio display
- Color-coded performance metrics (green >70%, yellow >50%, red <50%)
### PineConnector Integration
- Direct MT4/MT5 execution via PineConnector alerts
- Proper forex pip calculations for all currency pairs
- Customizable risk percentage per trade
- Symbol override capability for broker compatibility
- Automatic SL/TP level calculation in pips
## Critical Usage Requirements
### Pair-Specific Optimization
Each currency pair requires individual optimization due to varying volatility characteristics, institutional participation levels, and typical price ranges during London hours. The performance HUD is essential for identifying optimal settings before live trading.
**Recommended Testing Process**:
1. Apply indicator to desired currency pair and timeframe
2. Experiment with session timing - while 8:00-9:00 AM GMT is standard, some pairs may show improved performance with alternative hourly windows (e.g., 7:00-8:00 AM or 9:00-10:00 AM)
3. Adjust Stop Loss distances, Risk/Reward ratios, and Retest distances
4. Monitor win rate over 30+ day periods using the performance HUD
5. Only proceed with live alerts once consistent 60%+ win rates are achieved
6. Create separate optimized chart setups for each profitable pair/timeframe combination
### Timeframe Specifications
This indicator is specifically designed and tested for:
- **1-minute charts**: Optimal for capturing immediate institutional reactions
- **5-minute charts**: Balanced approach between noise reduction and opportunity frequency
Higher timeframes generally produce inferior results due to increased noise and reduced institutional edge during the London session window.
## Settings Configuration
### Session Timing
- **London Open/Close Hours**: Adjust for your chart's timezone
- **Rectangle End Time**: Set to 4:30 PM to stop signals before NY session close
- **Timezone Offset**: Ensure accurate London session capture
### Entry Parameters
- **Retest Distance**: 3-8 pips depending on pair volatility
- **Stop Loss Pips**: Separate settings for breakouts (10-15 pips) and retests (8-12 pips)
- **Risk/Reward Ratios**: Independent ratios for different entry types
### PineConnector Setup
- **License ID**: Your PineConnector license key
- **Symbol Override**: MT4/MT5 symbol names if different from TradingView
- **Risk Percentage**: Position size as percentage of account balance
- **Prefix/Comment**: Organize trades in terminal
## Manual Trading Limitations
Without PineConnector automation, traders face significant practical challenges:
**Settings Management**: Each currency pair requires different optimized parameters. Switching between charts means manually adjusting multiple settings each time, creating potential for errors and missed opportunities.
**Timing Sensitivity**: London Open signals can occur rapidly during high-volatility periods. Manual execution may result in slippage or missed entries.
**Multi-Pair Monitoring**: Tracking 4-11 currency pairs simultaneously while manually adjusting settings for each switch becomes impractical for most traders.
**Parameter Consistency**: Risk of using suboptimal settings when quickly switching between pairs, potentially compromising the careful optimization work.
## Recommended Workflow
1. **Historical Testing**: Use win rate HUD to identify profitable pairs and optimal parameters
2. **Demo Automation**: Test PineConnector alerts on demo accounts with optimized settings
3. **Live Implementation**: Deploy alerts only on proven profitable pair/timeframe combinations
4. **Ongoing Monitoring**: Regular review of performance metrics to maintain edge
## Risk Disclaimer
This indicator provides analysis tools and automation capabilities but does not guarantee profitable trading outcomes. Past performance does not predict future results. Users should thoroughly backtest and demo trade before risking live capital. The London session strategy works best during specific market conditions and may underperform during low volatility or unusual market environments.
## Support Requirements
Successful implementation requires:
- Basic understanding of London session market dynamics
- PineConnector subscription for automation features
- Patience for proper optimization process
- Realistic expectations about win rates and drawdown periods
This system is designed for serious traders willing to invest time in proper optimization and risk management rather than plug-and-play solutions.

Ultra SessionsThe "Ultra Sessions" indicator is designed to enhance your trading strategy by clearly marking key market sessions and their associated "kill zones" directly on your chart. This powerful tool supports multiple time zones and provides customizable alerts for session opens, closes, and critical kill zones, ensuring you never miss important market movements.
Customizable Time Zones: Align the indicator with your local time by selecting from a wide range of global time zones.
Market Session Tracking: Visually track the New York, London, and Tokyo trading sessions with distinct color-coded markers.
Kill Zones: Highlight the high-volatility periods within each session to focus on key trading opportunities.
Alert System: Receive real-time alerts for session openings, closings, and kill zones, so you stay informed without constantly monitoring the chart.
Flexible Positioning: Choose the positioning of session markers to fit your chart layout, whether at the top or bottom.
Ideal for traders who want to optimize their entry and exit points by focusing on the most active and volatile times in the market, the indicator is a must-have for any serious trading setup.

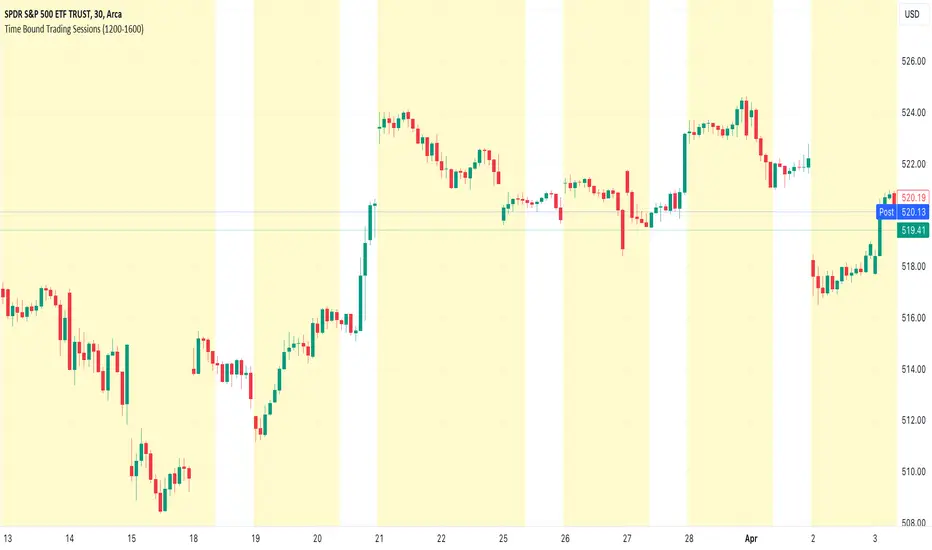
Time Bound Trading SessionsTime Bound Trading Sessions allows to add time bound conditions to your trading sessions given a date range , a time range and/or days of the week .
This indicator can be very handy if you want to control your trading sessions along those three time boundaries, applying them together and/or separately.
Feel free to reuse this code in your own strategy, and leverage the inSession condition as needed.
Features
+ It allows for date range start and/or end to be set.
+ It allows for session time range to be set.
+ It allows for days of the week to be set.
+ It applies chart background color if we are not within the given time bound session parameters.
+ It includes turn on/off functionality.
Settings
Date Range
+ {Start} checkbox: turns on/off start date
+ {Start} date/time
+ {End} checkbox: turns on/off end date
+ {End} date/time
Time Range
+ {Session} checkbox: turns on/off session time range
+ {Session} time range
Days
+ {M} checkbox: turns on/off Mondays
+ {T} checkbox: turns on/off Tuesdays
+ {W} checkbox: turns on/off Wednesdays
+ {T} checkbox: turns on/off Thursdays
+ {F} checkbox: turns on/off Fridays
+ {S} checkbox: turns on/off Saturdays
+ {S} checkbox: turns on/off Sundays