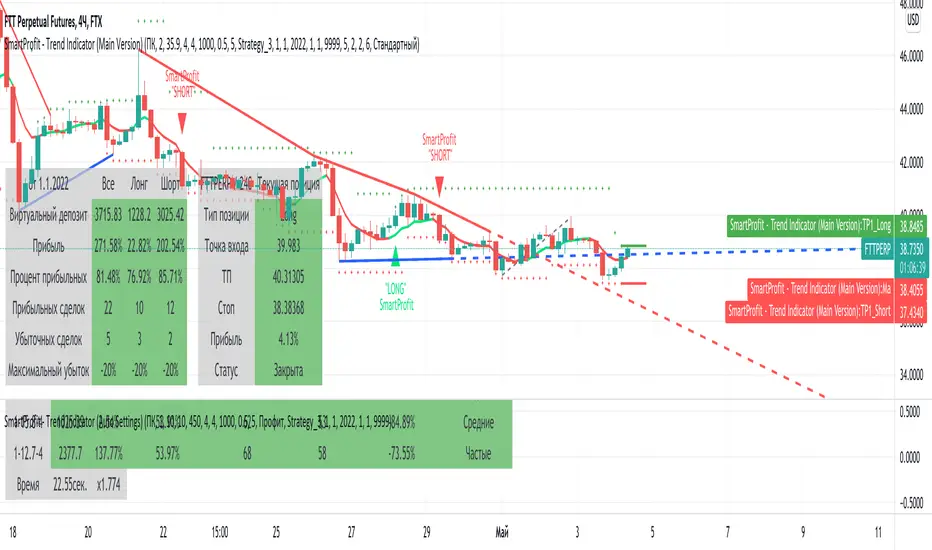
SmartProfit - Trend Indicator (Main Version) - RUSmartProfit - Trend Indicator (Main Version) detects trend direction and gives trading signals for Short and Long positions.
You can use "SmartProdit - Trend Indicator" for any timeframe, from daily, 4h, to fewer ones, even minute timeframe.
We recommend using those timeframes:
4h. and 3h. - for swing trading
15min. и 30min. - for scalping
"SmartProfit - Trend Indicator" features:
1. Sell and Buy signals ( For setup, we have three parameters: HB, sensitivity, and stop )
2. TakeProfit values for Long and Short signals ( Prices for profit fixing )
3. Profit table ( Show profit of current indicator settings for chosen time range )
4. Current position table ( Show data for the current position in real-time. At this table you have all that you need to enter the position )
5. Trend lines ( Draw Global and local trend lines. )
6. Fibonacci levels ( Automatically draw global and local Fibonacci levels )
7. Fibonacci channel ( Automatically draw global and local Fibonacci channels )
8. Auto setting - sorts out more than 6000 variants of settings at one loop and gives the best one.
For best results, you should set up an indicator for each trading pair. For setup, we have three parameters: HB, sensitivity, and stop. We have an additional feature for auto setting, which sorts out more than 6000 variants of settings at one loop and give the best one.
For work with indicators we made 3 strategies:
First - we enter the position after the signal is approved. Close and reenter to position with approved signal for another side.
Second and third - the same, we enter the position after the signal is approved, but we use TakeProfit and StopLoss values to fix the position.
"SmartProdit - Trend Indicator" определяет направления тренда и дает торговые сигналы для входа в Короткую или Длинную позицию.
Индикатор позволяет торговать на любых Таймфреймах , как на дневных, так и на более мелких временных интервалах, вплоть до минутных.
Мы рекомендуем использовать Таймфреймы:
4ч. или 3ч. - для Свинг-торговли
15мин. и 30мин. - для Скальпинга
Подробнее о функционале индикатора SmartProfit:
1. Сигналы Покупки или Продажи ( Для настройки используется уникальные параметры HB и Чувствительность )
2. Значения TakeProfit для Long и Short сигналов ( Зоны фиксации прибыли )
3. Таблица прибыльности ( Отображает прибыльность текущей настройки на выбранном интервале времени )
4. Таблица Текущей позиции ( Показывает текущую позицию в режиме реального времени - в ней есть всё, что нужно для входа в позицию )
5. Трендовые линии ( Рисует как Глобальные, так и локальные трендовые линии, в зависимости от настроек )
6. Уровни Фибоначчи ( Автоматически строит уровни Фибоначчи, как Глобальные так и Локальные )
7. Каналы по Фибоначчи ( Автоматически строит каналы по Фибоначчи, как Глобальные так и Локальные )
8. Автоподсчет всех настроек индикатора - автоматически делает подбор более 6000 вариаций настроек за раз и выдаёт лучшие под каждый актив. Вам не надо тратить недели и месяцы чтобы вручную подбирать настройки, наш инструмент подберет лучшие настройки для Вас.
Для более лучших результатов, для каждого актива индикатор настраивается отдельно !
Для настройки индикатора используются три Уникальных параметра:
HB, Чувствительность, Стоп.
Для работы с индикатором разработаны три стратегии:
Первая - мы входим в позицию при закреплении сигнала и переворачиваемся (то есть выходим из позиции и заходим в противоположную сторону) по обратному сигналу.
По 2-ой и 3-ей стратегии мы также входим после закрепления сигнала, но для фиксации прибыли используем зоны TakeProfit, указанные индикатором.
Подробнее о всех возможностях стратегий, а также настройке и работе с индикатором, вы узнаете из нашей инструкции, которую выдаем персонально.
Search in scripts for "smart"
SMART4TRADER-PAIR corrector chartMarket analysis indicator based on automatic lot selection through the indicator USE WITH THE SINGLE SETTINGS
Индикатор анализа рынка на основе автоматического подбора лота через индикатор ИСПОЛЬЗОВАТЬ СОВМЕСТНО с ОДИНАКОВЫМИ НАСТРОЙКАМИ

SMART4TRADER - S&P500 Volatility Range SD by VIXAn indicator for determining intraday volatility using the standard deviation calculated from the VIX volatility.
For questions about using this indicator, write a private message @smart4trader
-----------------
Индикатор для определения внутридневной волатильности с применением среднеквадратического отклонения расcчитанного от волатильности VIX.
По вопросам использования данного индикатора пишите личное сообщение @smart4trader

SMART4TRADER-ATR STANDARD DEVIATION CHARTThis indicator is a continuation of the indicator MUST READ this indicator 🚥 SMART4TRADER ATR STANDARD DEVIATION
The indicator is in the main window and shows the levels at which in most cases the price is braking. The concept of this indicator is a modified ATR with a standard deviation in the smaller direction in order to determine the often recurring price reversal zones.
Recommended options are suggested by default.
In the comments will be added a video in Russian on the application and analysis of the market using this indicator📲
----------------------------
Это индикатор является продолжение индикатора ОБЯЗАТЕЛЬНО ПРОЧИТАЙТЕ про этот индикатор 🚥 SMART4TRADER ATR STANDARD DEVIATION
Индикатор находится в главном окне и показывает уровни на которых в большинстве случаев происходит торможение цены. В концепции данного индикатора лежит измененный ATR с стандартным отклонением в меньшую сторону для того, чтобы определить часто повторяющиеся зоны разворота цены.
Рекомендуемые параметры предложены по умолчанию.
В комментариях будет добавлено видео на русском языке по применению и анализу рынка при помощи этого индикатора📲
------------------

SMART4TRADER-VOLATILITY ZONE oscillatorThis oscillator should be used in conjunction with indicators:
Этот осциллятор необходимо использовать совместно с индикаторам:

SMART4TRADER-ATR Channel oscOscillator of the volatility of the turn for the indicator SMART4TRADER-ATR
Осциллятор волатильности разворота для индикатора SMART4TRADER-ATR

SMART4TRADER-ATR
(EN)
I bring to your attention the unique author's indicator "SMART4TRADER-ATR".
This indicator works without binding to the timeframe and builds the price break points inside the selected timeframe. Marking of price zones is carried out MANUALLY. To assess his worth, write personal messages to me.
///////////////////////////////////////////////////
(RU)
Предлагаю Вашему вниманию уникальный авторский индикатор “SMART4TRADER-ATR”.
Этот индикатор работает без привязки к timeframe и строит точки разворотов цены внутри выбранного таймфрейма. Разметка ценовых зон проводиться ВРУЧНУЮ. Чтобы оценить его достоинства пишите личные сообщения мне.
///////////////////////////////////////////////////

SMART4TRADER-CHANNEL(EN)
I bring to your attention the unique author's indicator "SMART4TRADER-CHANNEL".
This indicator works without binding to the timeframe and builds the areas of sales and purchases. To assess his worth, write personal messages to me.
///////////////////////////////////////////////////
Red zones are sell areas
Green zones are buy areas.
The thin line on the chart is the signal to open the transaction in the direction of the color of this line
////////////////////////////////////////////////////////////////////////////////////////////////////
(RU)
Предлагаю Вашему вниманию уникальный авторский индикатор “SMART4TRADER-CHANNEL”.
Этот индикатор работает без привязки к timeframe и строит области продаж и покупок. Чтобы оценить его достоинства пишите личные сообщения мне.
///////////////////////////////////////////////////
Красные зоны - это зоны продаж
Зеленые зоны - зоны покупок.
Тонкая линия на графике - это сигнал к открытию сделки в сторону цвета этой линии

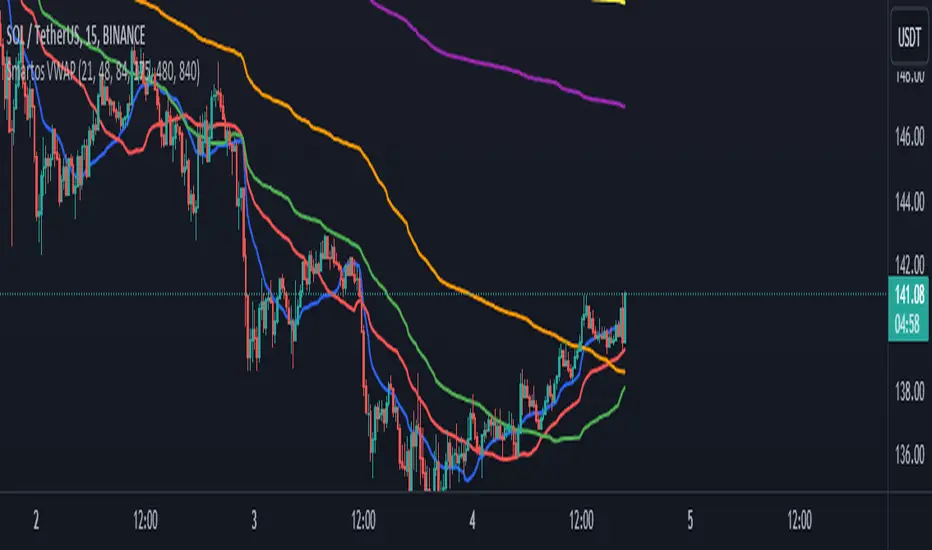
Smartos VWAPSmartos VWAP Indicator Description
Smartos VWAP is a versatile and customizable technical analysis tool designed for traders and analysts to gauge the average price of a security based on its trading volume. The indicator calculates the Volume Weighted Average Price (VWAP) over six different customizable periods, allowing users to adapt the analysis to their trading strategies.
Key Features:
Volume Weighted Average Price (VWAP): The Smartos VWAP provides a dynamic measure of the average price at which a security has traded throughout the day, weighted by volume. This makes it a useful reference point for assessing price levels.
Customizable Periods: The indicator allows users to set six different candle lengths for VWAP calculations, with default values of 21, 48, 84, 175, 480, and 840 candles. Users can easily modify these values to suit their trading preferences.
Multiple VWAP Lines: The indicator plots six distinct VWAP lines on the chart, each representing a different period. This enables traders to observe price action relative to multiple VWAPs, helping identify trends and potential support and resistance levels.
Visual Clarity: Each VWAP line is color-coded for easy differentiation, making it simple for traders to analyze price movements and the relationship between the current price and the average price over the selected periods.
Usage:
Traders can use the Smartos VWAP indicator to make informed decisions regarding entry and exit points, as well as to assess overall market sentiment. By observing the position of the price relative to the VWAP lines, traders can gain insights into potential bullish or bearish trends.
SMART4TRADER-PAIR corrector(EN) I present to your attention the indicator for automatic selection of the lot size for the second tool in the pair trading. Everything is very simple:
1) Enter the names of the instruments
2) Select the period for the calculation
3) The last data is entered in the form (.... * indicator readings)
Example: It is necessary to choose the right lot size for (UGL-DGP). After filling the fields, write the desired value to the formula of the instrument. For these instruments, the readings are equal (1.61). Then we write it into the formula and get a new formula (UGL-DGP * 1.61). The graph oscillates !!!
To assess his worth, write personal messages to me.
/////////////////////////////////////////////////////////////////////////////////////////////////////////
(RU) Представляю вашему вниманию индикатор для автоматического подбора размера лота для второго инструмента в парной торговле. Все очень просто:
1) Вписать названия инструментов
2) Выбрать период для просчета
3) Последнии данные вписать в виде ( ....* показания индикатора )
Пример: Нужно правильно подобрать размер лота для (UGL-DGP). После заполнения полей индикатор нужное значение записываем в формулу инструмента. Для этих инструментов показания равны (1.61). Далее записываем в формулу и получаем новую формулу (UGL-DGP*1.61). График осциллирует !!!
Чтобы оценить его достоинства пишите личные сообщения мне.


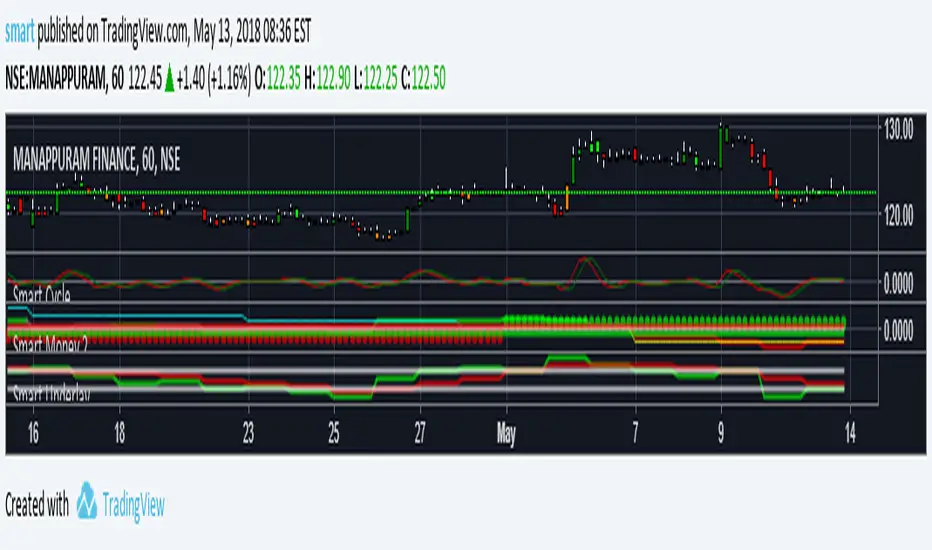


SMM - Smart Money IndicatorHello Traders,
SMM – Smart Money Indicator is a Smart Money Concepts indicator that is meant to make your trading a bit easier and take the guess work away. Our mission is to save your time with already marking up the chart for you (all automatic). This indicator will help you spot the point of interests a.k.a. Order Blocks, Supply and Demand zones and Fair Value Gaps. Our mission is to create the best Smart Money Concepts indicator on the market. For that we would like to receive your guy’s feedback on it.
Smart Money refers to the capital that institutional investors, central banks, and other professionals or financial institutions control. Market Structure is the foundation of price action trading, understanding price action is fundamental to SMC .
Market Structure based of fractals – We are using fractal-based market structure since it’s way stronger than for example an Eliot wave. So, we only get the clearest break of structure (BoS- Trend continuation) and Change of Character (CHoCH- Possible change of trend)
Features
- Changing the break type to either only the body or body and the wick
- Period of looking back to determine structure (combined with the supply and demand zones)
Multiple Time frame Supply and Demand – Displayed typically as the last up/down candle before a big move in the opposite direction. Great zones to entry from on the lower time frame, also you can target previous demand/supply zones as potential take profit areas.
Features
- Multiple time frame
- Changing the amount of candles to calculate the zones.
- Option to remove mitigated zones / change color
- Extending the HTF Box to current time. (If not mitigated)
Order Blocks – What we use for our lower time frame zones to enter from. It’s basically the same as supply and demand but then on a lower time frame. Most likely once prices come into your higher time frame Supply and Demand zones, we would scale down to the lower time frames and then wait for our pattern to entry.
Features
- Extending the LTF Box to current time. (If not mitigated)
- Options to remove mitigated zones / change color
Fair Value Gaps - Is also known as an imbalance. An FVG is an imbalance of orders for instance, for sellers to complete their trades, there must be buyers and vice versa so when a market receives to many of one kind of order buys or sells, and not enough of the order’s counterpart. When the amount is not balanced and to many orders are put in for one direction, it creates an imbalance where price likes to get back too. We have 2 different options that shows you all the imbalances but also one that only shows the structure breaking imbalances which we see as the most important one.
Features
- Plotting all Fair Value Gaps
- Plotting only structure breaking Fair Value Gaps
Previous Day High and Low – Will mark up the previous day high and low what could indicate that if price breaks out of the previous day high that it will most likely trend upwards. If it breaks below, it will most likely trend down for the upcoming time.
- Showing only the recent previous day high and low
- Showing all the previous high and lows
- Show nothing
Alerts – We’ve made possible that you can also choose to receive an alert on your device once price comes in to one of the supply and demand zones. (Must place the alerts function into your alert management tab on trading view) Only works if you add the alert on when you are on the same time frame as your supply and demand zones.
You can also choose to receive alerts when a supply or demand zone has been created.

Smart VWAP FVG SystemSmart VWAP FVG System - Professional Multi-Filter Trading Indicator
📊 OVERVIEW
The Smart VWAP FVG System is an advanced multi-layered trading indicator that combines institutional volume analysis, multi-timeframe VWAP trend confirmation, and Fair Value Gap detection to identify high-probability trade entries. This indicator uses a sophisticated filtering mechanism where signals appear only when multiple independent confirmation criteria align simultaneously.
Recommended Timeframe: 5-minute (M5) or higher. The indicator works best on M5, M15, and M30 charts for intraday trading.
🎯 ORIGINALITY & PURPOSE
This indicator is original because it combines three distinct analytical methods into a unified decision-making system:
Market Profile Volume Analysis - Identifies institutional accumulation/distribution zones
Dual VWAP Filtering - Confirms trend direction using two independent VWAP calculations
Fair Value Gap Detection - Validates institutional interest through price inefficiency zones
The key innovation is the directional filter system: the primary Market Profile generates BUY-ONLY or SELL-ONLY states based on higher timeframe value area reversals, which then controls which signals from the main system are displayed. This creates a multi-timeframe confluence that significantly reduces false signals.
Unlike simple indicator mashups, each component serves a specific purpose:
Market Profile → Direction bias (trend filter)
Primary VWAP (Session) → Short-term trend confirmation
Secondary VWAP (Week) → Medium-term trend confirmation
FVG Detection → Institutional activity validation
🔧 HOW IT WORKS
1. Primary Market Profile Filter (Higher Timeframe)
The indicator calculates Market Profile on a higher timeframe (default: 1 hour) to determine the overall market structure:
Value Area High (VAH): Top 70% of volume distribution
Value Area Low (VAL): Bottom 70% of volume distribution
Point of Control (POC): Price level with highest volume
When price reaches VAH and reverses down → SELL-ONLY mode activated
When price reaches VAL and reverses up → BUY-ONLY mode activated
This higher timeframe filter ensures you're trading in the direction of institutional flow.
2. Dual VWAP System
Two independent VWAP calculations provide multi-timeframe trend confirmation:
Primary VWAP (Session-based): Resets daily, tracks intraday momentum
Secondary VWAP (Week-based): Resets weekly, confirms longer-term trend
Filter Logic:
BUY signals require: Price > Primary VWAP AND Price > Secondary VWAP
SELL signals require: Price < Primary VWAP AND Price < Secondary VWAP
This dual confirmation prevents counter-trend trades during ranging conditions.
3. Fair Value Gap (FVG) Detection
FVG zones identify price inefficiencies where institutional orders were executed rapidly:
Bullish FVG: Gap between candle .high and candle .low (upward imbalance)
Bearish FVG: Gap between candle .high and candle .low (downward imbalance)
The indicator monitors recent FVG formation (lookback: 50 bars) and requires:
Bullish FVG present for BUY signals
Bearish FVG present for SELL signals
FVG zones are displayed as colored boxes and automatically marked as "mitigated" when price fills the gap.
4. Main Trading Signal Logic
The secondary Market Profile (default: 1 hour) generates the actual trading signals:
BUY Signal Conditions:
Price reaches Value Area Low
Reversal pattern confirmed (minimum 1 bar)
Price > Primary VWAP
Price > Secondary VWAP (if filter enabled)
Recent Bullish FVG detected (if filter enabled)
Primary MP Filter = BUY-ONLY or NEUTRAL
SELL Signal Conditions:
Price reaches Value Area High
Reversal pattern confirmed (minimum 1 bar)
Price < Primary VWAP
Price < Secondary VWAP (if filter enabled)
Recent Bearish FVG detected (if filter enabled)
Primary MP Filter = SELL-ONLY or NEUTRAL
All conditions must be TRUE simultaneously for a signal to appear.
📈 VISUAL ELEMENTS
On Chart:
🟢 Green Triangle (▲) = BUY Signal
🔴 Red Triangle (▼) = SELL Signal
🟦 Blue horizontal lines = Value Area zones
🟡 Yellow line = Point of Control (POC)
🟩 Green boxes = Bullish FVG zones
🟥 Red boxes = Bearish FVG zones
🔵 Blue line = Primary VWAP (Session)
⚪ White line = Secondary VWAP (Week)
Info Panel (Top Right):
Real-time status display showing:
Filter Direction (BUY ONLY / SELL ONLY / NEUTRAL)
Active timeframes for both MP filters
FVG filter status and count
VWAP positions (ABOVE/BELOW)
Signal enablement status
Alert status
⚙️ KEY SETTINGS
MP/TPO Filter Settings (Primary Indicator)
MP Filter Time Frame: 60 minutes (controls directional bias)
Filter Value Area %: 70% (standard Market Profile calculation)
Filter Alert Distance: 1 bar
Filter Min Bars for Reversal: 1 bar
Filter Alert Zone Margin: 0.01 (1%)
FVG Filter Settings
Use FVG Filter: Enabled (toggle on/off)
FVG Timeframe: 60 minutes (1 hour)
FVG Filter Mode: Both (require bullish FVG for BUY, bearish for SELL)
FVG Lookback Period: 50 bars (how far back to search)
Show FVG Formation Signals: Optional visual markers
Max FVG on Chart: 50 zones
Show Mitigated FVG: Display filled gaps
Market Profile Settings
Higher Time Frame: 60 minutes (for main signals)
Percent for Value Area: 70%
Show POC Line: Enabled
Keep Old MPs: Enabled (maintain historical profiles)
Primary VWAP Filter
Use Primary VWAP Filter: Enabled
Primary VWAP Anchor Period: Session (resets daily)
Primary VWAP Source: HLC3 (typical price)
Secondary VWAP Filter
Use Secondary VWAP Filter: Enabled
Secondary VWAP Anchor Period: Week (resets weekly)
Secondary VWAP Filter Mode: Both
Secondary VWAP Line Color: White
Trading Signals
Show Trading Signals on Chart: Enabled
Show SELL Signals: Enabled
Show BUY Signals: Enabled
Alert Distance: 1 bar
Min Bars for Reversal: 1 bar
Alert Zone Margin: 0.01 (1%)
Retest Search Period: 20 bars
Min Bars Between Retests: 5 bars
Show Only Retests: Disabled
Alert Settings
Enable Trading Notifications: Enabled
VAH Reversal Alert: Enabled (SELL signals)
VAL Reversal Alert: Enabled (BUY signals)
Time Filter Settings
Filter Alerts By Time: Optional (exclude specific hours)
⚠️ IMPORTANT WARNINGS & LIMITATIONS
1. Repainting Behavior
CRITICAL: This indicator uses lookahead=barmerge.lookahead_on to access higher timeframe data immediately for FVG detection. This is necessary to provide real-time FVG zone visualization but has the following implications:
FVG zones may shift slightly until the higher timeframe candle closes
FVG detection signals are preliminary until HTF bar confirmation
The main trading signals (triangles) appear on confirmed bars and do not repaint
Best Practice: Always wait for the current timeframe bar to close before acting on signals. The filter status and FVG zones are informational but may adjust as new data arrives.
2. Minimum Timeframe
Do NOT use on timeframes below 5 minutes (M5)
Recommended: M5, M15, M30 for intraday trading
Higher timeframes (H1, H4) can also be used but will generate fewer signals
3. Multiple Filters Can Block Signals
By design, this indicator is conservative. When all filters are enabled:
Signals appear ONLY when all conditions align
You may see extended periods with no signals
This is intentional to reduce false positives
If you see no signals:
Check the Info Panel to see which filters are failing
Consider adjusting FVG lookback period
Temporarily disable FVG filter to test
Verify VWAP filters match current market trend
4. Market Profile Limitations
Market Profile requires sufficient volume data
Low-volume instruments may produce unreliable profiles
Value Areas update only on higher timeframe bar close
Works best on liquid markets (major forex pairs, indices, crypto)
📖 HOW TO USE
Step 1: Add to Chart
Apply indicator to M5 or higher timeframe chart
Ensure chart shows volume data
Use standard candles (NOT Heikin Ashi, Renko, etc.)
Step 2: Configure Settings
Primary MP Filter TF: Set to 60 (1 hour) minimum, or 240 (4 hour) for swing trading
Main MP TF: Set to 60 (1 hour) for intraday signals
FVG Timeframe: Match or exceed main MP timeframe
Leave other settings at default initially
Step 3: Understand the Info Panel
Monitor the top-right panel:
FILTER STATUS: Shows current directional bias
NEUTRAL = Both signals allowed
BUY ONLY = Only green triangles will appear
SELL ONLY = Only red triangles will appear
FVG Filter: Shows if bullish/bearish gaps detected recently
VWAP positions: Confirms trend alignment
Step 4: Take Signals
For BUY Signal (Green Triangle ▲):
Wait for green triangle to appear
Check Info Panel shows ✓ for BUY signals
Confirm current bar has closed
Enter long position
Stop loss: Below recent VAL or swing low
Target: Previous Value Area High or 1.5-2× risk
For SELL Signal (Red Triangle ▼):
Wait for red triangle to appear
Check Info Panel shows ✓ for SELL signals
Confirm current bar has closed
Enter short position
Stop loss: Above recent VAH or swing high
Target: Previous Value Area Low or 1.5-2× risk
Step 5: Risk Management
Risk per trade: Maximum 1-2% of account equity
Position sizing: Adjust based on stop loss distance
Avoid trading: During major news events or time filter periods
Multiple confirmations: Look for confluence with price action (support/resistance, trendlines)
🎓 UNDERLYING CONCEPTS
Market Profile Theory
Developed by J. Peter Steidlmayer in the 1980s, Market Profile organizes price and volume data to identify:
Value Areas: Where 70% of trading activity occurred
POC: Price level with highest acceptance (most volume)
Imbalances: When price moves away from value quickly
This indicator uses TPO (Time Price Opportunity) calculation method to build the volume profile distribution.
VWAP (Volume Weighted Average Price)
VWAP represents the average price weighted by volume, showing where institutional traders are positioned:
Price above VWAP = Bullish (institutions accumulated lower)
Price below VWAP = Bearish (institutions distributed higher)
Using dual VWAP (Session + Week) creates multi-timeframe trend alignment.
Fair Value Gaps (FVG)
Also known as "imbalance" or "inefficiency," FVG occurs when:
Price moves so rapidly that a gap forms in the candlestick structure
Indicates institutional order flow (large market orders)
Price often returns to "fill" these gaps (rebalance)
The 3-candle FVG pattern (gap between candle and candle ) is widely used in ICT (Inner Circle Trader) methodology and Smart Money Concepts.
🔍 CREDITS & CODE ATTRIBUTION
This indicator builds upon established technical analysis concepts and combines multiple methodologies:
1. Market Profile / TPO Calculation
Concept Origin: J. Peter Steidlmayer (Chicago Board of Trade, 1980s)
Code Inspiration: TradingView's public domain Market Profile examples
Modifications: Custom filtering logic for directional bias, dual timeframe implementation
2. VWAP Calculation
Concept Origin: Standard financial instrument (widely used since 1980s)
Code Base: TradingView built-in ta.vwap() function (public domain)
Modifications: Dual VWAP system with independent anchor periods, custom filtering modes
3. Fair Value Gap Detection
Concept Origin: Inner Circle Trader (ICT) / Smart Money Concepts methodology
Code Implementation: Original implementation based on 3-candle gap pattern
Features: Multi-timeframe detection, automatic mitigation tracking, visual zone display
4. Pine Script Framework
Language: Pine Script v6 (TradingView)
Built-in Functions Used:
ta.vwap() - Volume weighted average price
request.security() - Higher timeframe data access
ta.change() - Period detection
ta.cum() - Cumulative volume
time() - Timestamp functions
Note: All code is original implementation. While concepts are based on established trading methodologies, the combination, filtering logic, and execution are unique to this indicator.
📊 RECOMMENDED INSTRUMENTS
Best Performance:
Major Forex Pairs (EURUSD, GBPUSD, USDJPY)
Stock Indices (ES, NQ, SPX, DAX)
Major Cryptocurrencies (BTCUSD, ETHUSD)
Liquid Stocks (high daily volume)
Avoid:
Low-volume altcoins
Illiquid stocks
Exotic forex pairs with wide spreads
⚡ PERFORMANCE TIPS
Start Conservative: Enable all filters initially
Reduce Filters Gradually: If too few signals, disable Secondary VWAP filter first
Match Timeframes: Keep MP Filter TF and FVG TF at same value
Backtest First: Review historical performance on your preferred instrument/timeframe
Combine with Price Action: Look for support/resistance confluence
Use Time Filter: Avoid low-liquidity hours (optional setting)
🚫 WHAT THIS INDICATOR DOES NOT DO
Does not guarantee profits - No trading system is 100% accurate
Does not predict the future - Based on historical patterns
Does not replace risk management - Always use stop losses
Does not work on all instruments - Requires volume data and liquidity
Does not provide exact entry/exit prices - Signals are zones, not precise levels
Does not account for fundamentals - Purely technical analysis
📜 DISCLAIMER
This indicator is provided for educational and informational purposes only. It is not financial advice, and past performance does not guarantee future results.
Trading Risk Warning:
All trading involves risk of loss
You can lose more than your initial investment (leverage products)
Only trade with capital you can afford to lose
Always use appropriate position sizing and risk management
Consider seeking advice from a licensed financial advisor
Technical Limitations:
Indicator may repaint FVG zones until HTF bar closes
Signals are based on historical patterns that may not repeat
Market conditions change and no system works in all environments
Volume data quality varies by exchange/broker
By using this indicator, you acknowledge these risks and agree that the author bears no responsibility for trading losses.
📞 SUPPORT & UPDATES
Questions? Comment on this publication
Issues? Describe the problem with chart screenshot
Feature Requests? Suggest improvements in comments
Updates: Will be published as new versions using TradingView's update feature
📝 VERSION HISTORY
Version 1.0 (Current)
Initial public release
Multi-filter system: MP + Dual VWAP + FVG
Directional bias filter
Real-time info panel
Comprehensive alert system
Time-based filtering
Thank you for using Smart VWAP FVG System!
Happy Trading! 📈

Smart MACD Volume Trader# Smart MACD Volume Trader
## Overview
Smart MACD Volume Trader is an enhanced momentum indicator that combines the classic MACD (Moving Average Convergence Divergence) oscillator with an intelligent high-volume filter. This combination significantly reduces false signals by ensuring that trading signals are only generated when price momentum is confirmed by substantial volume activity.
The indicator supports over 24 different instruments including major and exotic forex pairs, precious metals (gold and silver), energy commodities (crude oil, natural gas), and industrial metals (copper). For forex and commodity traders, the indicator automatically maps to CME and COMEX futures contracts to provide accurate institutional-grade volume data.
## Originality and Core Concept
Traditional MACD indicators generate signals based solely on price momentum, which can result in numerous false signals during low-activity periods or ranging markets. This indicator addresses this critical weakness by introducing a volume confirmation layer with automatic institutional volume integration.
**What makes this approach original:**
- Signals are triggered only when MACD crossovers coincide with elevated volume activity
- Implements a lookback mechanism to detect volume spikes within recent bars
- Automatically detects and maps 24+ forex pairs and commodities to their corresponding CME and COMEX futures contracts
- Provides real institutional volume data for forex pairs where spot volume is unreliable
- Combines two independent market dimensions (price momentum and volume) into a single, actionable signal
- Includes intelligent asset detection that works across multiple exchanges and ticker formats
**The underlying principle:** Volume validates price movement. When institutional money enters the market, it creates volume signatures. By requiring high volume confirmation and using actual institutional volume data from futures markets, this indicator filters out weak price movements and focuses on trades backed by genuine market participation. The automatic futures mapping ensures that forex and commodity traders always have access to the most accurate volume data available, without manual configuration.
## How It Works
### MACD Component
The indicator calculates MACD using standard methodology:
1. **Fast EMA (default: 12 periods)** - Tracks short-term price momentum
2. **Slow EMA (default: 26 periods)** - Tracks longer-term price momentum
3. **MACD Line** - Difference between Fast EMA and Slow EMA
4. **Signal Line (default: 9-period SMA)** - Smoothed average of MACD line
**Crossover signals:**
- **Bullish:** MACD line crosses above Signal line (momentum turning positive)
- **Bearish:** MACD line crosses below Signal line (momentum turning negative)
### Volume Filter Component
The volume filter adds an essential confirmation layer:
1. **Volume Moving Average** - Calculates exponential MA of volume (default: 20 periods)
2. **High Volume Threshold** - Multiplies MA by ratio (default: 2.0x or 200%)
3. **Volume Detection** - Identifies bars where current volume exceeds threshold
4. **Lookback Period** - Checks if high volume occurred in recent bars (default: 5 bars)
**Signal logic:**
- Buy/Sell signals only trigger when BOTH conditions are met:
- MACD crossover/crossunder occurs
- High volume detected within lookback period
### Automatic CME Futures Integration
For forex traders, spot FX volume data can be unreliable or non-existent. This indicator solves this problem by automatically detecting forex pairs and mapping them to corresponding CME futures contracts with real institutional volume data.
**Supported Major Forex Pairs (7):**
- EURUSD → CME:6E1! (Euro FX Futures)
- GBPUSD → CME:6B1! (British Pound Futures)
- AUDUSD → CME:6A1! (Australian Dollar Futures)
- USDJPY → CME:6J1! (Japanese Yen Futures)
- USDCAD → CME:6C1! (Canadian Dollar Futures)
- USDCHF → CME:6S1! (Swiss Franc Futures)
- NZDUSD → CME:6N1! (New Zealand Dollar Futures)
**Supported Exotic Forex Pairs (4):**
- USDMXN → CME:6M1! (Mexican Peso Futures)
- USDRUB → CME:6R1! (Russian Ruble Futures)
- USDBRL → CME:6L1! (Brazilian Real Futures)
- USDZAR → CME:6Z1! (South African Rand Futures)
**Supported Cross Pairs (6):**
- EURJPY → CME:6E1! (Uses Euro Futures)
- GBPJPY → CME:6B1! (Uses British Pound Futures)
- EURGBP → CME:6E1! (Uses Euro Futures)
- AUDJPY → CME:6A1! (Uses Australian Dollar Futures)
- EURAUD → CME:6E1! (Uses Euro Futures)
- GBPAUD → CME:6B1! (Uses British Pound Futures)
**Supported Precious Metals (2):**
- Gold (XAUUSD, GOLD) → COMEX:GC1! (Gold Futures)
- Silver (XAGUSD, SILVER) → COMEX:SI1! (Silver Futures)
**Supported Energy Commodities (3):**
- WTI Crude Oil (USOIL, WTIUSD) → NYMEX:CL1! (Crude Oil Futures)
- Brent Oil (UKOIL) → NYMEX:BZ1! (Brent Crude Futures)
- Natural Gas (NATGAS) → NYMEX:NG1! (Natural Gas Futures)
**Supported Industrial Metals (1):**
- Copper (COPPER) → COMEX:HG1! (Copper Futures)
**How the automatic detection works:**
The indicator intelligently identifies the asset type by analyzing:
1. Exchange name (FX, OANDA, TVC, COMEX, NYMEX, etc.)
2. Currency pair pattern (6-letter codes like EURUSD, GBPUSD)
3. Commodity identifiers (XAU for gold, XAG for silver, OIL for crude)
When a supported instrument is detected, the indicator automatically switches to the corresponding futures contract for volume analysis. For stocks, cryptocurrencies, and other assets, the indicator uses the native volume data from the current chart.
**Visual feedback:**
An information table appears in the top-right corner of the MACD pane showing:
- Current chart symbol
- Exchange name
- Currency pair or asset name
- Volume source being used (highlighted in orange for futures, yellow for native volume)
- Current high volume status
This provides complete transparency about which data source the indicator is using for its volume analysis.
## How to Use
### Basic Setup
1. Add the indicator to your chart
2. The indicator displays in a separate pane (MACD) and overlay (signals/volume bars)
3. Default settings work well for most assets, but can be customized
### Signal Interpretation
### Visual Signals
**Visual Signals:**
- **Green "BUY" label** - Bullish MACD crossover confirmed by high volume
- **Red "SELL" label** - Bearish MACD crossunder confirmed by high volume
- **Green/Red candles** - Highlight bars with volume exceeding the threshold
- **Light green/red background** - Emphasizes signal bars on the chart
**Information Table:**
A detailed information table appears in the top-right corner of the MACD pane, providing real-time transparency about the indicator's operation:
- **Chart:** Current symbol being analyzed
- **Exchange:** The exchange or data feed being used
- **Pair:** The currency pair or asset name extracted from the ticker
- **Volume From:** The actual symbol used for volume analysis
- Orange color indicates CME or COMEX futures are being used (automatic institutional volume)
- Yellow color indicates native volume from the chart symbol is being used
- Hover tooltip shows whether automatic futures mapping is active
- **High Volume:** Current status showing YES (green) when volume exceeds threshold, NO (gray) otherwise
This table ensures complete transparency and allows you to verify that the correct volume source is being used for your analysis.
**Volume Analysis:**
- Gray histogram bars = Normal volume
- Red histogram bars = High volume (exceeds threshold)
- Green line = Volume moving average baseline
**MACD Analysis:**
- Blue line = MACD line (momentum indicator)
- Orange line = Signal line (trend confirmation)
- Gray dotted line = Zero line (bullish above, bearish below)
### Parameter Customization
**MACD Parameters:**
- Adjust Fast/Slow EMA lengths for different sensitivities
- Shorter periods = More signals, faster response
- Longer periods = Fewer signals, less noise
**Volume Parameters:**
- **Volume MA Period:** Higher values smooth volume analysis
- **High Volume Ratio:** Lower values (1.5x) = More signals; Higher values (3.0x) = Fewer, stronger signals
- **Volume Lookback Bars:** Controls how recent the volume spike must be
**Direction Filters:**
- **Only Buy Signals:** Enables long-only strategy mode
- **Only Sell Signals:** Enables short-only strategy mode
### Alert Configuration
The indicator includes three alert types:
1. **Buy Signal Alert** - Triggers when bullish signal appears
2. **Sell Signal Alert** - Triggers when bearish signal appears
3. **High Volume Alert** - Triggers when volume exceeds threshold
To set up alerts:
1. Click the indicator name → "Add alert on Smart MACD Volume Trader"
2. Select desired alert condition
3. Configure notification method (popup, email, webhook, etc.)
## Trading Strategy Guidelines
### Best Practices
**Recommended markets:**
- Liquid stocks (large-cap, high daily volume)
- Major forex pairs (EURUSD, GBPUSD, USDJPY, AUDUSD, USDCAD, USDCHF, NZDUSD)
- Exotic forex pairs (USDMXN, USDRUB, USDBRL, USDZAR)
- Cross pairs (EURJPY, GBPJPY, EURGBP, AUDJPY, EURAUD, GBPAUD)
- Precious metals (Gold, Silver with automatic COMEX futures mapping)
- Energy commodities (Crude Oil, Natural Gas with automatic NYMEX futures mapping)
- Industrial metals (Copper with automatic COMEX futures mapping)
- Major cryptocurrency pairs
- Index futures and ETFs
**Timeframe recommendations:**
- **Day trading:** 5-minute to 15-minute charts
- **Swing trading:** 1-hour to 4-hour charts
- **Position trading:** Daily charts
**Risk management:**
- Use signals as entry confirmation, not standalone strategy
- Combine with support/resistance levels
- Consider overall market trend direction
- Always use stop-loss orders
### Strategy Examples
**Trend Following Strategy:**
1. Identify overall trend using higher timeframe (e.g., daily chart)
2. Trade only in trend direction
3. Use "Only Buy" filter in uptrends, "Only Sell" in downtrends
4. Enter on signal, exit on opposite signal or at resistance/support
**Volume Breakout Strategy:**
1. Wait for consolidation period (low volume, tight MACD range)
2. Enter when signal appears with high volume (confirms breakout)
3. Target previous swing highs/lows
4. Stop loss below/above recent consolidation
**Forex Scalping Strategy (with automatic CME futures):**
1. The indicator automatically detects forex pairs and uses CME futures volume
2. Trade during active sessions only (use session filter)
3. Focus on quick profits (10-20 pips)
4. Exit at opposite signal or profit target
**Commodities Trading Strategy (Gold, Silver, Oil):**
1. The indicator automatically maps to COMEX and NYMEX futures contracts
2. Trade during high-liquidity sessions (overlap of major markets)
3. Use the high volume confirmation to identify institutional entry points
4. Combine with key support and resistance levels for entries
5. Monitor the information table to confirm futures volume is being used (orange color)
6. Exit on opposite MACD signal or at predefined profit targets
## Why This Combination Works
### The Volume Advantage
Studies consistently show that price movements accompanied by high volume are more likely to continue, while low-volume movements often reverse. This indicator leverages this principle by requiring volume confirmation.
**Key benefits:**
1. **Reduced False Signals:** Eliminates MACD whipsaws during low-volume consolidation
2. **Confirmation Bias:** Two independent indicators (price momentum + volume) agreeing
3. **Institutional Alignment:** High volume often indicates institutional participation
4. **Trend Validation:** Volume confirms that price momentum has "conviction"
### Statistical Edge
By combining two uncorrelated signals (MACD crossovers and volume spikes), the indicator creates a higher-probability setup than either signal alone. The lookback mechanism ensures signals aren't missed if volume spike slightly precedes the MACD cross.
## Supported Exchanges and Automatic Detection
The indicator includes intelligent asset detection that works across multiple exchanges and ticker formats:
**Forex Exchanges (Automatic CME Mapping):**
- FX (TradingView forex feed)
- OANDA
- FXCM
- SAXO
- FOREXCOM
- PEPPERSTONE
- EASYMARKETS
- FX_IDC
**Commodity Exchanges (Automatic COMEX/NYMEX Mapping):**
- TVC (TradingView commodity feed)
- COMEX (directly)
- NYMEX (directly)
- ICEUS
**Other Asset Classes (Native Volume):**
- Stock exchanges (NASDAQ, NYSE, AMEX, etc.)
- Cryptocurrency exchanges (BINANCE, COINBASE, KRAKEN, etc.)
- Index providers (SP, DJ, etc.)
The detection algorithm analyzes three factors:
1. Exchange prefix in the ticker symbol
2. Pattern matching for currency pairs (6-letter codes)
3. Commodity identifiers in the symbol name
This ensures accurate automatic detection regardless of which data feed or exchange you use for charting. The information table in the top-right corner always displays which volume source is being used, providing complete transparency.
## Technical Details
**Calculations:**
- MACD Fast MA: EMA(close, fastLength)
- MACD Slow MA: EMA(close, slowLength)
- MACD Line: Fast MA - Slow MA
- Signal Line: SMA(MACD Line, signalLength)
- Volume MA: Exponential MA of volume
- High Volume: Current volume >= Volume MA × Ratio
**Signal logic:**
```
Buy Signal = (MACD crosses above Signal) AND (High volume in last N bars)
Sell Signal = (MACD crosses below Signal) AND (High volume in last N bars)
```
## Parameters Reference
| Parameter | Default | Description |
|-----------|---------|-------------|
| Volume Symbol | Blank | Manual override for volume source (leave blank for automatic detection) |
| Use CME Futures | False | Legacy option (automatic detection is now built-in) |
| Alert Session | 1530-2200 | Active session time range for alerts |
| Timezone | UTC+1 | Timezone for alert sessions |
| Volume MA Period | 20 | Number of periods for volume moving average |
| High Volume Ratio | 2.0 | Volume threshold multiplier (2.0 = 200% of average) |
| Volume Lookback | 5 | Number of bars to check for high volume confirmation |
| MACD Fast Length | 12 | Fast EMA period for MACD calculation |
| MACD Slow Length | 26 | Slow EMA period for MACD calculation |
| MACD Signal Length | 9 | Signal line SMA period |
| Only Buy | False | Filter to show only bullish signals |
| Only Sell | False | Filter to show only bearish signals |
| Show Signals | True | Display buy and sell labels on chart |
## Optimization Tips
**For volatile markets (crypto, small caps):**
- Increase High Volume Ratio to 2.5-3.0
- Reduce Volume Lookback to 3-4 bars
- Consider faster MACD settings (8, 17, 9)
**For stable markets (large-cap stocks, bonds):**
- Decrease High Volume Ratio to 1.5-1.8
- Increase Volume MA Period to 30-50
- Use standard MACD settings
**For forex (with automatic CME futures):**
- The indicator automatically uses CME futures when forex pairs are detected
- Set appropriate trading session based on your timezone
- Use Volume Lookback of 5-7 bars
- Consider session-based alerts only
- Monitor the information table to verify correct futures mapping
**For commodities (Gold, Silver, Oil, Copper):**
- The indicator automatically maps to COMEX and NYMEX futures
- Increase High Volume Ratio to 2.0-2.5 for metals
- Use slightly higher Volume MA Period (25-30) for smoother analysis
- Trade during active market hours for best volume data
- The information table will show the futures contract being used (orange highlight)
## Limitations and Considerations
**What this indicator does NOT do:**
- Does not predict future price direction
- Does not guarantee profitable trades
- Does not replace proper risk management
- Does not work well in extremely low-volume conditions
**Market conditions to avoid:**
- Pre-market and after-hours sessions (low volume)
- Major news events (volatile, unpredictable volume)
- Holidays and low-liquidity periods
- Extremely low float stocks
## Conclusion
Smart MACD Volume Trader represents a significant evolution of the traditional MACD indicator by combining volume confirmation with automatic institutional volume integration. This dual-confirmation approach significantly improves signal quality by filtering out low-conviction price movements and ensuring traders work with accurate volume data.
The indicator's automatic detection and mapping system supports over 24 instruments across forex, commodities, and metals markets. By intelligently switching to CME and COMEX futures contracts when appropriate, the indicator provides forex and commodity traders with the same quality of volume data that stock traders naturally have access to.
This indicator is particularly valuable for traders who want to:
- Align their entries with institutional money flow
- Avoid getting trapped in false breakouts
- Trade forex pairs with reliable volume data
- Access accurate volume information for gold, silver, and energy commodities
- Combine momentum and volume analysis in a single, streamlined tool
Whether you are day trading stocks, swing trading forex pairs, or positioning in commodities markets, this indicator provides a robust framework for identifying high-probability momentum trades backed by genuine institutional participation. The automatic futures mapping works seamlessly across all supported instruments, requiring no manual configuration or expertise in futures markets.
---
## Support and Updates
This indicator is actively maintained and updated based on user feedback and market conditions. For questions about implementation or custom modifications, please use the comments section below.
**Disclaimer:** This indicator is for educational and informational purposes only. Past performance does not guarantee future results. Always conduct your own analysis and risk management before trading.

Smart Gap Projection MTF Smart Gap Projection MTF
## Brief Description
Professional indicator for projecting US Dollar Index (DXY) gaps onto the traded instrument with multi-timeframe analysis support and advanced visualization.
---
## Originality and Uniqueness
**Smart Gap Projection MTF** is a unique development that solves the specific task of correlation analysis between the Dollar Index (DXY) and currency pairs, cryptocurrencies, or other dollar-dependent assets.
### What makes this indicator original:
1. **Inter-market gap projection** - the indicator doesn't just display gaps on the current instrument, but projects gaps from the DXY index onto your asset's chart, creating unique trading levels
2. **Dual confirmation system** - uses a mechanism of waiting N candles after a gap appears on DXY to filter false signals
3. **Intelligent lifecycle tracking** - each projected level is tracked until price touch or gap closure on DXY, with automatic visualization changes
4. **Multi-Timeframe extension** - ability to simultaneously display gaps from a lower timeframe of the current instrument to identify intraday opportunities
5. **Adaptive visualization (Heatmap)** - line intensity and width automatically change depending on gap size, helping to visually identify the most significant levels
---
## How the Indicator Works
### Core Operating Principle
The indicator analyzes the US Dollar Index (DXY) price movement in real-time and identifies gaps (price breaks) between candle closes and opens. When a gap forms on DXY, the indicator:
1. **Determines gap type** - bullish (price opened above previous close) or bearish (price opened below)
2. **Checks gap size** - filters insignificant gaps by absolute size (in points) and percentage value
3. **Waits for confirmation** - after detecting a gap, the indicator waits for a specified number of candles (default 3) to confirm that the gap didn't close immediately
4. **Projects the level** - after confirmation, a horizontal line is drawn on the current instrument's chart at the High level (for bullish DXY gap) or Low level (for bearish DXY gap) of the candle where the gap formed
5. **Tracks status** - the indicator continuously monitors:
- Price touching the projected level (line becomes more transparent)
- Gap closure on DXY itself (line changes color to orange)
### Conceptual Foundation
The methodology is based on the observation that:
- Gaps on the Dollar Index often lead to synchronous movements on correlated assets
- Price levels at the moment of DXY gap formation become price magnets
- Gap closure on DXY often coincides with trend reversal on dependent instruments
---
## How to Use the Indicator
### Basic Setup
1. **Add the indicator to the chart** of any asset correlated with the dollar (EUR/USD, GBP/USD, Bitcoin, Gold, etc.)
2. **Configure main parameters:**
- `DXY Symbol` - leave as "TVC:DXY" (standard Dollar Index ticker)
- `Minimum gap size` - minimum gap size in points (0.0001-0.001 for DXY)
- `Confirmation candles` - number of confirmation candles (recommended 3-5)
3. **Set up visualization:**
- Choose colors for bullish and bearish gaps
- Set desired transparency for each gap type
- Enable/disable `Use heatmap` for adaptive visualization
### Timeframe Recommendations
- **Scalping (M1-M5):** use MTF gaps from M1 timeframe, confirmationCandles = 2-3
- **Intraday (M15-H1):** standard settings, can add MTF M5-M15
- **Swing trading (H4-D1):** increase confirmationCandles to 5-10, MTF H1-H4
### Use with Other Instruments
The indicator is universal and works on:
- **Forex:** EUR/USD, GBP/USD, USD/JPY, AUD/USD and other dollar pairs
- **Cryptocurrencies:** BTC/USD, ETH/USD (direct dollar dependency)
- **Commodities:** Gold (XAU/USD), Silver (XAG/USD), Oil
- **Indices:** SPX, NDX, especially during dollar movements
---
## Configuration Parameters
### Main Settings
- **DXY Symbol** - Dollar Index symbol (default TVC:DXY)
- **Minimum gap size** - minimum gap size in points for filtering
- **Minimum gap size (%)** - minimum percentage size (0 = disabled)
- **Confirmation candles** - number of candles for confirmation (1-10)
- **Maximum gaps on chart** - maximum number of displayed projections
### Multi-Timeframe
- **Enable MTF gaps** - enable/disable MTF gaps
- **Timeframe for gaps** - select lower timeframe for search
- **Max MTF gaps** - maximum number of MTF lines (5-2000)
- **Min MTF gap size** - minimum MTF gap size
- **MTF lines color** - MTF lines color
- **MTF lines style** - line style (Solid/Dashed/Dotted)
- **MTF lines width** - MTF lines width (1-3)
### Visualization
- **Extend lines right** - extend lines to the right
- **Use heatmap** - use adaptive visualization (width/brightness from gap size)
- **Stop lines when DXY gap closes** - stop lines when gap closes on DXY
### Colors
- **Bullish gap color** - color of bullish DXY gap lines
- **Bullish Transparency** - transparency of bullish lines (0-90)
- **Bearish gap color** - color of bearish DXY gap lines
- **Bearish Transparency** - transparency of bearish lines (0-90)
- **Line style** - style of all projection lines
### Alerts
- **Alert on new gap** - notification when new gap is confirmed
---
## Features and Advantages
✅ **Inter-market analysis** - uses correlation between DXY and traded asset
✅ **Automatic filtering** - excludes insignificant and quickly closing gaps
✅ **Multi-timeframe analysis** - combines signals from different time periods
✅ **Visual hierarchy** - heatmap automatically highlights most significant levels
✅ **Lifecycle tracking** - each level is monitored until touch or gap closure
✅ **Universality** - works on any dollar-correlated assets
✅ **Non-repainting** - all levels are fixed historically and don't change
✅ **Customizable visualization** - full control over colors, styles and transparency
---
## Limitations and Important Notes
⚠️ **Indicator is not a trading system** - it's a technical analysis tool requiring confirmation by other methods
⚠️ **Works only on assets correlated with DXY** - on instruments without dollar correlation, signals will be ineffective
⚠️ **Requires understanding of inter-market relationships** - recommended to study correlations between DXY and your instrument
⚠️ **DXY data quality** - ensure your data provider supplies correct TVC:DXY history
⚠️ **MTF data** - when using very low MTF timeframes, delays in updates are possible
---
## Who This Indicator Is For
👨💼 **Forex traders** - analyzing macroeconomic dollar movements
📈 **Crypto traders** - considering dollar influence on Bitcoin and altcoins
🥇 **Commodity market traders** - trading gold, silver, oil
📊 **Intraday scalpers** - using MTF for precise entries
📉 **Swing traders** - looking for medium-term entry points at key levels
---
## Disclaimer
This indicator is intended solely for educational and informational purposes. It is not financial advice or a recommendation to act. All trading decisions you make at your own risk. Past results do not guarantee future performance. Always use proper risk management.

Smart Margin Zone
SMART MARGIN ZONE - CME-BASED SUPPORT & RESISTANCE INDICATOR
TITLE FOR PUBLICATION:
Smart Margin Zone - CME Margin-Based Support and Resistance
CATEGORY:
Support and Resistance
SHORT DESCRIPTION (for preview):
Automatically plots margin zones based on CME Group requirements. These zones represent critical price levels where leveraged traders face margin calls, creating natural support and resistance through forced liquidations.
═══════════════════════════════════════════════════════════════
FULL DESCRIPTION FOR TRADINGVIEW:
═══════════════════════════════════════════════════════════════
📊 Smart Margin Zone - Professional Trading Zones Based on CME Data
This indicator automatically calculates and displays margin zones derived from official CME Group margin requirements. These zones represent critical price levels where traders using leverage receive margin calls, triggering forced position closures that create natural support and resistance levels.
═══════════════════════════════════════════════════════════════
🎯 CORE CONCEPT
═══════════════════════════════════════════════════════════════
When price reaches calculated margin zones, traders using 2:1 or 4:1 leverage on CME futures receive margin calls. Brokers automatically liquidate these positions, creating waves of buying or selling pressure that form strong support and resistance levels.
This is not theoretical - it's based on actual margin requirements from CME Group, the world's largest derivatives marketplace.
═══════════════════════════════════════════════════════════════
📐 CALCULATION METHODOLOGY
═══════════════════════════════════════════════════════════════
The indicator uses the following formula to calculate zone sizes:
Zone Size = (Margin Requirement / Tick Value) × Tick Size × 1.10
Where:
• Margin Requirement = Official CME initial margin (updated November 2024)
• Tick Value = Dollar value of minimum price movement
• Tick Size = Minimum price increment
• 1.10 = 10% buffer for realistic zone width
SUPPORTED INSTRUMENTS WITH CME DATA:
Currency Pairs:
• EURUSD: $2,100 margin → 0.0168 zone size
• GBPUSD: $1,800 margin → 0.0144 zone size
• AUDUSD: $1,300 margin → 0.0065 zone size
• NZDUSD: $1,100 margin → 0.0055 zone size
• USDJPY: $3,200 margin → custom calculation
• USDCAD: $950 margin → calculated
• USDCHF: $1,650 margin → calculated
Commodities:
• Gold (XAUUSD): $8,000 margin → 80 points zone size
• Silver (XAGUSD): $6,500 margin → calculated
• WTI Crude Oil: $4,500 margin → calculated
═══════════════════════════════════════════════════════════════
🔍 HOW IT WORKS
═══════════════════════════════════════════════════════════════
1. SWING POINT DETECTION
The indicator automatically identifies swing highs and swing lows using a configurable lookback period (default 10 bars). These become anchor points for zone calculations.
2. FIVE ZONE LEVELS
From each swing point, five zone levels are calculated:
• Zone 1/4 (25%) - First correction level
• Zone 1/2 (50%) - KEY ZONE for trend determination
• Zone 3/4 (75%) - Intermediate level
• Zone 1/1 (100%) - Full margin zone (strongest level)
• Zone 5/4 (125%) - Extended zone
3. TREND IDENTIFICATION
• Close above Zone 1/2 resistance = Bullish trend
• Close below Zone 1/2 support = Bearish trend
• Between zones = Range/consolidation
4. HISTORICAL CONTEXT
Current zones are displayed prominently with fills and labels. Historical zones appear as thin, semi-transparent lines for context without cluttering the chart.
═══════════════════════════════════════════════════════════════
⚙️ FEATURES
═══════════════════════════════════════════════════════════════
AUTOMATED CALCULATION:
✅ Auto-detection of swing highs and lows
✅ Real-time zone updates as new swings form
✅ CME margin data built-in for major instruments
✅ Manual override option for custom calculations
VISUAL CLARITY:
✅ Color-coded zones (red=resistance, green=support)
✅ Adjustable transparency for fills and lines
✅ Current zones bold with fills and price labels
✅ Historical zones thin and transparent
✅ Swing point markers show calculation origins
CUSTOMIZATION:
✅ Show/hide individual zone levels (1/4, 1/2, 3/4, 1/1, 5/4)
✅ Toggle historical zones on/off
✅ Adjustable lookback period (5-50 bars)
✅ Customizable colors for all elements
✅ Line width and transparency controls
✅ Zone extension options (none/right/both)
TREND ANALYSIS:
✅ Optional trend background coloring
✅ Customizable trend colors and transparency
✅ Real-time trend identification display
STATISTICS:
✅ Live statistics table showing:
- Current instrument
- Active zone size
- Calculation mode
- Current trend direction
- Number of zones displayed
ALERTS:
✅ Zone 1/2 breakout (up/down)
✅ Full margin zone 1/1 reached
✅ Customizable alert messages
═══════════════════════════════════════════════════════════════
📈 TRADING APPLICATIONS
═══════════════════════════════════════════════════════════════
ENTRY SIGNALS:
• Bounces from zone levels = potential entry points
• Zone 1/2 breakouts = trend continuation entries
• Zone rejections = reversal opportunities
RISK MANAGEMENT:
• Zone levels = logical stop-loss placement
• Zone 1/1 = maximum risk level
• Zone spacing = position sizing guide
PROFIT TARGETS:
• Next zone level = first target
• Zone 1/1 = full profit target
• Zone breakouts = extended targets
TREND CONFIRMATION:
• Price above Zone 1/2 resistance = confirmed uptrend
• Price below Zone 1/2 support = confirmed downtrend
• Consolidation between zones = wait for breakout
═══════════════════════════════════════════════════════════════
📚 USAGE INSTRUCTIONS
═══════════════════════════════════════════════════════════════
GETTING STARTED:
1. Add indicator to chart of any supported instrument
2. Zones automatically calculate and display
3. Adjust swing detection period if needed (default 10 works well)
4. Customize colors and visibility to your preference
OPTIMAL SETTINGS:
• Best timeframes: H1, H4, Daily, Weekly
• Default swing length (10) suitable for most markets
• Show 2-3 historical zones for context
• Enable swing point markers to see calculation origins
INTERPRETATION:
• Watch for price reactions at zone boundaries
• Strong bounces = respect for margin level
• Clean breaks = momentum continuation
• Multiple touches = zone strength confirmation
SET ALERTS:
• Zone 1/2 breakouts for trend entries
• Zone 1/1 reaches for profit-taking
• Custom alerts for your specific strategy
═══════════════════════════════════════════════════════════════
⚠️ IMPORTANT NOTES
═══════════════════════════════════════════════════════════════
DATA ACCURACY:
• CME margin requirements updated November 2024
• Margins change periodically - check CME Group website
• Manual mode available for latest margin data
• Indicator provides analysis tool, not financial advice
STATISTICAL PERFORMANCE:
• Historical data shows >60% probability of continued movement after Zone 1/2 breakout
• Zone effectiveness varies by market conditions
• Best results in trending markets with clear swings
LIMITATIONS:
• Margin requirements change - monitor CME updates
• Works best on liquid instruments with clear swings
• Not a standalone trading system
• Should be combined with additional analysis
═══════════════════════════════════════════════════════════════
🔧 METHODOLOGY CREDIT
═══════════════════════════════════════════════════════════════
This indicator is based on the margin zones concept developed by Alexander Bazylev (BTrade indicator for MetaTrader platforms).
The TradingView implementation has been completely rewritten with original enhancements:
• Multiple zone levels instead of single level
• Automatic swing point detection algorithm
• Direct CME data integration
• Historical zone visualization
• Advanced customization options
• Comprehensive statistics and alerts
All code is original and specifically designed for TradingView's Pine Script v5 environment.
═══════════════════════════════════════════════════════════════
💡 BEST PRACTICES
═══════════════════════════════════════════════════════════════
COMBINE WITH:
• Volume analysis for confirmation
• Trend indicators for direction bias
• Price action patterns at zones
• Higher timeframe analysis
AVOID:
• Trading against strong trends at minor zones
• Over-leveraging based solely on zone placement
• Ignoring broader market context
• Expecting perfect bounces every time
OPTIMIZE:
• Adjust swing length for different timeframes
• Shorter period (5-7) for intraday trading
• Longer period (15-20) for swing trading
• Test historical effectiveness on your instruments
═══════════════════════════════════════════════════════════════
📖 EDUCATIONAL VALUE
═══════════════════════════════════════════════════════════════
This indicator helps traders understand:
• How institutional margin requirements affect price
• Where forced liquidations create pressure
• Natural support and resistance formation
• Relationship between leverage and price levels
• Market structure and key technical levels
═══════════════════════════════════════════════════════════════
🔄 VERSION HISTORY
═══════════════════════════════════════════════════════════════
Version 1.0 (Initial Release):
• CME-based zone calculation for 10 instruments
• Automatic swing high/low detection
• 5 zone levels with customizable display
• Historical zones with transparency control
• Swing point markers
• Trend background indicator
• Live statistics table
• Multiple alert conditions
• Fully customizable colors and styles
• English language interface
═══════════════════════════════════════════════════════════════
📞 SUPPORT & FEEDBACK
═══════════════════════════════════════════════════════════════
Questions or suggestions? Leave a comment below!
If you find this indicator useful:
⭐ Please leave a like
💬 Share your experience in comments
🔔 Follow for updates and new indicators
═══════════════════════════════════════════════════════════════
⚖️ DISCLAIMER
═══════════════════════════════════════════════════════════════
This indicator is provided for educational and analytical purposes only. It is not financial advice and should not be the sole basis for trading decisions.
• Past performance does not guarantee future results
• Trading involves substantial risk of loss
• CME margin requirements subject to change
• Always do your own research and risk management
• Consult a financial advisor for investment advice
The creator is not responsible for any trading losses incurred through use of this indicator.
