Smart Breakout with ATR Stop-LossThe Smart Breakout indicator combines a classic 20-day Donchian channel breakout with a tight trailing stop, drawing green lines and “ENTRY” labels at the bar after a valid breakout, and red lines and “EXIT” label at the bar after a stop-loss breach.
By default it uses the chart’s timeframe to compute ATR and stops, but you can flip on Daily lock to freeze both ATR and price reads at the daily resolution—so your stops stay the same whether you view at 1s, 15 m, 4h or lower frequency bars.
Key features:
20-day Donchian breakout: entry when price closes above the highest high of the previous 20 bars
2 × ATR(14) trailing stop: initialized at entry and raised only when the new (close – 2 × ATR) exceeds the prior stop
Daily lock option: Ensures all ATR and close values are calculated on the daily timeframe, keeping stop levels consistent across resolutions
Search in scripts for "smart"

Smart Grid Scalping (Pullback) Strategy[BullByte]The Smart Grid Scalping (Pullback) Strategy is a high-frequency trading strategy designed for short-term traders who seek to capitalize on market pullbacks. This strategy utilizes a dynamic ATR-based grid system to define optimal entry points, ensuring precise trade execution. It integrates volatility filtering and an RSI-based confirmation mechanism to enhance signal accuracy and reduce false entries.
This strategy is specifically optimized for scalping by dynamically adjusting trade levels based on current market conditions. The grid-based system helps capture retracement opportunities while maintaining strict trade management through predefined profit targets and trailing stop-loss mechanisms.
Key Features :
1. ATR-Based Grid System :
- Uses a 10-period ATR to dynamically calculate grid levels for entry points.
- Prevents chasing trades by ensuring price has reached key levels before executing entries.
2. No Trade Zone Protection :
- Avoids low-volatility zones where price action is indecisive.
- Ensures only high-momentum trades are executed to improve success rate.
3. RSI-Based Entry Confirmation :
- Long trades are triggered when RSI is below 30 (oversold) and price is in the lower grid zone.
- Short trades are triggered when RSI is above 70 (overbought) and price is in the upper grid zone.
4. Automated Trade Execution :
- Long Entry: Triggered when price drops below the first grid level with sufficient volatility.
- Short Entry: Triggered when price exceeds the highest grid level with sufficient volatility.
5. Take Profit & Trailing Stop :
- Profit target set at a customizable percentage (default 0.2%).
- Adaptive trailing stop mechanism using ATR to lock in profits while minimizing premature exits.
6. Visual Trade Annotations :
- Clearly labeled "LONG" and "SHORT" markers appear at trade entries for better visualization.
- Grid levels are plotted dynamically to aid decision-making.
Strategy Logic :
- The script first calculates the ATR-based grid levels and ensures price action has sufficient volatility before allowing trades.
- An additional RSI filter is used to ensure trades are taken at ideal market conditions.
- Once a trade is executed, the script implements a trailing stop and predefined take profit to maximize gains while reducing risks.
---
Disclaimer :
Risk Warning :
This strategy is provided for educational and informational purposes only. Trading involves significant risk, and past performance is not indicative of future results. Users are advised to conduct their own due diligence and risk management before using this strategy in live trading.
The developer and publisher of this script are not responsible for any financial losses incurred by the use of this strategy. Market conditions, slippage, and execution quality can affect real-world trading outcomes.
Use this script at your own discretion and always trade responsibly.

Smart Money Pivot Strategy [Jason Kasei]This strategy is designed to identify key pivot points (Pivot High and Pivot Low) in the market and leverage the "Smart Money" concept to capture price breakout opportunities. It supports both long and short trades, offering customizable stop-loss (SL) and take-profit (TP) settings, while visually plotting pivot points and breakout signals on the chart.
Core Features
Pivot Point Detection:
Utilizes ta.pivothigh and ta.pivotlow functions to detect the highest (Pivot High) and lowest (Pivot Low) points within a specified period (default: 20 bars).
Trading Signals:
Long Signal: Triggered when the price breaks above a previous Pivot High, indicating a potential uptrend.
Short Signal: Triggered when the price breaks below a previous Pivot Low, indicating a potential downtrend.
How It Works
Detects Pivot High (PH) and Pivot Low (PL) over the specified period and records their price and time.
Triggers a long entry when the price breaks above a Pivot High and a short entry when it falls below a Pivot Low.
Sets exit conditions automatically based on predefined SL and TP percentages after entry.
Plots breakout points and levels on the chart for analysis.
Considerations
The strategy relies on accurate pivot point detection; adjust the period parameter based on market volatility.
In highly volatile markets, consider widening the stop loss to avoid frequent triggering.
Combine with other indicators or analysis methods to validate signals and avoid blind trading.

Smart MACD Reversal Oscillator Pro [TradeDots]The TradeDots Smart MACD Reversal Oscillator Pro is an advanced technical analysis tool that combines traditional MACD functionality with multi-layered signal detection and divergence identification systems. This comprehensive oscillator helps traders identify potential market reversals, trend continuations, and extremes with greater precision than conventional indicators.
📝 HOW IT WORKS
Accumulation & Distribution Detection System
The indicator begins with a proprietary calculation that identifies potential accumulation and distribution phases:
Calculation: Processes EMA differentials with specific time constants to detect underlying accumulation/distribution pressure
Visualization: Green-filled areas indicate accumulation phases (bullish pressure building) while red-filled areas show distribution phases (bearish pressure building)
Significance: This system often identifies trend reversals before traditional indicators by detecting institutional buying/selling activity
Multi-Timeframe MACD Implementation
Unlike traditional MACD indicators that use a single timeframe, this oscillator incorporates multiple calculation methods:
1. Primary Oscillator: Uses a proprietary calculation that combines price extremes with smoothed averages:
Implements specialized moving average types (SMMA and ZLEMA)
Generates a histogram that changes color based on price position relative to these averages
Produces a signal line that identifies crossover opportunities
2. Secondary MACD: Traditional MACD implementation with customizable parameters:
User-selectable MA types (SMA/EMA) for both oscillator and signal line
Color-coded histogram for momentum visualization
Separate crossover detection system
Dynamic Band System
The indicator implements an innovative dynamic band system to identify overbought and oversold conditions:
Band Calculation: Analyzes historical oscillator values to establish statistically significant extremes
Adaptive Scaling: Automatically adjusts to different market volatility regimes using a customizable Y-axis scale factor
Signal Integration: Incorporates band levels into signal generation for higher-probability trades
Signal Generation System
Four distinct signal types are generated to identify potential trading opportunities:
Green Dots: Bullish crossover signals (primary oscillator crosses above signal line)
Red Dots: Bearish crossover signals (primary oscillator crosses below signal line)
Blue Dots: Secondary MACD bullish crossovers in oversold territory
Orange Dots: Secondary MACD bearish crossovers in overbought territory
Advanced Divergence Detection
The oscillator incorporates a sophisticated divergence detection system:
Regular Divergences: Identifies when price makes lower lows while the oscillator makes higher lows (bullish) or price makes higher highs while the oscillator makes lower highs (bearish)
Hidden Divergences: Optional detection of continuation patterns (currently disabled by default)
Visual Markers: Clear labels identifying divergence formations directly on the chart
Zero-Line Filter: Optional filtering to only detect divergences that don't cross the zero line
🛠️ HOW TO USE
Signal Interpretation
Momentum Direction
Histogram Color: Green shades indicate bullish momentum, red shades indicate bearish momentum
Oscillator Position: Above zero indicates bullish momentum, below zero indicates bearish momentum
Filled Background: Green fill shows accumulation phases, red fill shows distribution phases
Buy Signals (In Order of Strength)
Bullish Divergence + Green Dot: Highest probability reversal signal (price making lower lows while oscillator makes higher lows, followed by crossover)
Green Dot Below Short Average Line: Strong oversold reversal signal
Green Dot + Blue Dot Alignment: Multiple indicator confirmation
Green Dot During Green Fill Expansion: Trend continuation signal
Sell Signals (In Order of Strength)
Bearish Divergence + Red Dot: Highest probability reversal signal (price making higher highs while oscillator makes lower highs, followed by crossover)
Red Dot Above Long Average Line: Strong overbought reversal signal
Red Dot + Orange Dot Alignment: Multiple indicator confirmation
Red Dot During Red Fill Expansion: Trend continuation signal
Trading Strategies
Divergence Trading Strategy
Identify "Bullish" or "Bearish" divergence labels on the chart
Wait for confirming dot signal in the same direction
Enter when both divergence and dot signal align
Set stops based on recent swing points
Target the opposite band or previous significant level
Overbought/Oversold Reversal Strategy
Wait for the oscillator to reach extreme bands (Long or Short Average lines)
Look for crossover signals at these extreme levels:
Bullish Crossover (Oversold): Green dots when oscillator is below Short Average
Bearish Crossover (Overbought): Red dots when oscillator is above Long Average
Enter when price confirms the reversal
Set stops beyond the recent extreme
Target the opposite band or at least the zero line
Multi-Confirmation Strategy
For highest probability trades, look for:
Multiple signal types aligning (e.g., Green + Blue dots or Red + Orange dots)
Signals occurring at band extremes
Divergence patterns reinforcing the signal direction
Background fill color supporting the signal (green fill for buys, red fill for sells)
⚙️ CUSTOMIZATION OPTIONS
The indicator offers extensive customization to adapt to different markets and trading styles:
Y-axis scale factor: Controls the band range multiplier (default 2.5)
Parameter 1: Controls the smoothing period for main calculations (default 8)
Parameter 2: Controls the signal line calculation period (default 9)
Fast/Slow Length: Controls traditional MACD calculation periods (12/26)
Oscillator MA Type: Selection between SMA and EMA for main oscillator
Signal Line MA Type: Selection between SMA and EMA for signal line
Divergence Settings: Customizable lookback parameters and display options
Don't touch the zero line?: Toggle option for divergence filtering
❗️LIMITATIONS
Signal Lag: The system identifies reversals after they have begun, potentially missing the absolute bottom or top
False Signals: Can occur during periods of high volatility or during ranging markets
Divergence Validation: Not all divergences lead to reversals; confirmation is essential
Timeframe Sensitivity: The indicator works best on intermediate timeframes (15m to 4h) for most markets
Bar Closing Requirement: All signals are based on closed candles and may be subject to change until the candle closes
RISK DISCLAIMER
Trading involves substantial risk, and most traders may incur losses. All content, tools, scripts, articles, and education provided by TradeDots are for informational and educational purposes only. Past performance is not indicative of future results.
This oscillator should be used as part of a complete trading approach that includes proper risk management, consideration of the broader market context, and confirmation from price action patterns. No trading system can guarantee profits, and users should always exercise caution and use appropriate position sizing.

Smart Investor - Quarterly Earnings by tarunlalwani007OVERVIEW
Smart Investor - Quarterly Earnings displays comprehensive financial data and moving averages directly on your charts. It shows quarterly/yearly earnings alongside customizable moving averages across multiple timeframes, providing both fundamental and technical analysis in one tool.
This tool is designed purely for analysis purposes. No buy or sell recommendations should be made based solely on the information it provides. Always perform your own due diligence and combine multiple sources of information for trading decisions.
FEATURES
Financial Data Analysis
Displays quarterly (FQ) and yearly (FY) financial metrics
Works with both stocks and futures contracts
Customizable metrics with comparison capabilities
Flexible table positioning options
Multi-Timeframe Moving Averages
Daily, Weekly, and Monthly moving averages adapt to chart timeframe
Support for both EMA and SMA with customizable parameters
Color-coded for easy identification of different timeframes
Company Information Display
Information tags for quick company insights
Display key financial metrics and market performance indicators
SME status identification for small/medium enterprises (only for NSE and BSE India)
FNO and lot size information for derivatives
CALCULATION METHODS
Data Sources
Financial metrics (EPS, Sales, Total Shares) are sourced directly from TradingView's financial API
Price data is obtained using appropriate request functions for the current symbol
Header and Tag Calculations
Current Values: All header and tag metrics use the latest available close price
Market Cap: Latest Close Price × Total Outstanding Shares
Free Float Market Cap: Latest Close Price × Free Float Shares
Free Float Percentage: Obtained directly from TradingView financial data
P/E Ratio: Market Cap / TTM Net Income
52-Week Performance:
Down from 52W High: ((Current Close - 52W High) / 52W High) × 100
Up from 52W Low: ((Current Close - 52W Low) / 52W Low) × 100
Table Calculations
Historical Values: Table metrics use price data from the corresponding quarter/year
Quarter-over-Quarter (QoQ) Change: ((Current Value - Previous Quarter Value) / Previous Quarter Value) × 100
Year-over-Year (YoY) Change: ((Current Value - Value from Same Quarter Last Year) / Value from Same Quarter Last Year) × 100
Quarter names are determined based on the current month: Jan/Feb → Dec, Mar/Apr/May → Mar, Jun/Jul/Aug → Jun, Sep/Oct/Nov → Sep. Each quarter is labeled with its end month and year (e.g., "Mar-2024", "Jun-2024").
Moving Average Implementation
Moving Averages: Calculated based on chart timeframe (daily, weekly, monthly)
EMA/SMA: Uses standard formulas with configurable periods
Included with financial data to provide a complete analysis tool in a single indicator
CUSTOMIZATION OPTIONS
Financial Metrics
The following metrics can be selected for both quarterly and yearly tables:
Sales (Revenue)
EPS (Earnings Per Share)
OPM (Operating Profit Margin)
P/E Ratio
PEG Ratio
Free Float (percentage and value)
Market Cap
PAT (Profit After Tax)
Display Options
Comparison Visualization: Percentage mode, dots mode, or combined
Layout: Multiple table positions, adjustable text size
Themes: Light and dark theme support
History: Display up to 8 periods of historical data
Header Information
Company description
Market capitalization
Free float information
Listing year
Return on Equity (ROE)
Industry/Sector classification
Performance relative to 52-week high/low
FNO status and lot size
HOW TO USE
Add the indicator to your chart
Configure the metrics you want to display in the settings
Position the tables where you prefer on your chart
Customize colors and display options
Adjust moving averages to match your trading style
LIMITATIONS
Financial data availability depends on what TradingView provides for each instrument
Some calculations may show NA when underlying data is unavailable
Small market cap stocks or recently listed companies may have limited historical data
Futures contracts are detected automatically but may require manual verification
TECHNICAL NOTES
Automatic futures contract detection with calculation adjustments
SME status determined using an internal database of symbols that is manually maintained and updated
Date handling adjustments near quarter boundaries ensure consistency
All financial data is sourced directly from TradingView's financial API
Company description and sector information comes directly from TradingView symbol data

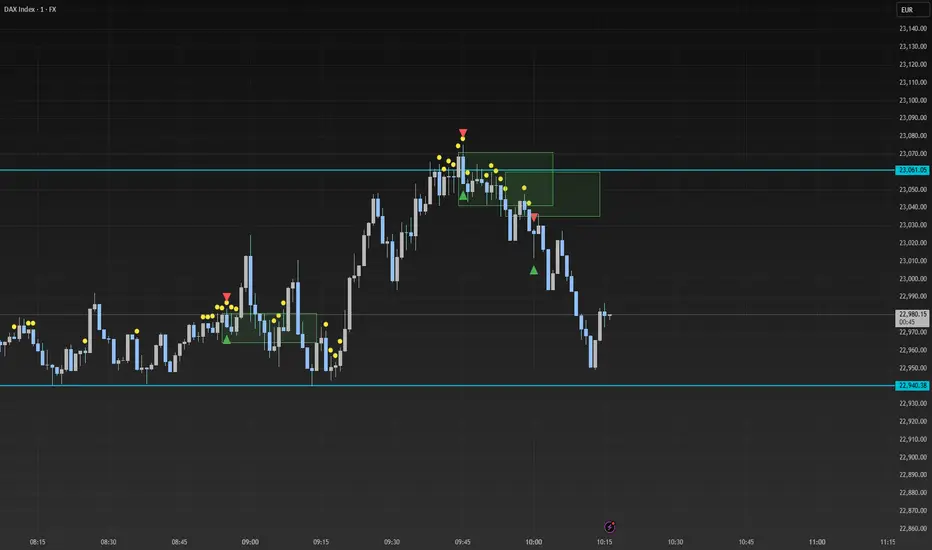
Smart Range Breakout - SwiftEdgeDescription:
The "Smart Range Breakout - SwiftEdge" indicator is a custom tool designed for identifying potential breakout opportunities on a 1-minute chart, with a focus on volatile markets like the DAX index. This script introduces a unique approach by combining range consolidation detection with volume confirmation and breakout validation, tailored for short-term trading strategies.
How It Works:
The indicator identifies consolidation periods where the price range (difference between the highest high and lowest low over a user-defined length) is below a multiple of the Average True Range (ATR). This helps detect periods of low volatility, which often precede breakouts.
Once a consolidation is confirmed (minimum number of bars), a green box is drawn on the chart, spanning a fixed length of bars (default 50), representing the potential breakout zone.
Breakouts are signaled only when a candle opens above the upper boundary (box top) or below the lower boundary (box bottom) of the consolidation box, ensuring a clear entry point based on price action at the open.
The script includes a volume filter, requiring volume to exceed a moving average by a specified multiplier, and a confirmation period to validate the breakout over consecutive bars.
To avoid signal clutter, only one breakout signal (up or down) is generated per box, and no further signals are issued until a new consolidation box is formed.
How to Use:
Apply the indicator to a 1-minute chart (optimized for DAX or similar volatile indices).
Adjust the "Consolidation Length" (default 5) to set the lookback period for detecting consolidation.
Modify the "Range Threshold (ATR Multiplier)" (default 2.0) to make the consolidation detection more or less strict based on market volatility.
Use "Minimum Consolidation Bars" (default 2) to set the minimum duration of a consolidation phase.
Tune "Confirmation Bars" (default 1) to require more bars to confirm the breakout.
Set "Volume MA Length" (default 5) and "Volume Multiplier" (default 1.1) to filter breakouts with insufficient volume.
Adjust "Max Box Length" (default 50) to control the duration of the breakout zone on the chart.
Look for green triangles below the chart for bullish breakouts and red triangles above for bearish breakouts, occurring when a candle opens outside the box with confirmed volume.
Originality:
This script stands out by integrating a fixed-length consolidation box with an opening-price breakout condition, combined with volume and multi-bar confirmation. Unlike traditional breakout indicators that rely solely on closing prices or simple price thresholds, this approach prioritizes the opening price and limits signals to one per cycle, reducing noise in volatile markets.
Chart Notes:
The accompanying chart displays the indicator's output with green boxes indicating consolidation zones, yellow dots marking consolidation periods, and green/red triangles for breakout signals. No additional scripts or unrelated drawings are included to ensure clarity.
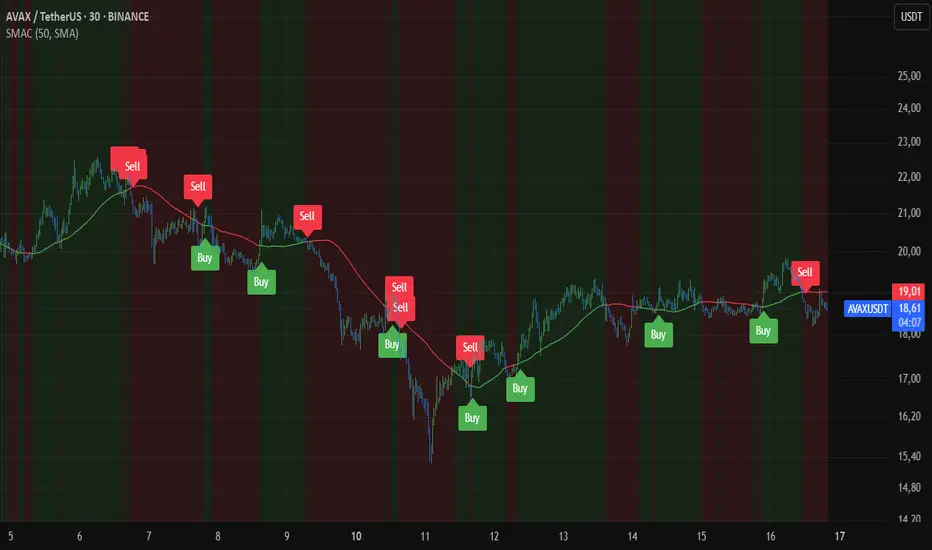
Smart MA CrossoverThe Smart MA Crossover indicator is a trend-following tool designed to help traders identify high-probability buy and sell signals based on a dynamic moving average and volume confirmation.
This indicator allows traders to customize the moving average type (SMA, EMA, HMA, WMA, VWMA, SMMA, or VWAP) while incorporating an ATR-based filter for better signal clarity.
How It Works
The script analyzes price movements in relation to a selected moving average and volume conditions to generate trend-based trade signals:
🟢 Buy Signal:
- Price is trading above the moving average for at least two bars.
- A sudden upward momentum is detected (price > open * 1.005).
- Volume is higher than the 50-period SMA of volume.
- The price was trading below the moving average three bars ago.
🔴 Sell Signal:
- Price is trading below the moving average for at least two bars.
- A sudden downward movement is detected (price < open * 0.995).
- Volume is higher than the 50-period SMA of volume.
- The price was trading above the moving average three bars ago.
- When these conditions are met, a label appears on the chart, marking the potential trade signal.
Key Features
- Customizable Moving Averages – Choose between SMA, EMA, HMA, WMA, VWMA, SMMA, or VWAP.
- Dynamic Trend Detection – Moving average color changes based on trend direction.
- Volume Confirmation – Avoid false signals by filtering trades using SMA-based volume analysis.
- ATR-Based Signal Placement – Labels are positioned dynamically based on ATR values to improve visibility.
- Background Trend Highlighting – The background changes color depending on whether price is above (green) or below (red) the moving average.
- Alerts for Buy & Sell Signals – Get real-time notifications when a trade signal is generated.
How to Use
- This indicator is best suited for trend-following strategies and works across different markets, including stocks, forex, and crypto.
- It can be used on multiple timeframes, but traders should combine it with additional analysis to refine trade decisions.
- ATR-based signal placement ensures that buy/sell labels do not clutter the chart.
Important Notes
- This indicator does not predict future price movements—it is a trend-based tool meant to assist with trade decisions.
- No financial advice – Always use risk management when trading.
- TradingView users who do not read Pine Script can still fully utilize this script thanks to clear labels and alerts.
Smart Scalper Indicator🎯 How the Smart Scalper Indicator Works
1. EMA (Exponential Moving Average)
EMA 10 (Blue Line):
Shows the short-term trend.
If the price is above this line, the trend is bullish; if below, bearish.
EMA 20 (Orange Line):
Displays the longer-term trend.
If EMA 10 is above EMA 20, it indicates a bullish trend (Buy signal).
2. SuperTrend
Green Line:
Represents support levels.
If the price is above the green line, the market is considered bullish.
Red Line:
Represents resistance levels.
If the price is below the red line, the market is considered bearish.
3. VWAP (Volume Weighted Average Price)
Purple Line:
Indicates the average price considering volume.
If the price is above the VWAP, the market is strong (Buy signal).
If the price is below the VWAP, the market is weak (Sell signal).
4. ATR (Average True Range)
Used to measure market volatility.
An increasing ATR indicates higher market activity, enhancing the reliability of signals.
ATR is not visually displayed but is factored into the signal conditions.
⚡ Entry Signals
Green Up Arrow (Buy):
EMA 10 is above EMA 20.
The price is above the SuperTrend green line.
The price is above the VWAP.
Volatility (ATR) is increasing.
Red Down Arrow (Sell):
EMA 10 is below EMA 20.
The price is below the SuperTrend red line.
The price is below the VWAP.
Volatility (ATR) is increasing.
🔔 Alerts
"Buy Alert" — Notifies when a Buy condition is met.
"Sell Alert" — Notifies when a Sell condition is met.
✅ How to Use the Indicator:
Add the indicator to your TradingView chart.
Enable alerts to stay updated on signal triggers.
Check the signal:
A green arrow suggests a potential Buy.
A red arrow suggests a potential Sell.
Set Stop-Loss:
Below the SuperTrend line or based on ATR levels.
Take Profit:
Target 1-2% for short-term trades.

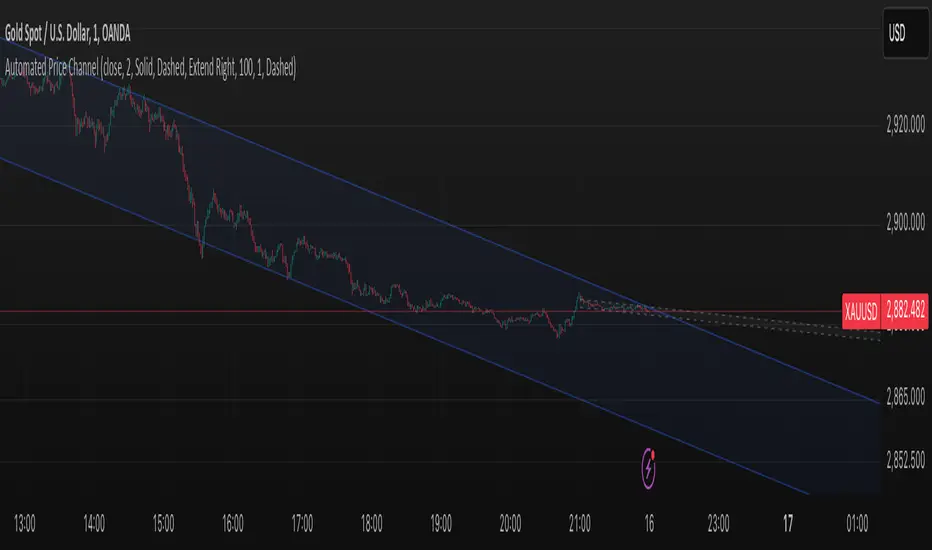
Smart ChannelThe "Smart Channel" indicator is designed to dynamically identify and plot price channels on a chart. It uses a statistical approach based on Pearson's correlation coefficient to determine the best-fit channel for both short-term and long-term trends. This allows traders to visualize potential support and resistance levels, identify trend direction, and potentially anticipate breakouts or reversals.
How it Works:
Data Input: The indicator takes a source input (typically the closing price) as the basis for its calculations.
Period Selection: It defines two sets of lookback periods: one for short-term analysis and one for long-term analysis. The code iterates through these periods, calculating a linear regression and standard deviation for each.
Pearson's Correlation: For each period, the indicator calculates Pearson's R, which measures the strength and direction of the linear relationship between price and time. A higher absolute value of Pearson's R indicates a stronger trend.
Best Fit Channel: The indicator identifies the period with the highest Pearson's R for both short-term and long-term and uses the corresponding linear regression parameters (slope and intercept) to define the midline of the channel.
Standard Deviation: The standard deviation of the price data around the regression line is calculated. This is used to define the upper and lower boundaries of the channel. The channel width is controlled by a "Deviation Multiplier" input.
Channel Plotting: The indicator plots the midline, upper boundary, and lower boundary of the channel on the chart. Separate channels are plotted for the short-term and long-term best-fit periods, using different colors for easy visual distinction.
Dynamic Updates: The channel is dynamically updated as new price data becomes available, adjusting to the evolving market trend.
Key Inputs and Settings:
Source: The price data used for calculations (e.g., close, open, high, low, etc.).
Use Long-Term Channel: A boolean input to enable/disable the calculation and plotting of the long-term channel.
Deviation Multiplier: Controls the width of the channel (how many standard deviations away from the midline the boundaries are).
Channel/Midline Colors and Transparency: Customizable colors and transparency levels for the channel lines and fill.
Line Styles: Options for solid, dotted, or dashed lines for the channel boundaries and midline.
Extend Style: How the channel lines should extend (right, both, none, left).
Interpretation and Usage:
Trend Identification: The direction of the midline indicates the prevailing trend. An upward-sloping midline suggests an uptrend, while a downward-sloping midline suggests a downtrend.
Support and Resistance: The upper and lower channel boundaries can act as potential support and resistance levels.
Breakouts: A price move outside of the channel boundaries may signal a potential breakout or reversal.
Overbought/Oversold: Prices touching or exceeding the upper boundary might suggest an overbought condition, while prices touching or exceeding the lower boundary might suggest an oversold condition.
Short-Term vs. Long-Term: Comparing the short-term and long-term channels can provide insights into the overall market context. For example, a short-term uptrend within a long-term downtrend might suggest a potential buying opportunity before the larger trend resumes.
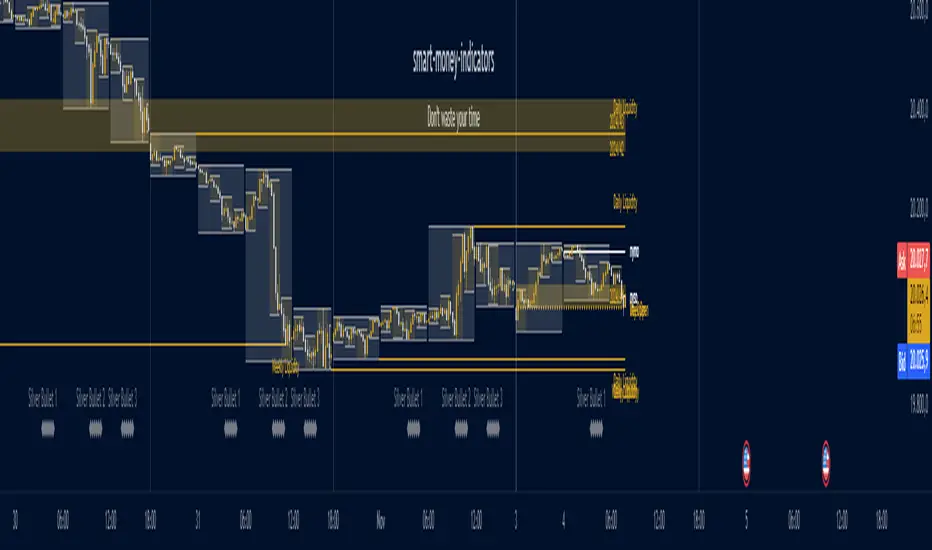
Ultimate ICT [smart-money-indicators]This indicator is a tool to support the "ICT" strategy.
This indicator does not provide entry or exit signals.
This indicator is a tool to mark key price areas.
This indicator is a tool to mark key time areas.
This indicator is particularly distinguished by its high customizability of tools,
setting it apart from the indicators currently available on the TradingView platform.
The following key areas are marked with the help of lines, boxes, background color, or plots:
Time Separators:
- Monthly separator
- Weekly separator
- Daily separator
Liquidity Zones:
- Daily highs/lows
- Weekly highs/lows
- Monthly highs/lows
- Asia Session (during or after the session)
- London Session (during or after the session)
- New York Session (during or after the session)
- London Close Session (during or after the session)
- Session Quarters
- Central Banks Dealer Range
Opening Prices/Average Prices:
- Weekly opening price
- New Week Open Gap
- Daily opening price
- Premium/Discount zone of the day (50% line)
- New York Midnight Open price
- New York Session Open price
Manipulation Times:
- 3 Silver Bullet times
- Macros
How can I use or interpret these areas?
Liquidity Zones:
The liquidity zones used here are time-based.
Liquidity zones can be used, depending on the reaction, either to confirm the continuation of the current trend
or as a signal for a reversal of the current trend.
Opening Prices/Average Prices:
These can be used as separators between the premium and discount zones.
If the price is below one of these values, you are in the discount zone and might look for buy signals.
If the price is above one of these values, you are in the premium zone and might look for sell signals.

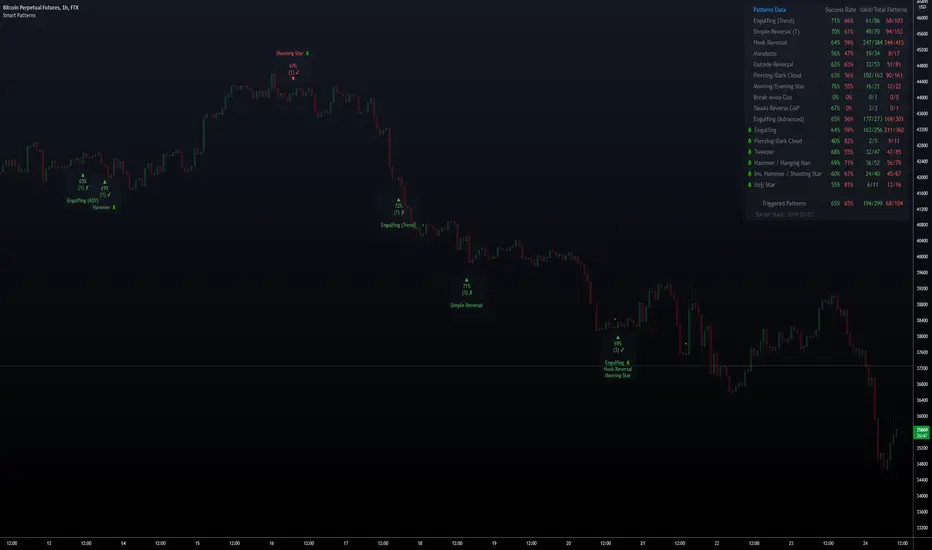
Smart PatternsHi Traders, and welcome to Smart Patterns.
Patterns can be very profitable, yet hard to trade, even when combined with other indicators and techniques. This script aims to increase the accuracy of signals by adding a statistical approach to candle patterns, along with tools to filter them.
For example, if the Success Rate is above a certain threshold, it means that the pattern has resulted in a higher ratio of profitable trades and hence it has a higher likelihood of succeeding in the current market conditions. However, should that pattern fall below the desired Success Rate, the script will "hide" it and won't trigger a signal, but still keeping track of its performance to start firing it again when coming back above the Success Rate.
Key Features
The script features custom patterns as well as some of TradingView's built-in patterns. Not all patterns can be added of course, but let me know if I missed other interesting ones and I will do my best to add them in future updates.
When a Pattern reaches the Min. Target % within the Candles Range selected, it is then considered valid. Please remember that doesn't take into account possible draw-downs or stop-losses.
Patterns are constantly evaluated inside the script; when a pattern's overall score (Success Rate %) is below the required minimum, the signal won't be triggered. However, the script will keep monitoring it in the background, and trigger a signal again when its score comes back above the minimum Success Rate.
The Patterns' signals can be filtered by Success Rate, Minimum Patterns detected and candle size (calculated via ATR).
The Data Panel will show individual statistics for Enabled Patterns as well as final statistics for Triggered Patterns.
Tooltips in the settings panel will further explain available options.
Alerts: simple alerts can be added by selecting "any alert() function call" when adding an Alert. Customizable alerts can also be created through dropdown menu ( Bullish \ Bearish Patterns Detected).
Fully customizable to adapt to light and dark themes
Notes and Recommendations
Always be realistic when tweaking settings, making sure the output makes sense in a normal trading environment. Statistics are helpful but shouldn't be the only factor to base your decisions on - even if a pattern reaches 100% Success Rate, it doesn't mean it will keep being profitable.
Since the script crunches quite some data it may give output errors especially if settings are not properly tweaked - or if the filters are too liberal (e.g. Min Target % set to 0.1) - hence triggering lots of signals. Please adjust the settings or enable only the Patterns you are trading.
If the script gives the error "Too many drawings, cannot clean oldest" it means your settings give too many signals and that is usually not a good sign - it's recommended to double-check your settings as mentioned above.
Credits
Trading View for built-in patterns
Special thanks go to PineCoders community for their incredible efforts and learning material to help mastering PineScript!
Smart Bottom SignalThis indicator is used to find temporary bottoms that are validated with a subsequent candle that closes above the high. The indicator is based on elliott wave theory and tries to signal entries on wave lows. It triggers off of code from " TD D-Wave" 0, 2, 4, A, and C bull wave lows by finding a candle with a close higher that the high of the lowest wave candle or the high of a bullish candle that first breaks above the 8EMA. Green arrows will plot on close indicating that the indicator was triggered.
There are 3 options for display of plots provided:
ShowSmartSigs - This is defaulted to true (display) and allows users to toggle the green arrow alert plots on/off that appear below the candle when triggered.
ShowOnOffPlots - This is logic I use to signal a downturn/upturn and is indicated by red/green arrows appearing above the trigger candle.
ShowBounceSigs - This is defaulted to false and would show as an orange arrow under a candle where a bullish candle first climbs above the 8EMA when ShowOnOffPlots is signaling a downturn and SlowtSochastics is below 21. The SlowStochastics settings are adjustable on the settings screen and default to 21,3.
Alerts Available:
"Smart Buy Bounce" - This alert fires when the ShowSmartSigs signal is triggered.
"Buy Bounce" - This alert fires when the ShowBounceSigs signal is triggered.
"Turn Off Bots"/"Turn On Bots" - This alert fires when the ShowOnOffPlots signals are triggered. I use this to turn off shorter timeframe (15m-1H) bots during a prolonged price drop.
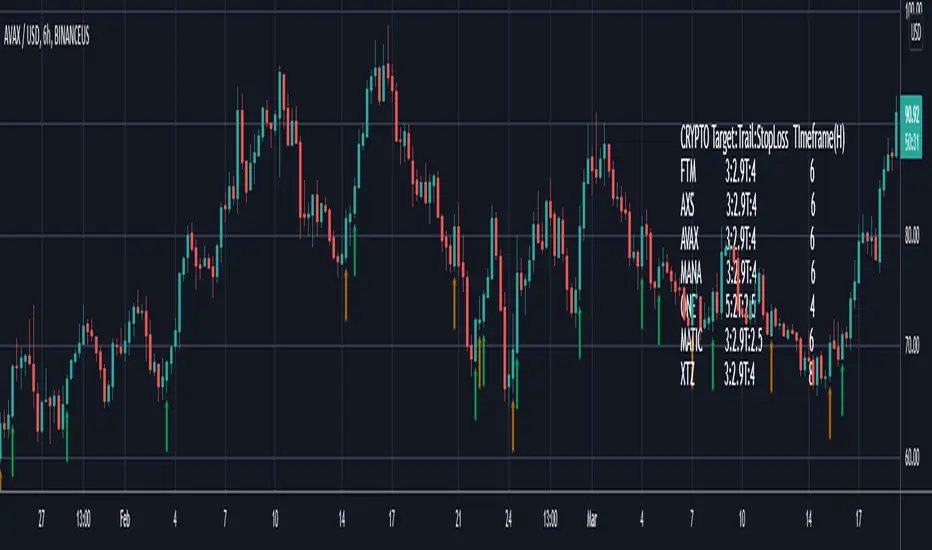
This is an early prototype that is filtered to the following tested cryptos against the specified chart timeframes and using the expressed target/trail/stoploss logic.
CRYPTO Target:Trail:StopLoss TImeframe(H)
FTM 3:2.9T:4 6
AXS 3:2.9T:4 6
AVAX 3:2.9T:4 6
MANA 3:2.9T:4 6
ONE 5:2T:2.5 4
MATIC 3:2.9T:2.5 6
XTZ 3:2.9T:4 8
Smart RebalanceThis script is based on the portfolio rebalancing strategy. It's designed to work with cryptocurrencies, but it can work with any market.
How portfolio rebalance works?
Let's assume your initial capital is $1000, and you want to distribute it into 4 coins. This script takes the USDT as the stable coin for the initial money, so in case you want other currency, the pairs must be with that fiat as the quote.
Following our example, you would take BTC, ETH, BNB, and FTT. After selecting the coins, it's time to choose how much allocation is on each. Let's put 25% on each. This way, $250 of our capital on each coin.
After selecting the coins and their allocation, you choose the price change ratio for rebalancing. Let's use 1%. Next, you start to watch the markets. The first thing that happens, following our example, is the BTCUSDT price moving 1% up.
That amount hit the ratio of 1% for the rebalance. Hence, you sell 1% of BTC for USDT and redistribute to the other coins, buying 0.25% of each currency to rebalance the portfolio.
Next, ETHUSDT goes 1% down, time to rebalance again. This time, you need to take 0.33% of each other coin and buy ETH, so this way, it's all divided as the chosen allocation.
Why use rebalancing?
Looks easy, right? It is, but very time demanding. Demands even more if you raise the number of coins you want to distribute. Having a system to do that automatically is a must to work efficiently. Rebalancing spreads the risk among multiple currencies. This way, you earn small when it goes up, but you lose small when it goes down.
What this script helps with portfolio rebalance?
This indicator will not buy/sell for you but will help you choose the best markets for your rebalancing. Which coin will work best in that period? Do I need to have more than 8 coins? How much must be my ratio? Those questions you can answer using this indicator.
What this script has?
Start and End dates
The script will work for a certain period. All calculations will be done in that period.
Coin Ratio %
The amount of price movement of each asset that will be used to calculate the rebalancing
Initial Capital and Broker Fee
The amount of capital to be used on the rebalancing and the broker fee you want to use the strategy. The cost will be applied on every trade, buying or selling the coins.
Assets, allocations, and colors
It's possible to select from 2 to 10 assets to be used on the portfolio. Each purchase must have the allocation %. Suppose the sum of the allocations is different from 100%. In that case, a warning message will appear on the chart instead of the statistics.
Panel and tooltips
There is a panel with a summary of the results
Set allocations automatically
There is an option to make the indicator use the daily asset volume from the day before to determine the allocation percentage of each asset. This option is better if you are unsure how much allocation you want to use on each coin.
Use this indicator as a backtest for your rebalancing strategy. The selected market on the chart will not affect the calculation on this indicator, but the time frame will. The higher the time frame, the higher the coin ratio % must be.
About the code
The code is written to use arrays to store the values of each asset, making the calculations on each candle inside the time range. The for-loops are used to reduce the code length and make it easy to change the analysis of all assets. Finally, the script has some comments on the code.

Smart Swing Strategy for StockSpecial indicator for stock but you can try another instrument.
Trend determination and buy/sell signals are using the Alligator system from Bill Williams .
To get maximum profit, the system uses the trailing stop technique using Average True Range (ATR) with 4 moving average options (RMA, SMA , EMA , WMA ).
Please leave comments if any opinions.
Disclaimer
The content is in any event provided with the intention of being for general circulation and availability only. As such it is not intended to and does not form part of any offer or recommendation directed at you specifically, or have any regard to your investment objectives, financial situation, or needs of yourself or any other specific person. Before committing to a trade or investment, please seek advice from financial or other professional advisers regarding the suitability of the trade for you. If you do not wish to seek such financial advice, please consider carefully whether the product is suitable for you as you alone remain responsible for your trading gains and losses.

Smart Entry BETAA Custom Unique indicator by NRTH_
Comes included with the Premium Package.
Indicator features
Built-In Alerts
Visual Risk Management
Customizable Entry Rules
Usage Tips
Smart Entry is currently a BETA algo. we are still in the process of tweaking and programming it only give entry signals when they are confirmed, and work of very strict parameters to allow for trading all the way down to the 5m timeframe. It is currently at a stage where it can produce profitable trades or even just act as a confirmation signal in use with another strategy, but this project will be ongoing until we can obtain high profitability levels on very low timeframes.
The algo uses both momentum and trend calculation to find an entry, highly recommended use with the built-in MA Filter for best results.
Works for all markets with the ability to customize to your liking.
Backtesting Results Info
Period 1/1/2021-1/10/2021
Entry value at $1000 with 10x leverage
Binance standard taker fee rate (0.04%)
ATR Exits : 1:2.9 RR
-------------------------------------------
Disclaimer
Copyright NRTH_ Indicators 2021.
NRTH_ and all affiliated parties are not registered as financial advisors. The products & services NRTH_ offers are for educational purposes only and should not be construed as financial advice. You must be aware of the risks and be willing to bear any level of risk to invest in financial markets. Past performance is not necessarily indicative of future results. NRTH_ and all individuals associated assume no responsibility for your trading results or investments.
All investments involve risk, and the past performance of a security, industry, sector, market, financial product, trading strategy, or individual’s trading does not guarantee future results or returns. Investors are fully responsible for any investment decisions they make. Such decisions should be based solely on an evaluation of their financial circumstances, investment objectives, risk tolerance, and liquidity needs.

Smart AlertsThis indicator provides back-tested signals and alerts from multiple technical indicators.
No more guessing whether or not you should trust an indicator. See your indicators' past performance at a glance.
No more false alarms. Disable re-painting of signals.
When multiple indicators overlap, a Confluence indicator will print (large triangle). With your settings properly tuned, this will show a HIGH probability of a move.
Current Signal/Alert Options (more to come):
RSI Oversold
RSI Overbought
EMA Crossing Up
EMA Crossing Down
Buy Signal Confluence
Sell Signal Confluence
Instructions:
-Enable/disable individual indicators so you can fine tune one at a time
-Adjust the indicator's settings
-Adjust your trade parameters (Max Wait, Take Profit %). Signals that would have given the desired profit in the time allowed will be painted orange.
-Repeat this process with each indicator until you're satisfied
-Set-up alerts

Smart EMA SignalsThis indicator starts by plotting each time the price action crosses above or below the EMA, of which you can tune the timeframe and duration.
It then takes it a step further and plots whether or not that indicator would have given you a profitable trade, of which you can also tune the parameters (Max wait time, and % Profit).
Once you have your EMA tuned to your liking, set up alerts to notify you of a golden opportunity.

Smart Labelling - Candlestick ChartingThis is a full-fledged implementation of a system presented in an unique research paper 'Profitability of Candlestick Charting Patterns in the Stock Exchange of Thailand' (2017) on candlestick charting, candlestick patterns, trend identification methods, and testing.
You can easily find this paper in the Web. For example, visit: www.researchgate.net
This script is best suited for middle-to-higher time frames. Possible future developments: trend identification and factor calculation techniques.
Donate: PayPal (paypal.me)

Smart Labelling - Range FilterThis is a labelling module based on a range filter . Notice that the trick here is to use fibonachi numbers . Use smaller range multiplier for higher TFs. This module may serve as a signal generator to be passed through a signal filter.
Quote from the original author:
This is an experimental study designed to filter out minor price action for a clearer view of trends. Inspired by the QQE's volatility filter, this filter applies the process directly to price rather than to a smoothed RSI. First, a smooth average price range is calculated for the basis of the filter and multiplied by a specified amount. Next, the filter is calculated by gating price movements that do not exceed the specified range. Lastly the target ranges are plotted to display the prices that will trigger filter movement.

Smart Target Introduction
This is the first forward-looking indicator on TradingView!
A normal moving average indicator will use two averages of differing lengths, referred to as “fast and slow” or “short and long” moving averages, to identify trends and potential trades.
The Smart Target indicator uses the average trade profitability and trade duration of a moving average strategy to determine a forward-looking target that is specific to the chart that it has been applied to.
Every historical trade is considered when the indicator determines the future price target of an asset and the accuracy will improve with time as new trade data is continually introduced.
Indicator Utility
If the fast-moving average crosses above the slow, a blue target will appear.
A red target will appear when the fast-moving average crosses below the slow.
The target will never change once it has been plotted and will not repaint in any way which means that it is fully functional for trading in real-time.
Input Values
The period length of the two moving averages will need to be determined by the user and can be changed in the indicator settings panel.
View the full documentation on this indicator at this link: www.kenzing.com

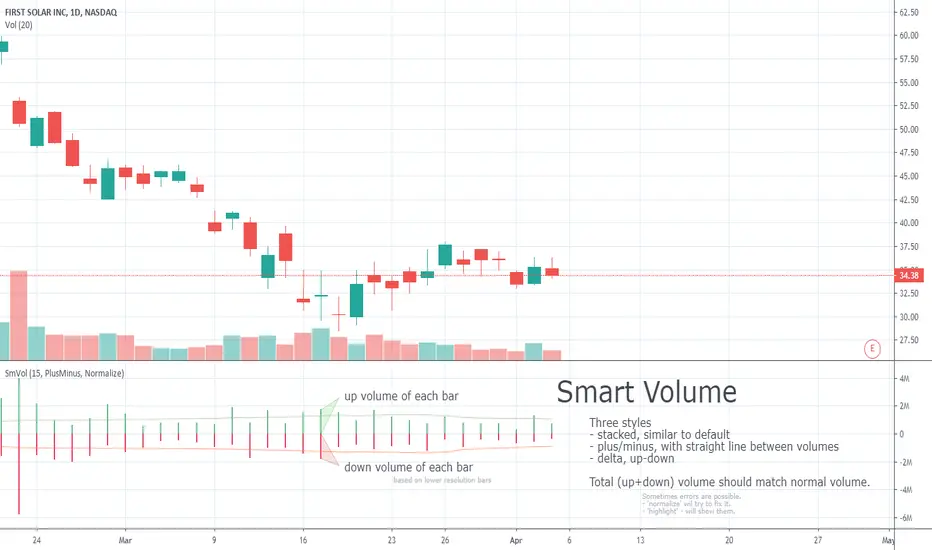
Smart VolumeOut of beta!
This script distinguishes up/down volume based on lower resolution.
It's important to set correct input "Detailed Resolution" — it affects detalization/loading speed. If equal to chart resolution, should match builtin "volume". The lower it is, the more detalized up/down border.
Smart Volume (beta)This script distinguishes up/down volume based on lower resolution.
It's important to set correct inputs. Second - affects detalisation/loading speed. Third one needs to be set according to your chart resolution. 1440 for 'D', 30 for '30'.
