New Age US ORB═════════════════════════════════════════════════════════════
NEW AGE US ORB
Opening Range Breakout Strategy with Neon Glow Effect
═════════════════════════════════════════════════════════════
🔒 INVITE-ONLY ACCESS
This script requires an invitation to use.
To request access, please send me a private message.
═════════════════════════════════════════════════════════════
🎯 OVERVIEW
The New Age US ORB is a clean, professional Opening Range Breakout (ORB) strategy with a futuristic visual style featuring dynamic neon glow effects.
Designed for Crypto (BTC/USD) and Indices (US100, US30, SPX) trading.
Best results on 5-minute or 15-minute chart with Regular Candles.
The strategy captures the first 15 minutes of US market activity (9:30-9:45 NY) and trades breakouts in the direction of the initial move.
💎 WHAT MAKES THIS UNIQUE
Unlike standard ORB indicators, this strategy combines:
• Proprietary 3-layer Neon Glow visualization for enhanced box visibility
• Integrated US Session backgrounds for market context
• Smart Session Filter to avoid low-probability late entries
• Separate Long/Short TP management for asymmetric markets
• Automatic EOD position closure for overnight risk control
• Daily trade limiter to prevent overtrading
• Global Timezone Support - works correctly for traders worldwide
This combination of visual design and risk management features is not available in standard ORB scripts.
Trade Smarter, not Harder.
📦 WHAT IS ORB?
The Opening Range Breakout (ORB) strategy is based on the concept that the first 15 minutes of the US market session often sets the tone for the rest of the day. The High and Low established during this period act as key support/resistance levels.
• Price breaks ABOVE ORB High → Bullish momentum (LONG)
• Price breaks BELOW ORB Low → Bearish momentum (SHORT)
⚡ KEY FEATURES
📦 ORB BOX VISUALIZATION
• Automatically captures High/Low of 9:30-9:45 NY candle
• Dynamic color change:
→ Cyan: Price ABOVE ORB High (Bullish)
→ Red: Price BELOW ORB Low (Bearish)
• Extends throughout the trading session
✨ NEON GLOW EFFECT
• 3-layer glow effect around the ORB box
• Layered borders (8px → 5px → 3px) with gradient transparency
• Creates futuristic, high-visibility appearance
• Toggle on/off in settings
🕐 US SESSION BACKGROUNDS
• US Open (9:30-11:30 NY) - Blue
• Lunch Break (11:30-13:30 NY) - Orange
• Afternoon (13:30-16:00 NY) - Green
• Visual reference only - helps identify optimal trading windows
⏱️ SESSION FILTER
• Configurable trading window (default: until 11:50 NY)
• Prevents late entries when momentum fades
• EOD auto-close in YOUR selected timezone (default: 21:45)
🎚️ RISK MANAGEMENT
• ORB Box Stop Loss: SL at opposite ORB level + buffer
• Separate Take Profit settings for Long/Short
• Points or Percentage mode
• Daily trade limit (default: 6 trades max)
📊 INFO DASHBOARD
• Real-time status panel (top right)
• Shows: Timezone, Status, Session, Direction, Trades, SL/TP, EOD, ORB levels
⚙️ SETTINGS
TIMEZONE
└── Your Timezone: Select from 12 global timezones (Default: Europe/Zurich)
Available: UTC, New York, Chicago, Los Angeles, London, Berlin,
Zurich, Paris, Tokyo, Hong Kong, Singapore, Sydney
ORB BOX (9:30-9:45 NY)
├── Show ORB Box: true/false
└── Neon Glow Effect: true/false
US SESSION BACKGROUNDS
├── Show Session Background: true/false
├── US Open Color (9:30-11:30)
├── Lunch Color (11:30-13:30)
└── Afternoon Color (13:30-16:00)
SESSION FILTER
├── Enable Session Filter: true/false
├── Session End Hour (NY): 0-23
└── Session End Minute (NY): 0-59
DAILY CLOSE (Your Timezone)
├── Enable Daily Close: true/false
├── EOD Hour: 0-23
└── EOD Minute: 0-59
TRADE LIMITS
├── Enable Daily Limit: true/false
└── Max Trades per Day: 1-10
STOP LOSS
├── Enable ORB Box SL: true/false
└── SL Buffer: Points distance from ORB level
TAKE PROFIT - LONG
├── Enable TP Long: true/false
├── Mode: Points / Percent
├── TP Long Points: Distance in points
└── TP Long Percent: Distance in %
TAKE PROFIT - SHORT
├── Enable TP Short: true/false
├── Mode: Points / Percent
├── TP Short Points: Distance in points
└── TP Short Percent: Distance in %
COLORS
├── Bullish: Default #00ffbb (Cyan)
└── Bearish: Default #ff1100 (Red)
📈 HOW TO USE
1. Apply to BTC/USD or US100 on 5min or 15min timeframe
2. Use Regular Candles for realistic results
3. Go to Strategy Properties → Enable ☑️ "Recalculate On Bar Close"
4. Select your Timezone in settings (for correct EOD close time)
5. Wait for ORB box to complete (9:45 NY)
6. Strategy enters automatically on breakout:
→ LONG when price closes above ORB High
→ SHORT when price closes below ORB Low
7. Manage risk with ORB Box SL and TP settings
8. All positions close at EOD time (in your timezone)
🔔 ALERTS
• LONG Entry - Breakout above ORB High
• SHORT Entry - Breakout below ORB Low
• EOD Close - End of day position close
💡 BEST PRACTICES
• Most effective during US Open session (9:30-11:30 NY)
• Avoid Lunch session (11:30-13:30) - lower volatility
• ORB levels act as support/resistance all day
• Wider TP for trending days, tighter for ranging markets
• Use session filter to avoid late, low-probability entries
═════════════════════════════════════════════════════════════
© AL_R4D1 - New Age Style Trading Tools
═════════════════════════════════════════════════════════════
Search in scripts for "spx"

Smart Money Alpha Signals (Performance Dashboard) Smart Money Alpha Signals: Identifying Market Leaders & Generating Alpha
GMP Alpha Signals (Global Market Performance Alpha) is a specialized analysis tool designed not merely to find stocks that are rising, but to identify "Alpha" assets—Market Leaders that defend their price or rise even under adverse conditions where the market index falls or consolidates.
This indicator visualizes the concept of Comparative Relative Strength (RS) and Smart Money accumulation patterns, helping traders capture profit opportunities even during bearish market phases.
Key Objectives (Purpose)
Alpha Capture: Identifying assets generating 'excess returns' that outperform the market Beta.
Smart Money Tracking: Detecting traces of 'institutional buying' and 'accumulation' that defend prices during index plunges.
Decoupling Identification: Spotting assets moving on independent catalysts or momentum, regardless of the broader market direction.
Stop Hunt Filtering: Distinguishing 'fake drops' where price dips temporarily, but Relative Strength remains intact.
Dashboard Guide
Interpretation of the information panel (Table) displayed on the chart.
Rel. Performance: Shows the excess return compared to the index over the set period. (Positive/Green = Stronger than the market).
Decoupling Strength: The correlation coefficient with the index. Lower values (0 or negative) indicate movement independent of market risk.
Bullish: The count/rate of rising or limiting losses when the index drops sharply (e.g., < -0.5%). (Gold = Market Crash Leader).
Defended: The count/rate of holding support levels when the index shows mild weakness (e.g., < -0.05%). (Gold = Strong Accumulation).
Bench. Defense: The defense rate of the comparison benchmark (e.g., TSLA, ETH). Your target asset must be higher to be considered the sector leader.
Input Options & Settings Guide
You can optimize settings according to your trading style and asset class (Stocks/Crypto).
(1) Main Settings
Major Index: The baseline market index for comparison.
(US Stocks: NASDAQ:NDX or TVC:SPX / Crypto: BINANCE:BTCUSDT)
Benchmark Symbol: A competitor within the sector.
(e.g., Set NVDA when analyzing Semiconductor stocks).
Correlation Lookback: The lookback period for judging decoupling. (Default: 30)
Performance Lookback: The number of bars to calculate cumulative returns and defense rates. (Default: 60)
(2) Dashboard Thresholds
These settings define the criteria for what qualifies as "Defended" or "Bullish".
Performance (Max %): Used to find assets that haven't pumped yet. Signals trigger only when Alpha is below this value.
Defended Logic:
Index Drop Condition: The index must drop by at least this amount to start checking. (e.g., -0.05%)
Asset Buffer: How much the asset must outperform the index drop.
(Example: If Index drops -1.0% and Buffer is 0.2%, the asset must be at least -0.8% to count as 'Defended').
Bullish Logic: Measures resilience during steeper market dumps (e.g., -0.5% drop) compared to the Defended Logic.
Volume Settings: Decides whether to count Defended/Bullish instances only when accompanied by volume above the SMA.
(3) Signal Logic Settings (Crucial)
Customize conditions to trigger alerts. The choice between AND / OR is crucial.
AND: Condition must be met SIMULTANEOUSLY with other active conditions (Conservative/High Certainty).
OR: Condition triggers the signal INDEPENDENTLY (Aggressive/Opportunity Capture).
Performance: Is the relative performance within the threshold? (Basic Filter).
Decoupling: Has the correlation dropped? (Start of independent move).
Bullish Rate: Is the Bullish rate high during market dumps?
Defended Rate (High): (Recommended) Is there continuous price defense occurring? (Accumulation detection).
Defended Rate (Low): (Warning) Has the defense rate broken down? (For Stop Loss).
Defended > Benchmark: Is it stronger than the Benchmark (2nd tier)?
Volume Spike: Has volume surged compared to the average? (Institutional involvement).
RSI Oversold: Is it in oversold territory? (Counter-trend trading).
Decoupling Move: Does the current bar show the "Index Down / Asset Up" pattern?
Min USD Volume: Transaction value filter (To exclude low liquidity assets).

RSI Median DeviationRSI Median Deviation – Adaptive Statistical RSI for High-Probability Extremes
The Relative Strength Index (RSI) is a momentum oscillator developed by J. Welles Wilder in 1978 to measure the magnitude of recent price changes and identify potential overbought or oversold conditions. It calculates the ratio of upward to downward price movements over a specified period, scaled to 0-100. However, standard RSI often relies on fixed thresholds like 70/30, which can produce unreliable signals in varying market regimes due to their lack of adaptability to the actual distribution of RSI values.
This indicator was developed because I needed a reliable tool for spotting intermediate high-probability bottoms and tops. Instead of arbitrary horizontal lines, it uses the RSI’s own historical median as a dynamic centerline and measures how far the current RSI deviates from that median over a chosen lookback period. The main signals are triggered only at 2 standard deviation (2σ) extremes — statistically rare events that occur roughly 5 % of the time under a normal distribution. I selected 2σ because it is extreme enough to be meaningful yet frequent enough for practical trading. For oversold signals I further require RSI to be below 42, a filter that significantly improved results in my mean-reversion tests (enter on oversold, exit on the first bar the condition is no longer true).
The combination of percentile median + standard deviation bands is deliberate: the median is far more robust to outliers than a simple average, while the SD bands automatically adjust to the current volatility of the RSI itself, producing adaptive envelopes that work equally well in ranging and trending markets.
Underlying Concepts and Calculations
Base RSI: RSI = 100 − (100 / (1 + RS)), RS = average gain / average loss (default length 10).
Percentile Median: 50th percentile of the last "N" RSI values (default 28 = 4 weeks)
→ dynamic, outlier-resistant centerline.
Standard Deviation Bands: rolling stdev of RSI (default length 27 = = 4 weeks (almost))
→ bands = median ± 1σ / 2σ.
Optional Dynamic MA Envelopes: user-selectable moving average (TEMA, WMA, etc., default WMA length 37) for additional momentum context.
Trend Bias Coloring
Independent of the statistical extremes, the RSI line itself is colored green when above the user-defined Long Threshold (default 60) and red when below the Short Threshold (default 47). This provides an instant bullish/bearish bias overlay similar to classic RSI usage, without interfering with the main 2σ extreme signals.
Extremes are highlighted with background color (green for oversold 2σ + RSI<42, magenta for overbought 2σ) and small diamond markers for ultra-extremes (RSI <25 or >85).
Originality and Development Rationale
The indicator was built and refined through extensive testing on dozens of assets including major cryptocurrencies:
(BTC, ETH, SOL, SUI, BNB, XRP, TRX, DOGE, LINK, PAXG, CVX, HYPE, VIRTUAL and many more),
the Magnificent 7 stocks,, QQQ, SPX, and gold.
Default parameters were chosen to deliver consistent profitability in simple mean-reversion setups while maximizing Sortino ratio and minimizing maximum drawdown across this broad universe — ensuring the settings are robust and not overfitted to any single instrument or timeframe.
How to Use It
Ideal for swing / position trading on the 1h to daily charts (the same defaults work).
Oversold (high-probability long): RSI crosses below lower 2σ band AND RSI < 42
→ green background
→ enter long, exit the first bar the condition disappears.
Overbought (high-probability short): RSI crosses above upper 2σ band
→ magenta background
→ enter short, exit on opposite signal or at median. (Shorts were not tested, it's only an idea)
Use the green/red RSI line coloring for quick trend context and to avoid fighting strong momentum.
Always confirm with price action and manage risk appropriately.
This indicator is not a standalone trading system.
Disclaimer: This is not financial advice. Backtests are based on past results and are not indicative of future performance.

Pivots + MAs ISRSPivots + MAs ISRS is a complete market-structure tool designed for traders who want clear institutional levels combined with trend confirmation from moving averages and Fibonacci zones.
This indicator helps you identify breakouts, pullbacks, and reversal points with much higher accuracy.
It combines the best of three worlds:
🔹 1. Advanced Pivot Points (Standard TV Engine)
Includes every major professional pivot type:
Traditional
Fibonacci
Woodie
Classic
DM
Camarilla
You can choose pivot anchors such as:
Daily, Weekly, Monthly, Quarterly, Yearly, and extended periods (2, 3, 5, and 10 years).
✔ Fully customizable colors
✔ Show/hide each level individually
✔ Dynamic labels (left or right)
✔ Works with intraday + extended sessions
🔹 2. Built-in Moving Averages
The indicator includes:
3 EMAs to measure trend direction and momentum
A 5-period SMA for micro-structure and scalping precision
Great for identifying confluences between trend direction + pivot levels.
🔹 3. FiboISRS Zones
Fibonacci-based zones designed to enhance price-reaction detection:
Retracement levels
Liquidity zones
Confluences with EMAs + Pivot Points
Perfect for spotting high-probability reversal areas.
🎯 What This Indicator Helps You Do
✔ See active institutional levels on any timeframe
✔ Detect real breakouts (not fakeouts) using Pivots + MAs
✔ Identify clean pullbacks into key zones
✔ Spot reactions at S1/S2/S3 or R1/R2/R3
✔ Keep your chart clean with minimal noise
Works extremely well on:
Crypto with solid liquidity
Major indices (SPX, NASDAQ, Dow)
Forex
Gold and commodities
🧠 Pro Tip
The highest-probability setups occur when price touches:
👉 A Pivot Level
👉 An EMA (20, 50, or 200)
👉 A FiboISRS zone
When these three overlap, the market often reacts strongly.
⚡ Creator
Indicator created by Ismael Robles (ISRS) to bring a clean, institutional-grade structure to everyday traders.

IV vs Realised Volatility (VIX/HV Comparator)VIX / HV Comparator – Implied vs Realised Volatility
This indicator compares Implied Volatility (IV) from a volatility index (VIX, India VIX, etc.) with the Realised / Historical Volatility (HV) of the current chart symbol.
It helps you see whether options are pricing volatility as rich or cheap relative to what the underlying is actually doing.
What it does
Pulls IV from any user-selected vol index symbol (e.g. CBOE:VIX for SPX, NSEINDIA:INDIAVIX for Nifty).
Calculates realised volatility from the chart’s price data using returns over a user-defined lookback.
Annualises HV so IV and HV are displayed on the same percentage scale, on any timeframe (intraday or higher).
Optionally shows an IV/HV ratio in a separate pane to highlight when options are rich or cheap relative to realised volatility.
How to read it
Main panel:
Orange line – Implied Volatility (IV) from your chosen vol index.
Aqua line – Realised / Historical Volatility (HV) of the current chart symbol.
Fill between lines:
Green shading -> IV > HV -> options are priced richer than what the underlying is currently realising.
Red shading -> HV > IV -> realised vol is higher than the options market is implying.
Sub-panel (optional):
IV / HV ratio
- Above 1 -> IV > HV (vol rich).
- Below 1 -> IV < HV (vol cheap).
- Horizontal guides (for example 1.2 / 0.8) help frame “significantly rich/cheap” zones.
A small label on the latest bar displays the current IV, HV and their difference in vol points.
Inputs (key ones)
IV Index Symbol – choose the volatility index that corresponds to your underlying (VIX, India VIX, etc.).
Realised Vol Lookback – number of bars used to compute HV (for example 20).
Trading Days per Year and Active Hours per Day – used for annualising HV so it stays consistent across timeframes.
IV Scale Factor – adjust if your IV index is quoted in decimals (0.15) instead of points (15).
Practical uses
Context for options trades – Quickly see if current IV is high or low relative to realised volatility when deciding on strategies (premium selling vs buying, spreads, hedges).
Vol regime analysis – Track shifts where HV starts to rise above IV (real stress building) or IV spikes far above HV (fear premium / insurance bid).
Cross-timeframe checks – Use on intraday charts for short-term trading context, or on daily/weekly charts for bigger picture vol regimes.
This tool is not a stand-alone signal generator. It is meant to be a volatility dashboard you combine with your usual price action, trend, and options strategy rules to understand how the options market is pricing risk vs what the underlying is actually delivering.

NHNL Breadth Scanner [BIG]═══════════════════════════════════════════════════════════════════════════════
NVENTURES NHNL BREADTH SYSTEM v2.0
═══════════════════════════════════════════════════════════════════════════════
OVERVIEW
The NVentures NHNL Breadth System is an institutional-grade market breadth analysis framework designed for equity traders, portfolio managers, and market technicians who require comprehensive internal market structure visibility beyond price action alone. This system integrates New Highs - New Lows (NHNL) data across multiple exchanges with participation breadth metrics to identify market regime shifts, thrust conditions, divergences, and rotation dynamics between large-cap and small-cap equities.
Version 2.0 introduces the Participation Breadth Module , which monitors the percentage of stocks above their 50-day moving averages across S&P 500, Russell 2000, and NASDAQ 100 indices. This extension enables detection of Risk-On/Risk-Off rotations and narrow rally conditions—critical information for portfolio construction, sector allocation, and tactical hedging decisions.
The framework combines:
- Multi-exchange NHNL aggregation – NYSE, NASDAQ, AMEX breadth data integration
- McClellan Oscillator – Exponential moving average difference for trend momentum
- Thrust detection – Extreme breadth expansion/contraction identification
- Divergence analysis – Price vs. breadth non-confirmation patterns
- Participation breadth – Large-cap vs. small-cap rotation detection
- Composite signal scoring – Multi-factor quantitative breadth assessment
═══════════════════════════════════════════════════════════════════════════════
CORE METHODOLOGY
═══════════════════════════════════════════════════════════════════════════════
• NHNL Data Aggregation
The system retrieves daily New Highs and New Lows from three major U.S. exchanges:
- NYSE – INDEX:HIGN (New Highs), INDEX:LOWN (New Lows)
- NASDAQ – INDEX:HIGQ (New Highs), INDEX:LOWQ (New Lows)
- AMEX – INDEX:HIGA (New Highs), INDEX:LOWA (New Lows)
Users can toggle exchanges on/off to isolate specific market segments. All three exchanges are enabled by default for comprehensive market-wide breadth measurement.
Core Calculations :
- NHNL Raw = Total New Highs - Total New Lows
- NHNL % = (NHNL Raw / Total Issues) × 100
- NH/NL Ratio = New Highs / New Lows
These metrics quantify the internal strength or weakness of market advances/declines independent of price index levels.
• McClellan Oscillator
The McClellan Oscillator applies exponential moving average (EMA) logic to NHNL data:
Formula: McClellan Osc = EMA(NHNL, Fast) - EMA(NHNL, Slow)
Default parameters: Fast = 19, Slow = 39
Interpretation :
- Positive values = Breadth momentum favors bulls (more issues making new highs)
- Negative values = Breadth momentum favors bears (more issues making new lows)
- Zero-line crosses = Regime change signals (bullish above, bearish below)
- Extreme readings (>±100) = Overbought/oversold breadth conditions
The McClellan Oscillator is a standard institutional breadth tool used by market technicians since the 1960s. It smooths daily NHNL volatility while maintaining responsiveness to trend changes.
• Thrust Detection
Thrust conditions identify extreme breadth expansion or contraction that historically precedes sustained directional moves:
Bullish Thrust :
- NHNL % > Threshold (default +40%)
- Sustained for Confirmation Bars (default 2 bars)
- Context : Extreme positive breadth expansion. Historically associated with major rally initiations or continuation thrusts.
Bearish Thrust :
- NHNL % < -Threshold (default -40%)
- Sustained for Confirmation Bars (default 2 bars)
- Context : Extreme negative breadth contraction. Historically associated with panic selling, capitulation events, or major downtrend acceleration.
Thrust conditions are the highest-priority signals in the framework and override other conflicting indicators.
• Divergence Detection
The system identifies non-confirmation patterns between price action and breadth:
Bullish Divergence :
- Price makes lower low
- NHNL % makes higher low
- Context : Selling pressure exhausting despite lower prices. Potential reversal signal as fewer stocks participate in decline.
Bearish Divergence :
- Price makes higher high
- NHNL % makes lower high
- Context : Rally losing internal momentum despite higher prices. Potential reversal signal as fewer stocks participate in advance.
Divergences use pivot detection with configurable lookback periods (default 50 bars) and pivot strength (default 5 bars). Visual divergence lines are drawn directly on the price chart when detected.
• Participation Breadth Module (NEW in v2.0)
This module monitors the percentage of stocks trading above their 50-day moving average across three major indices:
- S&P 500 – INDEX:S5FI (Large-cap participation)
- Russell 2000 – INDEX:R2FI (Small-cap participation)
- NASDAQ 100 – INDEX:NDFI (Tech-cap participation)
Rotation Spread Calculation :
Rotation Spread = Russell 2000 % Above 50D - S&P 500 % Above 50D
Interpretation :
- Positive Spread (>+10%) = Risk-On Rotation
Small caps outperforming large caps. Broad market participation. Risk appetite expanding.
- Negative Spread (<-10%) = Risk-Off Rotation
Large caps outperforming small caps. Narrow rally / defensive positioning. Flight to quality or concentration risk.
- Neutral (-10% to +10%) = Balanced market, no clear rotation
This spread identifies critical regime changes between broad market participation (healthy) and narrow leadership (fragile). Risk-On rotations typically occur during economic expansion phases; Risk-Off rotations occur during uncertainty, recession fears, or late-cycle conditions.
• Composite Signal Score
The framework generates a quantitative breadth score (-100 to +100) by weighting five components:
1. Thrust Score (±40 points) – Active thrust condition
2. Trend Score (±30 points) – McClellan Oscillator above/below zero
3. Momentum Score (±20 points) – NHNL % magnitude
4. Ratio Score (±10 points) – NH/NL Ratio extremes
5. Participation Score (±15 points) – Risk-On/Risk-Off regime + participation health
The composite score is smoothed (EMA 5) and classified into five breadth states:
- +50 to +100 = Strong Bull
- +20 to +50 = Bullish
- -20 to +20 = Neutral
- -50 to -20 = Bearish
- -100 to -50 = Strong Bear
═══════════════════════════════════════════════════════════════════════════════
SIGNAL HIERARCHY & PRIORITY
═══════════════════════════════════════════════════════════════════════════════
The indicator generates multiple signal types with distinct priority levels:
Priority 1: Thrust Signals (Highest conviction)
- Green triangle below bar = Bullish Thrust (40%+ breadth expansion)
- Red triangle above bar = Bearish Thrust (40%+ breadth contraction)
- Chart background highlighted in green/red during active thrust
Priority 2: Rotation Signals (Regime identification)
- Cyan diamond below bar = Risk-On Rotation (small caps outperforming)
- Orange diamond above bar = Risk-Off Rotation (large caps outperforming)
- Chart background highlighted in cyan/orange during active rotation
Priority 3: Divergence Signals (Reversal warnings)
- Green label below bar = Bullish Divergence (price/breadth non-confirmation)
- Red label above bar = Bearish Divergence (price/breadth non-confirmation)
- Dashed lines connect divergence pivot points on price chart
Priority 4: Zero-Line Cross (Trend changes)
- Small circle below bar = McClellan crossing above zero (breadth turning positive)
- Small circle above bar = McClellan crossing below zero (breadth turning negative)
═══════════════════════════════════════════════════════════════════════════════
VISUAL COMPONENTS
═══════════════════════════════════════════════════════════════════════════════
• Comprehensive Information Panel
The top-right dashboard (position customizable) displays:
Section 1: Raw NHNL Data
- Total New Highs (green)
- Total New Lows (red)
- Exchange breakdown (NYSE, NASDAQ, AMEX) with individual deltas
Section 2: Core Metrics
- NHNL % with visual indicator (🔥 for thrusts, arrows for direction)
- NH/NL Ratio with strength bars
- McClellan Oscillator with directional arrows
Section 3: Participation Breadth (NEW)
- S&P 500 % above 50D MA with trend arrow
- Russell 2000 % above 50D MA with trend arrow
- NASDAQ 100 % above 50D MA with trend arrow
- Rotation Spread with regime icon (🚀 Risk-On, 🛡️ Risk-Off)
Section 4: Composite Assessment
- Signal Score (-100 to +100) with visual strength bars
- Market Status (large text): BULLISH THRUST, BEARISH THRUST, RISK-ON ROTATION, RISK-OFF ROTATION, or breadth state classification
• Chart Overlays
- Background color-coding for active regimes (thrust, rotation, extreme readings)
- Signal markers (triangles, diamonds, circles, labels) at key inflection points
- Divergence lines connecting pivot highs/lows on price chart
═══════════════════════════════════════════════════════════════════════════════
KEY FEATURES
═══════════════════════════════════════════════════════════════════════════════
- Multi-exchange breadth aggregation – NYSE, NASDAQ, AMEX with individual on/off toggles
- Institutional McClellan Oscillator – Standard market breadth momentum tool
- Automated thrust detection – Identifies extreme breadth conditions with confirmation logic
- Price-breadth divergence scanning – Non-confirmation pattern detection with visual lines
- Participation breadth integration – Risk-On/Risk-Off rotation detection via large-cap vs. small-cap analysis
- Composite signal scoring – Quantitative multi-factor breadth assessment
- No repainting – All signals confirm on bar close
- Comprehensive alerting – 12+ alert conditions for thrust, divergence, rotation, and confluence events
- Fully customizable parameters – EMA periods, thresholds, lookbacks, visual settings
- Professional dashboard – Real-time metrics with color-coded status indicators
═══════════════════════════════════════════════════════════════════════════════
HOW TO USE
═══════════════════════════════════════════════════════════════════════════════
1. Apply to any chart – The indicator pulls multi-security data; chart symbol does not matter (commonly applied to SPY, SPX, or QQQ for reference)
2. Monitor the dashboard :
• Focus on Market Status (bottom row) for current regime
• Check NHNL % and McClellan for breadth direction and momentum
• Watch Rotation Spread for large-cap vs. small-cap dynamics
• Review Signal Score for composite breadth strength
3. Interpret thrust signals (highest priority):
• Bullish Thrust → Major rally initiation or continuation likely. Consider adding long exposure or reducing hedges.
• Bearish Thrust → Major decline or capitulation event likely. Consider reducing exposure or adding hedges.
• Historical context: Thrust signals are rare (2-5 per year) but highly reliable for significant market moves.
4. Interpret rotation signals (regime identification):
• Risk-On Rotation → Broad market participation. Small caps outperforming. Healthy advance. Favor cyclical sectors, higher beta names.
• Risk-Off Rotation → Narrow rally or defensive positioning. Large caps outperforming. Caution—market leadership concentrating. Favor quality, defensives.
5. Interpret divergence signals (reversal warnings):
• Bullish Divergence → Selling exhaustion. Potential bottom formation. Wait for confirmation (zero-line cross, thrust) before aggressive positioning.
• Bearish Divergence → Rally losing momentum. Potential top formation. Consider profit-taking or hedging.
6. Combine signals for maximum conviction :
• Bull Confluence : Bullish Thrust + Risk-On Rotation + Positive McClellan = Maximum bullish alignment
• Bear Confluence : Bearish Thrust + Risk-Off Rotation + Negative McClellan = Maximum bearish alignment
• Alert system specifically flags these high-conviction confluences
7. Configure parameters for your style :
• Thrust Threshold : Default 40% catches major moves. Increase to 50%+ for extreme-only signals.
• Rotation Threshold : Default 10% spread. Tighten to 7.5% for earlier rotation detection.
• Divergence Lookback : Default 50 bars. Extend to 100+ for longer-term divergences.
8. Use alerts for proactive monitoring :
• Set TradingView alerts for Thrust, Rotation, Divergence, and Confluence conditions
• Receive notifications when critical breadth regime changes occur
═══════════════════════════════════════════════════════════════════════════════
LIMITATIONS
═══════════════════════════════════════════════════════════════════════════════
- U.S. equity markets only – NHNL data limited to NYSE, NASDAQ, AMEX. Does not cover international markets or other asset classes.
- Daily timeframe only – NHNL data is reported daily. Intraday trading requires alternative breadth measures.
- Lagging in fast reversals – McClellan Oscillator and participation metrics use EMAs, introducing lag during rapid regime shifts. Thrust signals respond faster but require extreme conditions.
- Equal-weighting assumption – All stocks within NHNL counts are equally weighted. Large-cap-dominated rallies (e.g., FANG-led advances) may show strong price performance despite mediocre breadth.
- False positives in sideways markets – Divergence signals can produce false positives during extended consolidation phases. Require confirmation from thrust or rotation signals.
- Participation data quality – S5FI, R2FI, NDFI data from TradingView may have occasional gaps or delays. Indicator includes data validation logic and falls back gracefully when data unavailable.
═══════════════════════════════════════════════════════════════════════════════
TECHNICAL SPECIFICATIONS
═══════════════════════════════════════════════════════════════════════════════
- Pine Script v5
- Non-repainting (signals confirmed on bar close)
- Multi-security data feeds (6 NHNL tickers + 3 participation tickers)
- Maximum 500 lines supported (divergence line drawing)
- Real-time dashboard table with 20+ rows
- 12+ alert conditions (thrust, divergence, rotation, ratio extremes, confluence)
- Fully customizable colors, thresholds, and visual elements
═══════════════════════════════════════════════════════════════════════════════
NOTES
═══════════════════════════════════════════════════════════════════════════════
This indicator is designed for experienced equity traders, portfolio managers, and market technicians familiar with:
- Market breadth analysis and internal market structure
- McClellan Oscillator interpretation
- New High - New Low dynamics and their correlation with market cycles
- Large-cap vs. small-cap rotation patterns
- Risk-On/Risk-Off regime identification
The framework provides objective breadth signals but does not account for:
- Fundamental catalysts (earnings, economic data, Fed policy)
- Sector-specific dynamics (may show broad weakness while certain sectors thrive)
- International market correlations
- Volatility regime changes (VIX dynamics)
Best used in combination with:
- Price action analysis (support/resistance, chart patterns)
- Volume analysis (accumulation/distribution)
- Volatility indicators (VIX, put/call ratios)
- Sentiment indicators (survey data, positioning)
Market breadth is a leading indicator of internal market health. Divergences between price and breadth often precede major reversals by weeks or months.
═══════════════════════════════════════════════════════════════════════════════
Developed for institutional market breadth analysis based on New Highs - New Lows methodology with extended participation breadth integration.

BIG Options Strategy Regime Scanner═══════════════════════════════════════════════════════════════════════════════
BIG OPTIONS STRATEGY REGIME SCANNER
═══════════════════════════════════════════════════════════════════════════════
OVERVIEW
The BIG Options Strategy Regime Scanner is a quantitative regime detection framework designed to identify optimal entry conditions for directional and convexity-based options strategies. This indicator analyzes market structure (trend), volatility environment (VIX), and momentum (RSI) to classify markets into distinct trading regimes and signal appropriate options deployment strategies.
The indicator was developed specifically for systematic options traders who require objective, rule-based regime identification rather than discretionary interpretation. It integrates institutional volatility metrics with technical momentum filters to produce high-probability entry signals for three core strategies: Call Tail Convexity , Put Tail Convexity , and Bull Put Income .
═══════════════════════════════════════════════════════════════════════════════
CORE METHODOLOGY
═══════════════════════════════════════════════════════════════════════════════
• Regime Detection Logic
The indicator operates on a three-factor regime classification system:
1. Trend Filter – Identifies directional bias using SMA 200 as the primary trend delimiter. Position relative to this level determines bull/bear regime classification.
2. Volatility Environment – Uses VIX (CBOE Volatility Index) thresholds to categorize market conditions:
• Low Vol: VIX < 17 (favors premium buying / convexity strategies)
• Mid Vol: VIX 17-22 (transition zone, tactical income strategies)
• High Vol: VIX ≥ 22 (risk-off, defensive positioning)
3. Momentum Confirmation – RSI(14) provides tactical entry timing to avoid premature signals and improve entry quality.
• Strategy Deployment Rules
Call Tail Entry (Bull Convexity)
Triggers when:
- Close > SMA 200 (bull trend confirmed)
- VIX < 17 (low volatility, cheap premium)
- RSI < 45 (tactical pullback for entry)
Context : This regime identifies periods where upside convexity is underpriced. Appropriate for OTM call buying or call spreads designed to capture trend acceleration during low-vol environments.
Put Tail Entry (Bear Convexity)
Triggers when:
- Close < SMA 200 (bear trend confirmed)
- VIX < 17 (low volatility, cheap premium)
- RSI > 65 (tactical bounce for entry)
Context : Signals opportunities to buy downside protection or OTM puts during complacent market conditions. Designed for convexity-seeking traders anticipating volatility expansion in bearish structures.
Bull Put Income
Triggers when:
- Close > SMA 200 (bull trend confirmed)
- VIX 17-20 (mid-range volatility, elevated premium)
- Close > SMA 50 (short-term strength)
Context : Identifies favorable conditions for selling OTM put spreads or cash-secured puts. Targets premium collection in constructive markets with sufficient volatility to generate income but not excessive tail risk.
═══════════════════════════════════════════════════════════════════════════════
VISUAL COMPONENTS
═══════════════════════════════════════════════════════════════════════════════
• Chart Signals
- Purple Triangle (below bar) = Call Tail Entry
- Red Triangle (above bar) = Put Tail Entry
- Green Triangle (below bar) = Bull Put Income
• Background Coloring
Chart background dynamically highlights active signals with semi-transparent overlays:
- Purple = Call Tail active
- Red = Put Tail active
- Green = Bull Put Income active
• Strategy Table
Top-right table displays real-time strategy status:
- Strategy name
- Condition Met (✅/❌)
- Color-coded for quick visual scan
• Moving Averages
- SMA 50 (Orange) – Short-term trend filter
- SMA 200 (Blue) – Primary trend delimiter
═══════════════════════════════════════════════════════════════════════════════
KEY FEATURES
═══════════════════════════════════════════════════════════════════════════════
- Multi-timeframe flexibility – Works on Daily, 4H, 1H timeframes for different deployment horizons
- No repainting – All signals confirm on bar close
- Institutional volatility integration – Uses VIX directly from CBOE data feed
- Clean visual hierarchy – Minimal clutter, maximum signal clarity
- Regime-aware strategy allocation – Matches strategy type to market environment
═══════════════════════════════════════════════════════════════════════════════
HOW TO USE
═══════════════════════════════════════════════════════════════════════════════
1. Apply to target underlying – Works on indices (SPX, NDX, RUT), equity ETFs (SPY, QQQ, IWM), or individual equities with liquid options markets.
2. Monitor regime table – Top-right table shows which strategies are currently valid based on real-time conditions.
3. Execute on signal confirmation – When triangle appears + table shows ✅, deploy corresponding options strategy.
4. Timeframe considerations :
• Daily = Swing options (30-60 DTE typical)
• 4H = Shorter-duration tactical (14-30 DTE)
• 1H = Ultra-short-term (0-7 DTE, requires precision execution)
5. Combine with position sizing rules – This indicator identifies when to deploy strategies, not how much . Use appropriate risk management and position sizing frameworks.
═══════════════════════════════════════════════════════════════════════════════
LIMITATIONS
═══════════════════════════════════════════════════════════════════════════════
- VIX dependency – Signals are calibrated for US equity volatility regimes. May require recalibration for other asset classes.
- No options-specific calculations – This indicator identifies favorable regimes but does not calculate Greeks, IV percentile, or specific strike selection. Traders must perform their own options analysis.
- Trend-following bias – The 200-day SMA filter creates a structural bias toward trend-following systems. May underperform in mean-reverting, range-bound markets.
- Signal frequency – Depending on market conditions, signals may be infrequent. This is by design to maintain signal quality over quantity.
═══════════════════════════════════════════════════════════════════════════════
TECHNICAL SPECIFICATIONS
═══════════════════════════════════════════════════════════════════════════════
- Pine Script v5
- Non-repainting (signals confirmed on close)
- Multi-security data feed (VIX via request.security() )
- Maximum 500 labels supported
- Real-time table updates with color-coded status indicators
═══════════════════════════════════════════════════════════════════════════════
NOTES
═══════════════════════════════════════════════════════════════════════════════
This indicator is designed as a decision-support tool for experienced options traders. It provides objective regime classification and timing signals but does not constitute financial advice or a complete trading system. Always perform independent analysis and risk assessment before deploying options strategies.
Appropriate for traders familiar with:
- Volatility term structure
- Options Greeks and pricing dynamics
- Position construction (spreads, naked positions, hedged structures)
- Capital allocation and risk management
═══════════════════════════════════════════════════════════════════════════════
Developed for systematic options deployment based on quantitative regime detection.

Smart Risk Meter (Adaptive v2)How it works
The Smart Risk Meter reads momentum, distance from the long-term trend, and drawdown pressure, then adapts those signals to the asset’s volatility. Low-vol assets get tighter scaling, high-vol assets get wider scaling, so the 0–1 risk score stays meaningful on anything from SPX to BTC.
How to use it
• 0.0–0.4: Accumulation zone. Market is calm or recovering — ideal for building positions.
• 0.4–0.6: Neutral. Trend can go either way — manage sizing.
• 0.6–0.8: Elevated risk. Momentum is stretched — tighten stops or reduce exposure.
• 0.8–1.0: Overheated. High risk of sharp pullbacks — avoid chasing.
Use it as a bias filter, a DCA timing tool, or a simple risk-on/risk-off read. It won’t predict tops or bottoms, but it keeps you aligned with the market’s temperature.

SHUBHAM 50000 ULTRA OPTIONSHUBHAM 50000 ULTRA OPTION
OptionFlow Pro: Smart Money & Anomaly Detection Indicator
Tagline: Don't just follow the flow. Understand it.
Core Concept:
OptionFlow Pro is an advanced, real-time market scanner and visual indicator that transforms raw options chain data into actionable trading intelligence. It goes beyond simple volume and open interest by identifying Unusual Options Activity (UOA), tracking Sweep Orders, and calculating the Volume-Weighted Put/Call Ratio to highlight where institutional "smart money" is placing its bets.
Key Features for Traders:
Unusual Activity & Sweep Detector:
What it does: Scans every tick for orders that significantly deviate from normal trading patterns—large block trades executed at the ask (for calls) or bid (for puts), and "sweep" orders that clean out multiple price levels instantly.
Trader Benefit: Pinpoints potential breakout or breakdown candidates before major moves occur in the underlying stock. Alerts you to aggressive, high-conviction buying or selling that retail traders often miss.
Volume-Weighted Put/Call Ratio (with Trend):
What it does: Calculates the put/call ratio not just by volume, but by the premium spent. A high premium-weighted put/call ratio shows bears are putting serious money behind their bets, making it a stronger signal.
Trader Benefit: Offers a more nuanced view of market sentiment than standard PCR. Helps gauge extreme fear (potential oversold bounce) or complacency (overbought top) in a specific stock or index (SPX/SPY).
Max Pain & Gamma Exposure (GEX) Visualizer:
What it does: Dynamically calculates the "Max Pain" strike (where option sellers face minimal losses) and estimates Gamma Exposure levels. Visual overlays on the chart show key pin levels and large gamma walls.
Trader Benefit: Identifies potential price magnets for weekly/monthly expiry. Understand where hedging activity by market makers may amplify volatility (negative gamma) or suppress it (positive gamma), aiding in entry/exit planning.
Implied Volatility (IV) Rank & Skew Analysis:
What it does: Compares current IV to its historical range (IV Rank) and visualizes the volatility smile/skew across strikes. Highlights expensive vs. cheap option premiums.
Trader Benefit: Empowers you to sell overpriced volatility (high IV Rank) and buy underpriced volatility (low IV Rank). Skew anomalies can signal asymmetric risk/reward opportunities or market fears about a sharp directional move.
Customizable Alerts & Heatmaps:
What it does: Set alerts for specific UOA criteria, PCR spikes, or IV changes. The platform-wide heatmap aggregates flow data across all symbols to show sector-level money movement.
Trader Benefit: Saves hours of manual scanning. Focus only on the setups that match your strategy (e.g., "Alert me for any $1M+ call sweeps in tech stocks").
Who Is It For?
Active Options Traders & Scalpers: Find high-probability directional plays with institutional confirmation.
Hedgers & Portfolio Managers: Identify tail-risk hedging activity and gauge overall market dealer positioning.
Volatility Traders: Precisely time entries for strangles, straddles, or iron condors based on IV regime and gamma.
Swing Traders & Technical Analysts: Confirms or diverges from classic chart patterns (e.g., breakout with strong call flow = higher conviction).
Why It's Different:
Most indicators look backward at price. OptionFlow Pro looks forward at market structure, liquidity, and dealer hedging flows. It doesn't predict the future; it reveals the present positioning that will influence future price action.
Platform Integration: Available as a standalone web platform, a TradingView custom script, and a direct data feed into thinkorswim, Interactive Brokers, and other major brokerages.

Reversal WaveThis is the type of quantitative system that can get you hated on investment forums, now that the Random Walk Theory is back in fashion. The strategy has simple price action rules, zero over-optimization, and is validated by a historical record of nearly a century on both Gold and the S&P 500 index.
Recommended Markets
SPX (Weekly, Monthly)
SPY (Monthly)
Tesla (Weekly)
XAUUSD (Weekly, Monthly)
NVDA (Weekly, Monthly)
Meta (Weekly, Monthly)
GOOG (Weekly, Monthly)
MSFT (Weekly, Monthly)
AAPL (Weekly, Monthly)
System Rules and Parameters
Total capital: $10,000
We will use 10% of the total capital per trade
Commissions will be 0.1% per trade
Condition 1: Previous Bearish Candle (isPrevBearish) (the closing price was lower than the opening price).
Condition 2: Midpoint of the Body The script calculates the exact midpoint of the body of that previous bearish candle.
• Formula: (Previous Open + Previous Close) / 2.
Condition 3: 50% Recovery (longCondition) The current candle must be bullish (green) and, most importantly, its closing price must be above the midpoint calculated in the previous step.
Once these parameters are met, the system executes a long entry and calculates the exit parameters:
Stop Loss (SL): Placed at the low of the candle that generated the entry signal.
Take Profit (TP): Calculated by projecting the risk distance upward.
• Calculation: Entry Price + (Risk * 1).
Risk:Reward Ratio of 1:1.
About the Profit Factor
In my experience, TradingView calculates profits and losses based on the percentage of movement, which can cause returns to not match expectations. This doesn’t significantly affect trending systems, but it can impact systems with a high win rate and a well-defined risk-reward ratio. It only takes one large entry candle that triggers the SL to translate into a major drop in performance.
For example, you might see a system with a 60% win rate and a 1:1 risk-reward ratio generating losses, even though commissions are under control relative to the number of trades.
My recommendation is to manually calculate the performance of systems with a well-defined risk-reward ratio, assuming you will trade using a fixed amount per trade and limit losses to a fixed percentage.
Remember that, even if candles are larger or smaller in size, we can maintain a fixed loss percentage by using leverage (in cases of low volatility) or reducing the capital at risk (when volatility is high).
Implementing leverage or capital reduction based on volatility is something I haven’t been able to incorporate into the code, but it would undoubtedly improve the system’s performance dramatically, as it would fix a consistent loss percentage per trade, preventing losses from fluctuating with volatility swings.
For example, we can maintain a fixed loss percentage when volatility is low by using the following formula:
Leverage = % of SL you’re willing to risk / % volatility from entry point to exit or SL
And if volatility is high and exceeds the fixed percentage we want to expose per trade (if SL is hit), we could reduce the position size.
For example, imagine we only want to risk 15% per SL on Tesla, where volatility is high and would cause a 23.57% loss. In this case, we subtract 23.57% from 15% (the loss percentage we’re willing to accept per trade), then subtract the result from our usual position size.
23.57% - 15% = 8.57%
Suppose I use $200 per trade.
To calculate 8.57% of $200, simply multiply 200 by 8.57/100. This simple calculation shows that 8.57% equals about $17.14 of the $200. Then subtract that value from $200:
$200 - $17.14 = $182.86
In summary, if we reduced the position size to $182.86 (from the usual $200, where we’re willing to lose 15%), no matter whether Tesla moves up or down 23.57%, we would still only gain or lose 15% of the $200, thus respecting our risk management.
Final Notes
The code is extremely simple, and every step of its development is detailed within it.
If you liked this strategy, which complements very well with others I’ve already published, stay tuned. Best regards.

Fed Net Liquidity [Premium] [by Golman Armi]This indicator visualizes the USD Net Liquidity injected into the financial system by the Federal Reserve.
It is a fundamental macro-economic tool essential for understanding the underlying "fuel" driving risk assets such as the S&P 500 (SPX), Nasdaq (NDX), and Bitcoin (BTC).
Unlike many other liquidity scripts that incorrectly use Commercial Bank Assets (USCBBS), this script uses the Federal Reserve Total Assets (WALCL) to provide a mathematically accurate representation of Central Bank liquidity.
How It Works (The Formula)
Net Liquidity represents the actual cash available to the banking system for investment after government liabilities are subtracted. The formula used is:
NetLiquidity=WALCL−TGA−RRP
Where:
WALCL (Fed Balance Sheet): The total assets held by the Federal Reserve (The source of money printing).
TGA (Treasury General Account - WTREGEN): The checking account of the US Government. When the TGA goes up, money is removed from the economy; when it goes down, money is spent into the economy.
RRP (Reverse Repo - RRPONTTLD): Cash parked by banks and money market funds at the Fed overnight. A rise in RRP removes liquidity from the markets.
Features
Accurate Data Sourcing: Pulls daily data directly from FRED (Federal Reserve Economic Data).
Unit Correction: Automatically adjusts conflicting units (Millions vs Billions) from TradingView data feeds to output a correct value in Trillions of Dollars.
Trend Cloud: Features a smoothing EMA (Exponential Moving Average) with a color-coded cloud to easily identify the macro trend (Green for expansion, Red for contraction).
How to Use
Trend Correlation:
Rising Line (Green): Liquidity is expanding. Historically, this supports bullish trends in stocks and crypto.
Falling Line (Red): Liquidity is being drained (QT or TGA refill). This often leads to volatility or bearish trends in risk assets.
Divergences (The most powerful signal):
If the S&P 500 or Bitcoin makes a New High, but Net Liquidity makes a Lower High, it indicates a "hollow rally" lacking fundamental support, often preceding a correction.
Disclaimer
This tool is for educational purposes and macro-economic analysis only. It is not financial advice.

Greater Moving AverageThe purpose for this indicator is to function as a comprehensive market-state detector, with the primary goal of avoiding a market crash.
Mendoza Lines (V-pattern detection) identify early crash conditions and warn when market structure becomes unstable.
RSI/volume-shaded candles + Supertrend confirm momentum and trend, creating a unified system to avoid major drawdowns.
Enhanced Wyckoff ranges with ATR.
Mendoza lines identify abrupt V-shaped reversals which often precede high-risk crash structures. By tracking both the formation and resolution of these patterns across multiple timeframes, the indicator provides early warning signals when the market is entering unstable territory, allowing traders to step aside before liquidity collapses or structural breakdowns begin.
Ideal configurations use Heikin Ashi to smooth out candle structure. Observe SPX on a Weekly Chart, which correctly identifies exits and entries during the 2001 and 2009 crashes. On a 6 hour chart, the Tariff low is correctly identified. The improved VWAP uses a cumulative metric rather than the built in ta.vwap calculation, and functions as a macro low beacon when crossed with the 200 EMA. Historically, these crosses have aligned closely with macro cycle lows.
To round out the system, the indicator overlays RSI-based and volume-weighted candle shading to reflect internal momentum and real buying/selling pressure directly on the chart, making shifts in strength immediately visible. A Supertrend confirmation layer acts as the final filter, smoothing noise and verifying trend direction before decisions are made.

US Market Long Horizon Momentum Summary in one paragraph
US Market Long Horizon Momentum is a trend following strategy for US index ETFs and futures built around a single eighteen month time series momentum measure. It helps you stay long during persistent bull regimes and step aside or flip short when long term momentum turns negative.
Scope and intent
• Markets. Large cap US equity indices, liquid US index ETFs, index futures
• Timeframes. 4h/ Daily charts
• Default demo used in the publication. SPY on 4h timeframe chart
• Purpose. Provide a minimal long bias index timing model that can reduce deep drawdowns and capture major cycles without parameter mining
• Limits. This is a strategy. Orders are simulated on standard candles only
Originality and usefulness
• Unique concept or fusion. One unscaled multiple month log return of an external benchmark symbol drives all entries and exits, with optional volatility targeting as a single risk control switch.
• Failure mode addressed. Fully passive buy and hold ignores the sign of long horizon momentum and can sit through multi year drawdowns. This script offers a way to step down risk in prolonged negative momentum without chasing short term noise.
• Testability. All parameters are visible in Inputs and the momentum series is plotted so users can verify every regime change in the Tester and on price history.
• Portable yardstick. The log return over a fixed window is a unit that can be applied to any liquid symbol with daily data.
Method overview in plain language
The method looks at how far the benchmark symbol has moved in log return terms over an eighteen month window in our example. If that long horizon return is positive the strategy allows a long stance on the traded symbol. If it is negative and shorts are enabled the strategy can flip short, otherwise it goes flat. There is an optional realised volatility estimate on the traded symbol that can scale position size toward a target annual volatility, but in the default configuration the model uses unit leverage and only the sign of momentum matters.
Base measures
Return basis. The core yardstick is the natural log of close divided by the close eighteen months ago on the benchmark symbol. Daily log returns of the traded symbol feed the realised volatility estimate when volatility targeting is enabled.
Components
• Component one Momentum eighteen months. Log of benchmark close divided by its close mom_lookback bars ago. Its sign defines the trend regime. No extra smoothing is applied beyond the long window itself.
• Component two Realised volatility optional. Standard deviation of daily log returns on the traded symbol over sixty three days. Annualised by the square root of 252. Used only when volatility targeting is enabled.
• Optional component Volatility targeting. Converts target annual volatility and realised volatility into a leverage factor clipped by a maximum leverage setting.
Fusion rule
The model uses a simple gate. First compute the sign of eighteen month log momentum on the benchmark symbol. Optionally compute leverage from volatility. The sign decides whether the strategy wants to be long, short, or flat. Leverage only rescales position size when enabled and does not change direction.
Signal rule
• Long suggestion. When eighteen month log momentum on the benchmark symbol is greater than zero, the strategy wants to be long.
• Short suggestion. When that log momentum is less than zero and shorts are allowed, the strategy wants to be short. If shorts are disabled it stays flat instead.
• Wait state. When the log momentum is exactly zero or history is not long enough the strategy stays flat.
• In position. In practice the strategy sits IN LONG while the sign stays positive and flips to IN SHORT or flat only when the sign changes.
Inputs with guidance
Setup
• Momentum Lookback (months). Controls the horizon of the log return on the benchmark symbol. Typical range 6 to 24 months. Raising it makes the model slower and more selective. Lowering it makes it more reactive and sensitive to medium term noise.
• Symbol. External symbol used for the momentum calculation, SPY by default. Changing it lets you time other indices or run signals from a benchmark while trading a correlated instrument.
Logic
• Allow Shorts. When true the strategy will open short positions during negative momentum regimes. When false it will stay flat whenever momentum is negative. Practical setting is tied to whether you use a margin account or an ETF that supports shorting.
Internal risk parameters (not exposed as inputs in this version) are:
• Target Vol (annual). Target annual volatility for volatility targeting, default 0.2.
• Vol Lookback (days). Window for realised volatility, default 63 trading days.
• Max Leverage. Cap on leverage when volatility targeting is enabled, default 2.
Usage recipes
Swing continuation
• Signal timeframe. Use the daily chart.
• Benchmark symbol. Leave at SPY for US equity index exposure.
• Momentum lookback. Eighteen months as a default, with twelve months as an alternative preset for a faster swing bias.
Properties visible in this publication
• Initial capital. 100000
• Base currency. USD
• Default order size method. 5% of the total capital in this example
• Pyramiding. 0
• Commission. 0.03 percent
• Slippage. 3 ticks
• Process orders on close. On
• Bar magnifier. Off
• Recalculate after order is filled. Off
• Calc on every tick. Off
• All request.security calls use lookahead = barmerge.lookahead_off
Realism and responsible publication
The strategy is for education and research only. It does not claim any guaranteed edge or future performance. All results in Strategy Tester are hypothetical and depend on the data vendor, costs, and slippage assumptions. Intrabar motion is not modeled inside daily bars so extreme moves and gaps can lead to fills that differ from live trading. The logic is built for standard candles and should not be used on synthetic chart types for execution decisions.
Performance is sensitive to regime structure in the US equity market, which may change over time. The strategy does not protect against single day crash risk inside bars and does not model gap risk explicitly. Past behavior of SPY and the momentum effect does not guarantee future persistence.
Honest limitations and failure modes
• Long sideways regimes with small net change over eighteen months can lead to whipsaw around the zero line.
• Very sharp V shaped reversals after deep declines will often be missed because the model waits for momentum to turn positive again.
• The sample size in a full SPY history is small because regime changes are infrequent, so any test must be interpreted as indicative rather than statistically precise.
• The model is highly dependent on the chosen lookback. Users should test nearby values and validate that behavior is qualitatively stable.
Legal
Education and research only. Not investment advice. You are responsible for your own decisions. Always test on historical data and in simulation with realistic costs before any live use.

Global Liquidity Index LITEGlobal Liquidity Index (GLI LITE) is an indicator that measures global liquidity by combining the balance sheets of major central banks (FED, ECB, PBOC, BOJ) and the M2 money supply of the world’s largest economies (USA, Europe, China, Japan).
Since liquidity directly influences the price of risk assets (BTC, NASDAQ, SPX, etc.), GLI is one of the most important macro signals for identifying market bull/bear regimes.
What the indicator shows:
GLI momentum line (green = liquidity expansion, orange = contraction)
Fast & Slow MA lines that define the liquidity trend
Bull/Bear background coloring
Green → global liquidity is expanding
Red → liquidity is tightening
Correlation between GLI and the asset price (e.g., BTC)
Macro trend panel (Bull / Bear / Neutral)
How to use the indicator:
Bull regime (Fast MA > Slow MA)
Liquidity is expanding and the market has a natural tailwind. Risk assets tend to perform better.
Bear regime (Fast MA < Slow MA)
Liquidity is tightening — higher risk, increased volatility, and more downside pressure.
GLI ↔ Price Correlation
If correlation is high (e.g., > 0.6), GLI can be an excellent leading indicator for price movement.

OBV + A/D Accumulation Score# OBV + A/D Accumulation Score
This script fuses **On-Balance Volume (OBV)** and **Chaikin Accumulation/Distribution Line** into one perfectly normalized, weighted, smoothed score that reveals **exactly** what smart money is doing on a **daily basis** — even when you're watching lower timeframes.
It only moves when real institutional order flow is present. Zero-line crosses and extreme levels have an uncanny ability to call major turns before price even blinks.
Institutional accumulation/distribution, distilled into one clean line.
### Why This Indicator Is Special
- **Z-Score Normalization** → OBV and A/D are forced onto the exact same scale so neither dominates (most combined indicators fail here)
- **Weighted Composite** → Default 50/50, but you can slide it to favor OBV or A/D depending on the asset (huge edge on crypto vs stocks)
- **Daily Resolution Forced** → Shows true daily smart-money flow no matter what chart you're on (add to 1H/4H for god-tier context)
- **Extreme Thresholds** (±1.2 default) with lime/maroon coloring → When these hit, institutions are going nuclear
- **Optional Histogram Mode** + subtle pane background tint → Instant bias recognition
- **Full Alert Suite** → Zero-cross + Extreme breaches (with current score value in the message)
### How to Trade It (The Signals That Actually Print)
**Primary Signals**
- Green triangle + alert → Accumulation just turned ON (smart money buying pressure now dominant)
- Red triangle + alert → Distribution just turned ON (smart money exiting)
**Nuclear Signals**
- Lime color + "EXTREME ACCUMULATION" alert → Institutions aggressively piling in → one of the strongest buy signals on daily
- Maroon color + "EXTREME DISTRIBUTION" alert → Institutions dumping hard → one of the strongest sell/short signals
**Best Uses**
- Zero-cross up + price above daily EMA-9/21 → Swing long bias god mode
- Divergences on daily (price new high + score lower high = top incoming)
- Extreme accumulation while price is basing → Buy the breakout and thank me later
Works insanely well on BTC/ETH, SPX/QQQ, NVDA, TSLA — anything with real institutional volume.
### Settings Explained
- **Z-Score Lookback** (50): Longer = only major regime changes
- **Signal Smoothing** (10): Lower = more responsive, higher = smoother trend
- **OBV Weight** (0.5): Slide toward 1.0 for pure direction-based strength, toward 0.0 for close-location sensitivity
- **Extreme Threshold**: 1.2 is perfect balance — raise to 1.8+ for only the absolute strongest moves
- **Show as Histogram**: MACD-style bars (great for ranging markets)
- **Background tint**: Subtle green/red — you'll love it or disable it

TraderForge - Everest Auto Top & BottomEverest is a price action tool designed to help traders instantly spot market structure by automatically plotting swing highs and lows. It detects key reversal points using built-in pivot logic and visually marks each top and bottom on your chart with clean labels and connecting lines.
Customizable sensitivity lets you fine-tune the indicator to match any timeframe or asset. Clean visual markers and dashed swing connectors help you quickly recognize market direction and key reversal zones.
Everest works across all assets — from SPX and futures to crypto and stocks — making it a versatile companion for intraday scalpers or swing traders alike.
Whether you’re tracking higher highs and lower lows or identifying fresh support and resistance, Everest keeps your structure clear and your chart clean.
TraderForge – Simple indicators. Powerful results.

Stock Relative Strength Rotation Graph🔄 Visualizing Market Rotation & Momentum (Stock RSRG)
This tool visualizes the sector rotation of your watchlist on a single graph. Instead of checking 40 different charts, you can see the entire market cycle in one view. It plots Relative Strength (Trend) vs. Momentum (Velocity) to identify which assets are leading the market and which are lagging.
📜 Credits & Disclaimer
Original Code: Adapted from the open-source " Relative Strength Scatter Plot " by LuxAlgo.
Trademark: This tool is inspired by Relative Rotation Graphs®. Relative Rotation Graphs® is a registered trademark of JOOS Holdings B.V. This script is neither endorsed, nor sponsored, nor affiliated with them.
📊 How It Works (The Math)
The script calculates two metrics for every symbol against a benchmark (Default: SPX):
X-Axis (RS-Ratio): Is the trend stronger than the benchmark? (>100 = Yes)
Y-Axis (RS-Momentum): Is the trend accelerating? (>100 = Yes)
🧩 The 4 Market Quadrants
🟩 Leading (Top-Right): Strong Trend + Accelerating. (Best for holding).
🟦 Improving (Top-Left): Weak Trend + Accelerating. (Best for entries).
⬜ Weakening (Bottom-Right): Strong Trend + Decelerating. (Watch for exits).
🟥 Lagging (Bottom-Left): Weak Trend + Decelerating. (Avoid).
✨ Significant Improvements
This open-source version adds unique features not found in standard rotation scripts:
📝 Quick-Input Engine: Paste up to 40 symbols as a single comma-separated list (e.g., NVDA, AMD, TSLA). No more individual input boxes.
🎯 Quadrant Filtering: You can now hide specific quadrants (like "Lagging") to clear the noise and focus only on actionable setups.
🐛 Trajectory Trails: Visualizes the historical path of the rotation so you can see the direction of momentum.
🛠️ How to Use
Paste Watchlist: Go to settings and paste your symbols (e.g., US Sectors: XLK, XLF, XLE...).
Find Entries: Look for tails moving from Improving ➔ Leading.
Find Exits: Be cautious when tails move from Leading ➔ Weakening.
Zoom: Use the "Scatter Plot Resolution" setting to zoom in or out if dots are bunched up.

Estrategia Trend Following: 52w/26w BreakoutThis is a classic long-term Trend Following strategy, heavily inspired by the Donchian Channel system and the legendary "Turtle Trading" rules. It is designed to capture major market moves (bull runs) while filtering out short-term market noise and volatility.
This script is ideal for investors and swing traders who prefer a "hands-off" approach, looking to catch large trends rather than day-trading small fluctuations.
How it Works:
1. Entry Condition (The Breakout):
52-Week High: The strategy enters a Long position when the price breaks above the highest high of the last 252 trading days (approx. 1 year).
SuperTrend Filter: An additional filter using the SuperTrend indicator ensures that the breakout is supported by positive momentum, helping to reduce false signals during choppy lateral markets.
2. Exit Condition (The Trailing Stop):
26-Week Low: The strategy ignores short-term corrections. It only closes the position if the price closes below the lowest low of the last 126 trading days (approx. 6 months).
This wide stop allows the trade to "breathe" and stay open during significant pullbacks, ensuring you stay in the trend for as long as possible.
Features & Settings:
Customizable Lookback Periods: You can adjust the Entry (default 252 days) and Exit (default 126 days) periods in the settings menu.
Visual Aids:
Blue Line: Represents the 1-Year High (Entry Threshold).
Red Line: Represents the 6-Month Low (Dynamic Stop Loss).
Channel Shading: Visualizes the trading range between the high and low.
Labels: Clearly marks "BUY" and "EXIT" points on the chart.
Recommended Usage:
Timeframe: Daily (1D). This logic is designed for daily candles.
Assets: Works best on assets with strong trending characteristics (e.g., Bitcoin/Crypto, Tech Stocks, Indices like SPX/NDX, and Commodities).
Patience Required: This strategy generates very few signals. It may stay quiet for months and then hold a position for over a year.

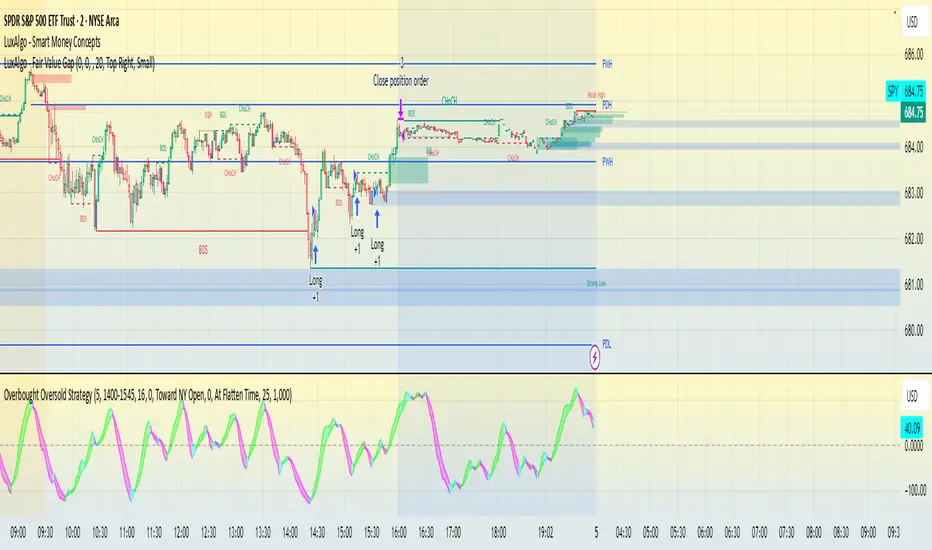
Overbought Oversold Strategy - SPY-SPX-QQQ 0DTEOverbought / oversold strategy designed for scalping. Configured to run for scalps at end of day.
The Overbought Oversold Strategy calculates a custom oscillator using exponential moving averages and standard deviation on a weighted price to identify momentum shifts.
Entry and Exit are tunable for back testing your style of trading.
It allows users to restrict trading to a specified session, defaulting to NY market hours (9:30 AM to 4:00 PM), and optionally flattens all positions at a user-defined time like market close to manage overnight risk. Entry strategies include buying only on buy signals, selling only on sell signals, or mean-reverting toward the NY open price or a custom target by entering long if below or short if above when signals align. Exit options comprise fixed tick-based profit targets and stop losses, closing on the next opposing signal, or holding until the flatten time, ensuring flexible risk management.
VOID/DOM Tier4 Options CoreExecution Windows
Professional Description (Publish-Ready)
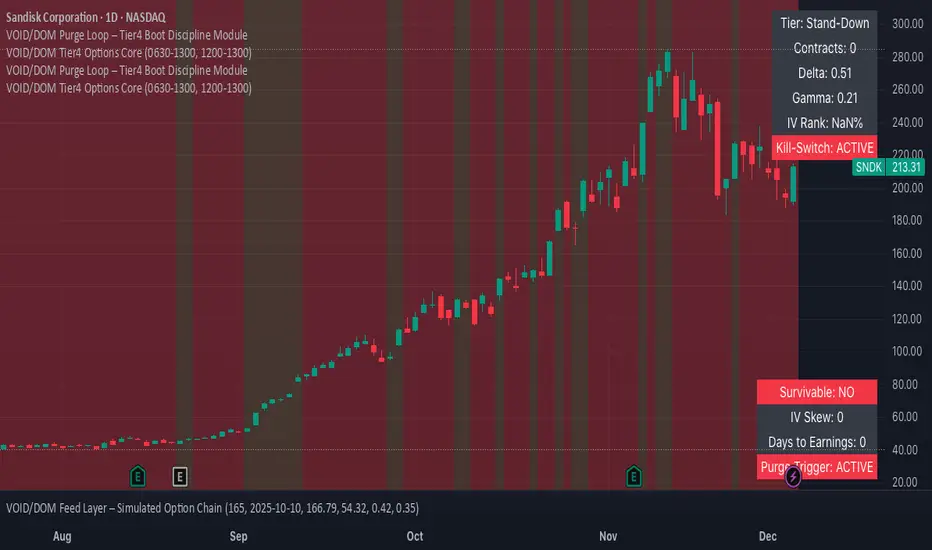
VOID/DOM Tier4 Options Core is an institutional-grade microstructure engine designed to map premium flow, volatility skew, contract drift, and IV-pressure zones during the highest-value trading windows of the day.
This module is optimized for OPTIONS decision-making, not price-only signals. It extracts Tier-4 DOM + Options Chain influence and converts it into clean flow-intent guidance, ideal for directional confirmation, momentum continuation, or early-warning reversal detection.
Core Capabilities
• Tier-4 Options DOM Mapping
Captures hidden liquidity pockets, premium migrations, and microstructure imbalances that standard technical indicators can’t see.
• Flow Premium Pressure (0630–1300 Core Session)
Tracks how premium shifts through the morning auction → trend establishment → mid-day compression.
Helps determine when momentum is real vs fading.
• Volatility & Contract Drift Sync (1200–1300 Reset Window)
Reads IV cooling, gamma realignment, and exhaustion signatures leading into mid-day resets.
• Reversal + Continuation Bias Engine
Filters noise and reveals true intent—ideal for options traders needing direction + timing.
• Multi-Asset Compatibility
Futures, indices, SPX/SPY derivatives, and high-beta assets.
What This Module Is For
✔ Confirming options entries with real flow
✔ Avoiding false moves during chop
✔ Reading premium pressure during the most lucrative sessions
✔ Identifying when liquidity is forcing price vs when price is bluffing
✔ Syncing with the rest of your VOID/DOM Tier4 ecosystem (Chain Scanner, Purge Loop, Apex Fusion, etc.)
Recommended Use
Runs best as a confirmation and environment-grading module, not a standalone signal generator.
Pairs extremely well with Apex Fusion, RAI, SS++ God filters, and all Tier4 chain-based indicators.
OBV + WaveTrend Volume Scalper [GratefulFutures]This script is a combination script of three different strategies that provides buy and sell signals based on the change of volume with momentum confirmations.
Sources used:
This script relies on the outstanding scripts of the great script writer LazyBear: LazyBear
The following scripts were used in this publication:
1. A modified "On-Balance Volume Oscillator" modified from LazyBear's original script:
2. Wavetrend Oscillator with crosses, Author: LazyBear
3. Squeeze Momentum Oscillator, Author: LazyBear
This script functions based on the following criteria being true:
1. On balance volume oscillator turning from negative to positive (buy) or positive to negative (sell)
2. Squeeze Momentum value is increasing (buy) or decreasing (sell)
3. Wavetrend 1 (wt1) is greater than wavetrend 2 (wt2) (buy)/ Wavetrend 1 (wt1) is less than wavetrend 2 (wt2) (sell)
By combining these factors the indicator is able to signal exactly when net buying turns to net selling (OBV) and when this change is most advantageous to continue based on the momentum and price action of the underlying asset (SQMOMO and Wavetrend).
This allows you to pair volume and price action for a powerful tool to identify where price will reverse or continue providing exceptional entries for short term trades, especially when combined with other aspects such as support and resistance, or volume profile.
How to use:
Simply adjust the settings to your preference and read the given signals as generated.
Settings
There are multiple ways to tune the signals generated. It is set standard for my preferred use on a 1 minute chart.
OBV Oscillator Settings
The first 4 dropdowns in the Inputs section tune the On Balance Volume Oscillator (OBVO) portion of the indicator. You can choose if you want it to calculate based on close, open, high, low, or other value.
The most impactful in the entire settings is going to be the length and smoothing of the OBVO EMA. Making this number lower increasing the sensitivity to changes in volume, making the signals come quicker but is more susceptible to quick fluctuations. A value of between (5-20) is reasonable for the OBVO EMA length. There is a separate smoothing factor titled OBV Smoothing Length and below that, OBV Smoothing Type , a value of (2) is standard with "SMA" for smoothing type with a value of between 2-10 being reasonable. You may also play with these values to see what you like for your trading style.
Wavetrend Settings
The next 3 options are to modify the wavetrend portion of the indicator. I do not modify these from standard, and feel that they work appropriately on all time frames at the following values: n1 length (10), n2 length (20), Wavetrend Signal SMA length (4)
Squeeze Momentum Settings
The following 5 options through the end modify the Squeeze momentum portion of the indicator. The only one that modifies the signals generated is the KC Length , Making this number lower increasing the sensitivity to changes in price action, making the signals come quicker but is more susceptible to quick fluctuations. A value of between (18-25) is reasonable for KC Length .
Style Setting
You may select if you want to see the buy and sell signals. The following 5 options Raw OBV Osc through Squeeze Momentum allow you to see where each specific requirement was met, posted as a vertical line, but for live use it is recommended to turn all of these vertical lines off and only use the buy and sell signals.
Time Frames:
While this script is most effective on shorter time frames (1 minute for scalping and daytrading) it is also viable to use it on longer timeframes, due to the nature of its components being independent of time frame.
Examples of use - (Green and red vertical lines are for visualization purpose and are not part of the script)
SPY 1 Minute (Factory Settings):
SPX 15 minutes (Factory Settings):
Considerations
This script is meant primarily for short term trading, trades on the basis of seconds to minutes primarily. While they can be a good indication of volume lining up with momentum, it is always wise to use them in combination with other factors such as support, resistance, market structure, volume levels, or the many other techniques out there...
As Always... Happy Trading.
-Not_A_Mad_Scientist (GreatfulFutures Trade University)

NC-ALPHA INDEX [Pro Pane] - Smart Money Flow01. THE PROBLEM: MARKET CAP IS A LAGGING INDICATOR
Standard crypto indices (like Coin50 or Total Market Cap) are weighted by capitalization. This is a flawed model for active traders because it prioritizes "Dino Coins"—older assets with massive supplies but very little active volume or price discovery. They are heavy, slow, and hide the real story.
02. THE SOLUTION: VOLUME-VELOCITY WEIGHTING
The NC-ALPHA INDEX is designed for SMC (Smart Money Concepts) traders who need to see where the real liquidity is flowing right now.
Instead of static weighting, this script dynamically adjusts the influence of each asset based on its Real-Time Dollar Volume.
High Volume = High Impact: If a specific asset (e.g., SOL, HYPE, or PEPE) is attracting massive liquidity inflow, its weight in the index increases instantly.
Low Volume = Low Impact: Assets with no volume ("Zombie coins") have minimal impact on the index line, preventing false signals.
03. THE "MARKET DRIVERS" BASKET
The index tracks a curated basket of 10 high-velocity assets representing the current market meta:
1 - Kings: BTC, ETH
2 - Market Leaders: SOL, BNB
3 - High Beta / L1s: SUI
Sector Proxies: DOGE (Memes), HYPE (DEX/Perps), AAVE (DeFi), LINK (Infra), XRP.
04. HOW TO TRADE WITH IT
A. The Divergence (Trap Detector) If Bitcoin is making a Higher High (HH) at a Key Resistance, but the NC-ALPHA Index is making a Lower High (LH) or stagnating:
Signal: The pump is unsupported by broad liquidity. It is likely a "Fake Pump" driven by wash trading or isolated manipulation. High probability of an SFP (Swing Failure Pattern).
B. The HUD (Heads-Up Display) The dashboard on the chart shows you exactly what is moving the market.
Look at the "W%" (Weight) column.
Signal: If an Altcoin (like SUI or HYPE) suddenly exceeds 15-20% weight, a Sector Rotation is occurring. Stop watching BTC and focus on that asset.
05. TECHNICAL NOTES
Crash Proof: Built with advanced nz() data handling to prevent the "disappearing line" bug common in composite indices.
Usage Rule: For accurate calculation, use this indicator on 24/7 Crypto Charts (BTC, ETH, SOL) rather than Traditional Finance charts (VIX, SPX) to avoid weekend data gaps.
Built by KheopsCrypto for the SMC Community.

Smart Gap Projection MTF Smart Gap Projection MTF
## Brief Description
Professional indicator for projecting US Dollar Index (DXY) gaps onto the traded instrument with multi-timeframe analysis support and advanced visualization.
---
## Originality and Uniqueness
**Smart Gap Projection MTF** is a unique development that solves the specific task of correlation analysis between the Dollar Index (DXY) and currency pairs, cryptocurrencies, or other dollar-dependent assets.
### What makes this indicator original:
1. **Inter-market gap projection** - the indicator doesn't just display gaps on the current instrument, but projects gaps from the DXY index onto your asset's chart, creating unique trading levels
2. **Dual confirmation system** - uses a mechanism of waiting N candles after a gap appears on DXY to filter false signals
3. **Intelligent lifecycle tracking** - each projected level is tracked until price touch or gap closure on DXY, with automatic visualization changes
4. **Multi-Timeframe extension** - ability to simultaneously display gaps from a lower timeframe of the current instrument to identify intraday opportunities
5. **Adaptive visualization (Heatmap)** - line intensity and width automatically change depending on gap size, helping to visually identify the most significant levels
---
## How the Indicator Works
### Core Operating Principle
The indicator analyzes the US Dollar Index (DXY) price movement in real-time and identifies gaps (price breaks) between candle closes and opens. When a gap forms on DXY, the indicator:
1. **Determines gap type** - bullish (price opened above previous close) or bearish (price opened below)
2. **Checks gap size** - filters insignificant gaps by absolute size (in points) and percentage value
3. **Waits for confirmation** - after detecting a gap, the indicator waits for a specified number of candles (default 3) to confirm that the gap didn't close immediately
4. **Projects the level** - after confirmation, a horizontal line is drawn on the current instrument's chart at the High level (for bullish DXY gap) or Low level (for bearish DXY gap) of the candle where the gap formed
5. **Tracks status** - the indicator continuously monitors:
- Price touching the projected level (line becomes more transparent)
- Gap closure on DXY itself (line changes color to orange)
### Conceptual Foundation
The methodology is based on the observation that:
- Gaps on the Dollar Index often lead to synchronous movements on correlated assets
- Price levels at the moment of DXY gap formation become price magnets
- Gap closure on DXY often coincides with trend reversal on dependent instruments
---
## How to Use the Indicator
### Basic Setup
1. **Add the indicator to the chart** of any asset correlated with the dollar (EUR/USD, GBP/USD, Bitcoin, Gold, etc.)
2. **Configure main parameters:**
- `DXY Symbol` - leave as "TVC:DXY" (standard Dollar Index ticker)
- `Minimum gap size` - minimum gap size in points (0.0001-0.001 for DXY)
- `Confirmation candles` - number of confirmation candles (recommended 3-5)
3. **Set up visualization:**
- Choose colors for bullish and bearish gaps
- Set desired transparency for each gap type
- Enable/disable `Use heatmap` for adaptive visualization
### Timeframe Recommendations
- **Scalping (M1-M5):** use MTF gaps from M1 timeframe, confirmationCandles = 2-3
- **Intraday (M15-H1):** standard settings, can add MTF M5-M15
- **Swing trading (H4-D1):** increase confirmationCandles to 5-10, MTF H1-H4
### Use with Other Instruments
The indicator is universal and works on:
- **Forex:** EUR/USD, GBP/USD, USD/JPY, AUD/USD and other dollar pairs
- **Cryptocurrencies:** BTC/USD, ETH/USD (direct dollar dependency)
- **Commodities:** Gold (XAU/USD), Silver (XAG/USD), Oil
- **Indices:** SPX, NDX, especially during dollar movements
---
## Configuration Parameters
### Main Settings
- **DXY Symbol** - Dollar Index symbol (default TVC:DXY)
- **Minimum gap size** - minimum gap size in points for filtering
- **Minimum gap size (%)** - minimum percentage size (0 = disabled)
- **Confirmation candles** - number of candles for confirmation (1-10)
- **Maximum gaps on chart** - maximum number of displayed projections
### Multi-Timeframe
- **Enable MTF gaps** - enable/disable MTF gaps
- **Timeframe for gaps** - select lower timeframe for search
- **Max MTF gaps** - maximum number of MTF lines (5-2000)
- **Min MTF gap size** - minimum MTF gap size
- **MTF lines color** - MTF lines color
- **MTF lines style** - line style (Solid/Dashed/Dotted)
- **MTF lines width** - MTF lines width (1-3)
### Visualization
- **Extend lines right** - extend lines to the right
- **Use heatmap** - use adaptive visualization (width/brightness from gap size)
- **Stop lines when DXY gap closes** - stop lines when gap closes on DXY
### Colors
- **Bullish gap color** - color of bullish DXY gap lines
- **Bullish Transparency** - transparency of bullish lines (0-90)
- **Bearish gap color** - color of bearish DXY gap lines
- **Bearish Transparency** - transparency of bearish lines (0-90)
- **Line style** - style of all projection lines
### Alerts
- **Alert on new gap** - notification when new gap is confirmed
---
## Features and Advantages
✅ **Inter-market analysis** - uses correlation between DXY and traded asset
✅ **Automatic filtering** - excludes insignificant and quickly closing gaps
✅ **Multi-timeframe analysis** - combines signals from different time periods
✅ **Visual hierarchy** - heatmap automatically highlights most significant levels
✅ **Lifecycle tracking** - each level is monitored until touch or gap closure
✅ **Universality** - works on any dollar-correlated assets
✅ **Non-repainting** - all levels are fixed historically and don't change
✅ **Customizable visualization** - full control over colors, styles and transparency
---
## Limitations and Important Notes
⚠️ **Indicator is not a trading system** - it's a technical analysis tool requiring confirmation by other methods
⚠️ **Works only on assets correlated with DXY** - on instruments without dollar correlation, signals will be ineffective
⚠️ **Requires understanding of inter-market relationships** - recommended to study correlations between DXY and your instrument
⚠️ **DXY data quality** - ensure your data provider supplies correct TVC:DXY history
⚠️ **MTF data** - when using very low MTF timeframes, delays in updates are possible
---
## Who This Indicator Is For
👨💼 **Forex traders** - analyzing macroeconomic dollar movements
📈 **Crypto traders** - considering dollar influence on Bitcoin and altcoins
🥇 **Commodity market traders** - trading gold, silver, oil
📊 **Intraday scalpers** - using MTF for precise entries
📉 **Swing traders** - looking for medium-term entry points at key levels
---
## Disclaimer
This indicator is intended solely for educational and informational purposes. It is not financial advice or a recommendation to act. All trading decisions you make at your own risk. Past results do not guarantee future performance. Always use proper risk management.
