ADD 2This is a modification to the original ADD script by Tom1trader
I added the option to choose the timeframe, moving average type and length.
Note from the original script:
"This is the NYSE Advancers - decliners which the SPX pretty much follows. You can chart it like any index (ADD -NYSE $ADV MINUS $DECL) but I find it more useful in a separate panel with colors for direction.
The level gives an idea of days move (example: plus or minus 500 is not much movement through the session) but I follow the direction as when more stocks advance (green) or decline (red) the index tends to track it pretty closely.
On SPX , SPY and correlates - very useful for intra-day trading (Scalping or 0DTE option trades) but not for higher time frames at all. If you chart the ADD in a chart and compare 5 minute to daily you will see what I mean."
Search in scripts for "spx"

RSI with Keltner Channel (+EMA Ribbon)Note that the EMA Ribbon is not embedded into the custom RSI with KC. In the future I plan to embed it. The EMA Ribbon I use is the following:
This is my very first attempt at modifying an indicator. I basically attempted to add a Keltner Channel around RSI.
This was used as an alternative channel to the standard Bollinger Band. KC goes hand-in-hand with the EMA Ribbon. KC also helps to better pinpoint relative-overbought/oversold conditions.
In my belief, the 20-80 levels don't behave as overbought/oversold levels. An exponential chart would always be overbought. So a Keltner Channel could in theory (and in practice) give us greater understanding on chart analysis.
This custom indicator is a bodge . It has lots of extra calculations that can be removed. I post this rough indicator for the community to give feedback on how I can improve it, or perhaps give an idea to some of you. Please don't judge me, I wouldn't post it but lately some have asked me about it.
In the future I would like to embed an EMA ribbon in this RSI indicator, just like I did in the following idea.
During this period, I don't really have the time to fix this indicator to my standards. So I will leave it as is for the foreseeable future.
If you have the will and knowledge however, feel free to built upon this indicator and share it!
Tread lightly, for this is hallowed ground.
-Father Grigori
PS. In this indicator, I would replace all the moving averages with an EMA Ribbon "average".

Correlation prix [SP500, TESLA, BTCBefore you see this post I want to thank all the TradingView team. Every day that passes I learn better and better to use Pine script and I owe this to all those who publish and to the philosophy of TradingView. Thanks from Amos
This trading indicator compares the prices of the S&P 500 Index (SP500), Tesla (TSLA), and Bitcoin (BTC) to find correlations between them. To make the prices of SP500 and Tesla comparable to the price of Bitcoin, the indicator multiplies the closing price of Tesla by 114 and the closing price of the S&P 500 Index by 5.6.
In this way we can superimpose the prices on the BTC chart and see what happens.
Average BTC price/ tesla price = 114, so if we multiply the tesla price by 114 times we can superimpose it on the BTC price
At average BTC/SPX price = 5.6, also in this case we multiply the price of SPX by 5.6 to overlay the graph and see any correlations.
The indicator then calculates the average price between SP500 and Tesla, using the formula (SP500 + Tesla) / 2. This calculation creates a new line on the chart that represents the average price between these two assets.
The BTC_SP_TE variable is then calculated as the average of the closing price of Bitcoin and the previously calculated average price of SP500 and Tesla, using the formula (Btc + SP_TE) / 2. This calculation creates another line on the chart that represents the average price between Bitcoin and the previously calculated average between SP500 and Tesla.
The idea behind calculating these averages is to find correlations and patterns between the prices of these assets, which can help identify potential trading opportunities. By comparing the average prices of different assets, the trader can look for trends and patterns that might not be apparent when looking at each asset individually.
The indicator plots these prices on a chart and fills the area between them with either green or fuchsia, depending on which one is higher. The strategy suggests buying Bitcoin when the average price of SP500 and Tesla is higher than the current price of Bitcoin, and selling when it is lower.
To add visual cues to the trading strategy, the indicator uses the plotchar function to display a small triangle below the chart when it detects a potential buying opportunity. This is done with the following parameters:
Value: BTC_SP_TE < Btc and Btc > Btc1 and Btc1 > Btc , which is a logical expression that checks whether the average price of SP500 and Tesla is less than the current price of Bitcoin (BTC_SP_TE < Btc), and whether the current price of Bitcoin is higher than the price 10 bars ago (Btc > Btc1 ) and higher than the price on the previous bar (Btc1 > Btc ).
Text: "Moyen BTC_SP_Te", which is the text to display inside the marker.
Symbol: "▲", which is the symbol to use for the marker. In this case, it is a small triangle pointing upwards.
Location: location.belowbar, which specifies that the marker should be placed below the bar.
I hope this is an example of how to create an indicator on TradingView, remember that correlations do not always last, it is possible that when you see the graph this correspondence no longer exists, do your studies and get inspired.

Fair Value Strategy - ekmllThis is a strategy using SPX's Fair Value derived from Net Liquidity.
The main difference between this one and calebsandfort's one is net liquidity values in this one are calculated in TradingView and doesn't need author's daily library updates to function.
Net Liquidity function is simply: Fed Balance Sheet - Treasury General Account - Reverse Repo Balance
Formula for calculating the fair value of and Index using Net Liquidity looks like this: (WALCL - WTREGEN - RRPONTSYD)/1000000000/scalar - subtractor
The Index Fair Value is then subtracted from the Index value which creates an oscillating diff value.
When diff is greater than the overbought threshold, Index is considered overbought and we go short/sell.
When diff is less than the oversold signal, Index is considered oversold and we cover/buy.
Parameters:
Index: SPX, NDX, RUT
Strategy: Short Only, Long Only, Long/Short
Inverse (bool): check if using an inverse ETF to go long instead of short.
Scalar (float)
Subtractor (int)
Overbought Threshold (int)
Oversold Threshold (int)
Start After Date: When the strategy should start trading
Close Date: Day to close open trades. I just like it to get complete results rather than the strategy ending with open trades.
I've optimized the parameters for SPX.

QQQ Fair Value BandsThis is similar to the SPX Fair Value Bands indicator, but for QQQ.
It is based on the Net Liquidity model:
Net Liquidity = FED - RRP - TGA

RSI Multi Symbol/Time Frame DetectorThis code is an implementation of the Relative Strength Index (RSI) indicator, which is a popular momentum indicator used in technical analysis. The RSI measures the strength of an asset's price action and provides information on whether the asset is overbought or oversold. The code also calculates a moving average of the RSI and allows the user to choose the type of moving average to be calculated (SMA, EMA, SMMA, WMA, or VWMA).
The user can select from different time frames (5, 15, 60, or 240), symbols (SP:SPX, OANDA:EURUSD, or OANDA:NZDUSD), RSI lengths, and moving average types and lengths.
The code starts by defining a function called "ma" for calculating different types of moving averages. This function takes as input the source data for the moving average calculation (the RSI), the length of the moving average, and the type of moving average. The function uses a switch statement to return the appropriate calculation based on the inputted moving average type.
Next, the code calculates the RSI and its moving average. The RSI is calculated using the well-known formula for the RSI, which involves calculating the average gains and losses over a specified period of time and then dividing the average gains by the average losses. The moving average is calculated using the "ma" function defined earlier.
Finally, the code allows the user to choose the symbol and time frame to be used in the RSI calculation, as well as the length of the RSI and the moving average, and the type of moving average. The user can choose from three symbols (SP:SPX, OANDA:EURUSD, OANDA:NZDUSD) and four time frames (5, 15, 60, and 240 minutes). The code then uses the "request.security" function to retrieve the RSI calculation for the selected symbol and time frame.
Note: This code is example for you to use multi timeframe/symbol in your indicator or Strategy , also prevent Repainting Calculation

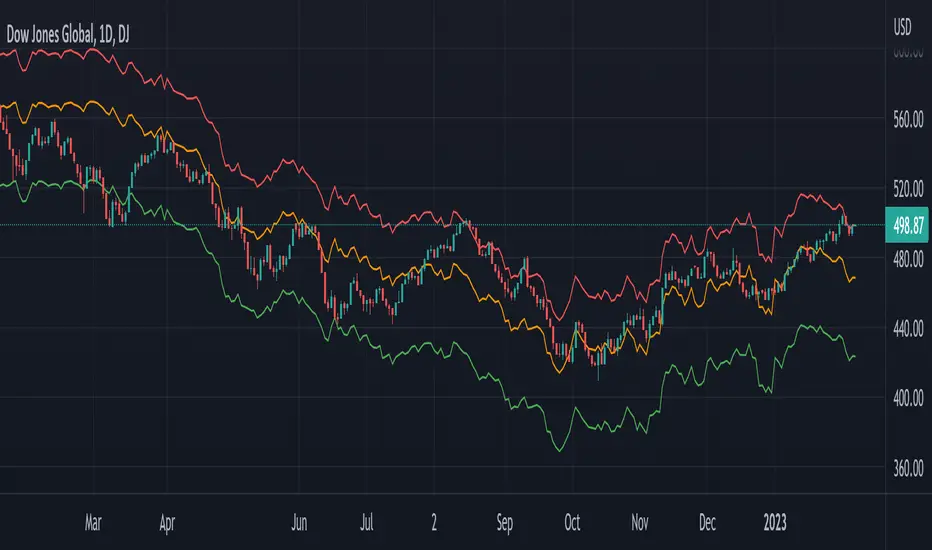
Global Net Liquidity - Dow Jones Global Fair ValueThis is similar to Global Net Liquidity - SPX Fair Value except it's for Dow Jones Global (symbol: W1DOW here on TradingView).
This is experimental and may change at any time.
Cash VIX Term StructureLet’s first start with some definitions:
VIX9D: The CBOE S&P 500 9-Day Volatility Index estimates the expected 9-day volatility of S&P 500® stock returns.
www.cboe.com
VIX: The CBOE Volatility Index® (VIX® ) is considered by many to be the world's premier barometer of equity market volatility. The VIX Index is based on real-time prices of options on the S&P 500® Index (SPX) and is designed to reflect investors' consensus view of future (30-day) expected stock market volatility. The VIX Index is often referred to as the market's "fear gauge".
www.cboe.com
VIX3M: The CBOE 3-Month Volatility Index is designed to be a constant measure of 3-month implied volatility of the S&P 500® (SPX) Index options.
www.cboe.com
VIX6M: The CBOE S&P 500 6-Month Volatility Index is an estimate of the expected 6-month volatility of the S&P 500® Index.
www.cboe.com
VIX1Y: The CBOE S&P 500 1-Year Volatility Index is an estimate of the expected 1-Yeaer volatility of the S&P 500® Index.
www.cboe.com
This indicator visually displays the relationship between all the above products (short term vol vs long term vol). It also displays the current value and daily percentage change.
The shape of the term structure can tell us a lot about the market:
When the slope of the term structure is upward sloping (longer term VIX are higher than shorter term VIX), we say the term structure is in contango. This usually means that market is stable.
When the slope of the term structure is downward sloping (longer term VIX are lower than shorter term VIX), we say the term structure is in backwardation. This usually happens in periods of extreme market volatility.
Sometimes VIX9D will be higher than VIX but the rest of the curve is in contango. This means that there might be some event in the next 9 days that we need to pay attention to.
I also added a few ratios that I personally track like VIX9D/VIX, VIX/VIX3M and VIX/VIX6M.
When trading short term, I tend to focus on the front end of the curve. When trading long term, I tend to look at VIX/VIX6M.
In addition to the ratios, I added some historical parameters (lookback date can be set from the indicator’s settings) like Highest Value, Lowest Value, Percentile Rank, Average, Median and Mode.
Percentile ranks are displayed for both individual products and their ratios (that’s how I like to see them).
I hope you guys like this indicator.
Happy trading!

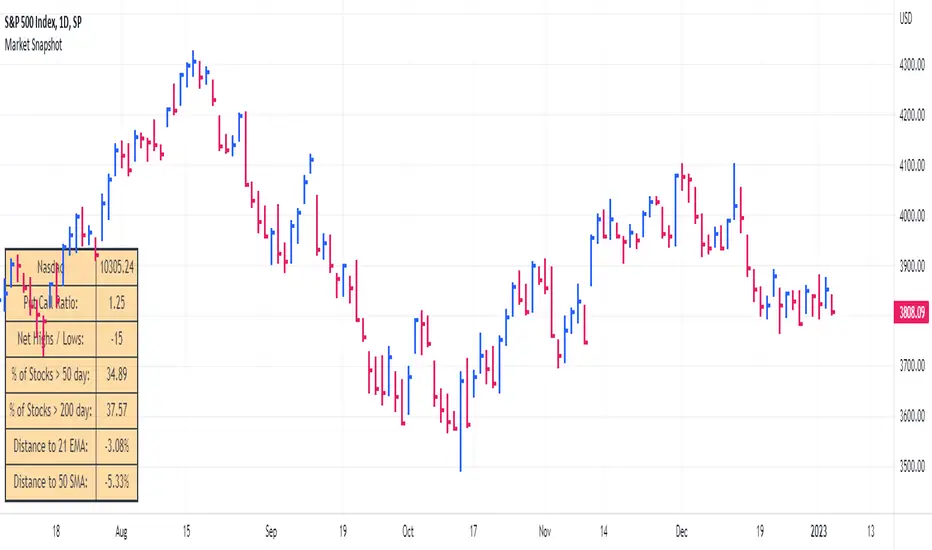
Market SnapshotGet a snapshot of the market with the index's last price, distance to selectable moving averages, and breadth data.
Choose to see data based on the Nasdaq or SPX, as well as net highs / lows for the Nasdaq, NYSE or combined.
Snapshot shows:
- Index's (SPX or Nasdaq's) last price
- Put call ratio
- % of stocks above the 50 day moving average for the index of your choice
- % of stocks above the 200 day moving average for the index of your choice
- Distance to or from two selectable moving averages. (negative number means price is below the moving average, positive means price is above)
Configurable options:
- Which moving averages to use
- Where to display the table on your chart
- Table size, background and text colors
Markets vs Inflation [x7.am]Markets vs Inflation(CPI US) also known as Inflation-Adjusted Return.
The inflation-adjusted return is the measure of return that takes into account the time period's inflation rate. The purpose of the inflation-adjusted return metric is to reveal the return on an investment after removing the effects of inflation.
Removing the effects of inflation from the return of an investment allows the investor to see the true earning potential of the security without external economic forces. The inflation-adjusted return is also known as the real rate of return or required rate of return adjusted for inflation. It is a more accurate measure of investment performance than the nominal rate of return.
The inflation-adjusted return accounts for the effect of inflation on an investment's performance over time.
Also known as the real return, the inflation-adjusted return provides a more realistic comparison of an investment's performance.
Inflation will lower the size of a positive return and increase the magnitude of a loss.
Assume you have saved $10,000 to buy a car but decide to invest the money for a year before buying to ensure that you have a small cash cushion left over after getting the car. Earning 5% interest, you have $10,500 after 12 months. However, because prices increased by 3% during the same period due to inflation, the same car now costs $10,300.
Consequently, the amount of money that remains after you buy the car—which represents your increase in purchasing power—is $200, or 2% of your initial investment. This is your real rate of return, as it represents the amount that you gained after accounting for the effects of inflation.
Markets vs Inflation indicators use in 1 months interval
SP:SPX , INDEX:BTCUSD , TVC:GOLD , TVC:DJI

(CD|RS) Caruso Divergence Relative StrengthCaruso Divergence Relative Strength (CD|RS) helps an investor to identify when a security does not make a lower low vs a benchmark. The standard application is to compare a stock to the S&P 500 (SPX). If the SPX makes a lower low and the stock does not, it displays significant Relative Strength.
This indicator allows you to select both your benchmark for comparing against as well as how far back to make the analysis by selecting the pivot lookback (how many prior ‘pivots’ or ‘market lows’ back to compare against).
Divergences can appear when markets are weak, and they make lower lows, but they can also appear in uptrends as stocks and indexes make higher highs. CD|RS also identifies when RS takes place “On Strength.” If the security and its benchmark both decline but the security can make new highs above its prior peak before the benchmark, it is once again displaying relative strength. Therefore CD|RS is helpful in finding Divergence Relative Strength in both up and down trends.
CD|RS works on any timeframe.
CD|RS has an accompanying indicator called CD|RS Signal which helps display the divergence in a different format and can be placed in a separate pane if the user wishes to keep the price chart clean.

[TTI] Ned Davis 3 day Price Thrust IndicatorThe NedDavis 3 Day Price Thrust Indicator
HISTORY AND CREDITS –––––––––––––––––––––––––––––––––––––––––––––––––––––––
The indicator is inspired by studies from Ned Davis' NDR Institutional Service. I have shared before the backtest of this indicator, and now have coded it for TradingView so that you can have it on your charts.
Link to idea here:
WHAT IT DOES ––––––––––––––––––––––––––––––––––––––––––––––––––––––––––––––
Thrusts occur when the S&P 500 rises at least 1.5% for one day, at least 1.15% for a second day, and at least 1.5% on the third day. The record since 1970 is perfect one year later. However, the prior 18 cases, ending in 1938, only show 11 out of 18 profitable one year later.
HOW TO USE IT –––––––––––––––––––––––––––––––––––––––––––––––––––––––––––––
I use the indicator as a gauge tool, in other words it is a piece of the puzzle to justify bullish or bearish trades. I put this type of analysis in my secondary tools that give me additional confidence for market direction and aggressiveness in my trading

Newzage - Fed Net LiquidityThe Fed Net Liquidity indicator is a concept discovered by Max Anderson to calculate the fair value of SPX (S&P 500 Index).
The formula he shared on Twitter uses the Fed Balance Sheet, TGA (Treasury General Account), and Reverse Repo.
Net Liquidity = Fed Balance Sheet - (TGA + Reverse Repo)
The data for each component above is accessible on the FRED website.
Fed Balance Sheet fred.stlouisfed.org
Treasury General Account (TGA) fred.stlouisfed.org
Reverse Repo fred.stlouisfed.org
This script uses net liquidity (NL) fair value calculation for SPX, then estimates entry and next target exit target for both long and short trades on SPY.
The script added RSI oversold/overbought signal to the original NL signal from Max... improving the "precision" of the buy/sell signals.
The script also uses RSI to estimate targets based on how overbought or oversold the index/SPY is.

Williams Vix Fix ultra complete indicator (Tartigradia)Williams VixFix is a realized volatility indicator developed by Larry Williams, and can help in finding market bottoms.
Indeed, as Williams describe in his paper, markets tend to find the lowest prices during times of highest volatility, which usually accompany times of highest fear. The VixFix is calculated as how much the current low price statistically deviates from the maximum within a given look-back period.
Although the VixFix originally only indicates market bottoms, its inverse may indicate market tops. As masa_crypto writes : "The inverse can be formulated by considering "how much the current high value statistically deviates from the minimum within a given look-back period." This transformation equates Vix_Fix_inverse. This indicator can be used for finding market tops, and therefore, is a good signal for a timing for taking a short position." However, in practice, the Inverse VixFix is much less reliable than the classical VixFix, but is nevertheless a good addition to get some additional context.
For more information on the Vix Fix, which is a strategy published under public domain:
* The VIX Fix, Larry Williams, Active Trader magazine, December 2007, web.archive.org
* Fixing the VIX: An Indicator to Beat Fear, Amber Hestla-Barnhart, Journal of Technical Analysis, March 13, 2015, ssrn.com
* Replicating the CBOE VIX using a synthetic volatility index trading algorithm, Dayne Cary and Gary van Vuuren, Cogent Economics & Finance, Volume 7, 2019, Issue 1, doi.org
Created By ChrisMoody on 12-26-2014...
V3 MAJOR Update on 1-05-2014
tista merged LazyBear's Black Dots filter in 2020:
Extended by Tartigradia in 10-2022:
* Can select a symbol different from current to calculate vixfix, allows to select SP:SPX to mimic the original VIX index.
* Inverse VixFix (from masa_crypto and web.archive.org)
* VixFix OHLC Bars plot
* Price / VixFix Candles plot (Pro Tip: draw trend lines to find good entry/exit points)
* Add ADX filtering, Minimaxis signals, Minimaxis filtering (from samgozman )
* Convert to pinescript v5
* Allow timeframe selection (MTF)
* Skip off days (more accurate reproduction of original VIX)
* Reorganized, cleaned up code, commented out parts, commented out or removed unused code (eg, some of the KC calculations)
* Changed default Bollinger Band settings to reduce false positives in crypto markets.
Set Index symbol to SPX, and index_current = false, and timeframe Weekly, to reproduce the original VIX as close as possible by the VIXFIX (use the Add Symbol option, because you want to plot CBOE:VIX on the same timeframe as the current chart, which may include extended session / weekends). With the Weekly timeframe, off days / extended session days should not change much, but with lower timeframes this is important, because nights and weekends can change how the graph appears and seemingly make them different because of timing misalignment when in reality they are not when properly aligned.

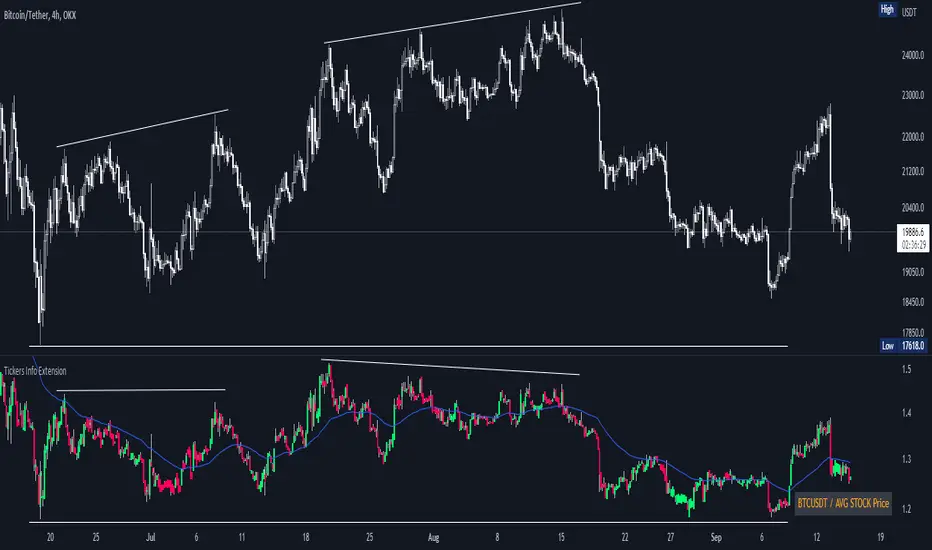
Tickers Info ExtensionWith the indicator you can easily evaluate or compare any ticker with the one you choose in the options.
You can choose any of the tickers I provide in the mod options to your liking :
XAU
DXY
BTC
ETH
SPX
NASDAQ
AVG Stable Dominance
AVG Stock Price
Custom
You can also select or create your own ticker if you select the Custom in Mode option.
If the Compare mode is enabled, then the current ticker you are viewing is divided by the ticker selected in the indicator (in the Mode option).
Thus, you create a new pair and can evaluate the strength of this or that asset.
For example, if you have the ticker BTCUSDT open. And the ticker XAU is selected in the Mode option in the indicator. And the Compare mode is also enabled. Then you will get a new BTCUSDT/XAU pair. That means that now you can see the bitcoin/gold ratio. (Same as EUR/USD etc.)
If the Compare option is switched off then you will see the usual ticker you choose in the Mode option. You can also see if there is a correlation between the selected pairs.
Option ' AVG STABLE.D ' = Calculated as: USDT.D + USDC.D + DAI.D
- This is the average domination of the most important Stable Coins
Option ' AVG STOCK Price ' = Calculated as: (DJI + SPX + NDQ) / 3
- This is the average price of the most important Indexes.
Auto Fibonacci Levels + Auto Trend Line generatorAnother indicator for you guys!!!
This indicator consists of the 5 key Fibonacci retracement levels, plotted automatically to user input settings. I also have included an auto support/resistance trend line generator.
What is a Fibonacci retracement?
'Fibonacci retracement is a method of technical analysis for determining support and resistance levels. It is named after the Fibonacci sequence of numbers, whose ratios provide price levels to which markets tend to retrace a portion of a move before a trend continues in the original direction.' - Wikipedia
How to use the Fibonacci retracement?
- The Fibonacci levels are default. These percentiles from price to the average of the high in a sample and low in a sample give you a guideline of where a bottom may be, where a top may be, and where a range is being created.
- Look for the price to reject from 61.8% and 76.4%, and also look for price to bounce from 38.2% and 23.6%. If a lower low/higher high is made, the fib levels will follow and the percentiles within will be recalculated after a 5 candle offset period.
- If you see price trending towards the lower percentiles (38&23) and using the 50% as resistance, look for a break downwards and vice versa.
-This Fibonacci set as all others is subject to fake-out, always use this with another series indicator, or don't use it as a signal for entry at all (unless you have a backdated strategy)
How to use the trend line generator?
-The trend line generator will only plot when a lower low/higher high has taken place within the input amount of candles. It is also offset by a user amount.
-The check box will give the option to have the trend line's plot or not.
- If you see a green/red dot it means that that will be your first coordinate for the trend line, and until the computations are complete it will give you an idea of which direction it will be in (resistance or support)
-When opening this indicator zoom out all the way to connect any trend lines that do not load automatically.
Let me know if you have any questions, suggestions or issues! Thank you everyone!
-Cheatcode1 :)
SP:SPX TVC:DXY BMFBOVESPA:EUR1! CME:BTC1! BINANCE:BTCUSDT

Rate Of Change Trend Strategy (ROC)This is very simple trend following or momentum strategy. If the price change over the past number of bars is positive, we buy. If the price change over the past number of bars is negative, we sell. This is surprisingly robust, simple, and effective especially on trendy markets such as cryptos.
Works for many markets such as:
INDEX:BTCUSD
INDEX:ETHUSD
SP:SPX
NASDAQ:NDX
NASDAQ:TSLA

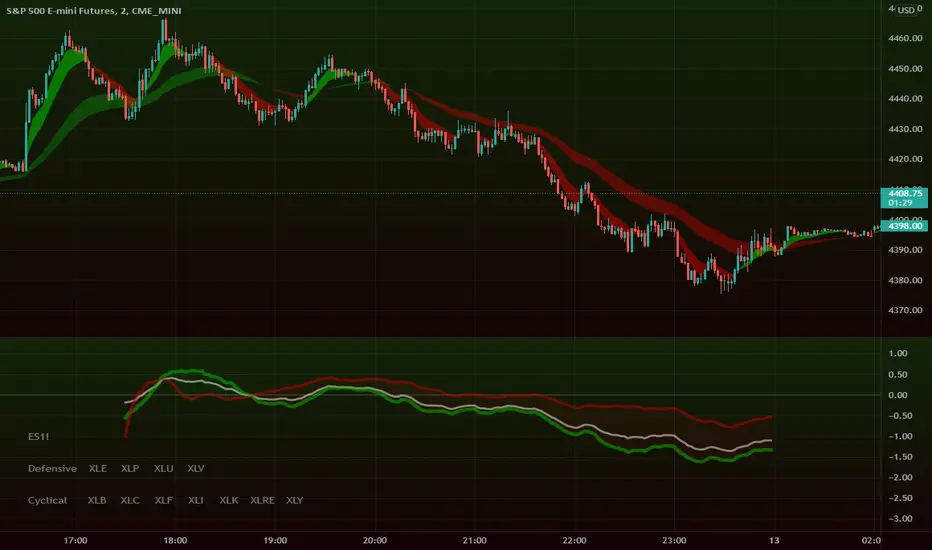
Intraday Super SectorsMotivated by Cody to finish what I'd started ...
This indicator plots the two 'Super Sectors' (Cyclical and Defensive) intraday change, viz-a-viz SPX price
* for convenience, it uses the ETF's, rather than the actual sectors. This might make it 0.0001% inaccurate.
For reference:
Defensive Sectors:
XLE Energy (not always considered a true defensive sector, but I've thrown it in here for balance)
XLP Consumer Staples
XLU Utilities
XLV Health Care
Cyclical Sectors:
XLB Materials
XLC Communication Services
XLF Financials
XLI Industrials
XLK Information Technology
XLRE Real Estate
XLY Consumer Discretionary
Why the (soft) red/green cloud?
Well, the theory says is that if the Cyclical Sector is down, while the Defensive Sector is up, this isn't exactly bullish (so a soft red cloud), or if Defensive Stocks are down, while Cyclical Stocks are up, this is perhaps bullish.
Of course, if SPX is down 10%, with Defensive Stocks down 20%, and Cyclical Stocks down 5%, you might get a green cloud, but it ain't exactly a bullish sign
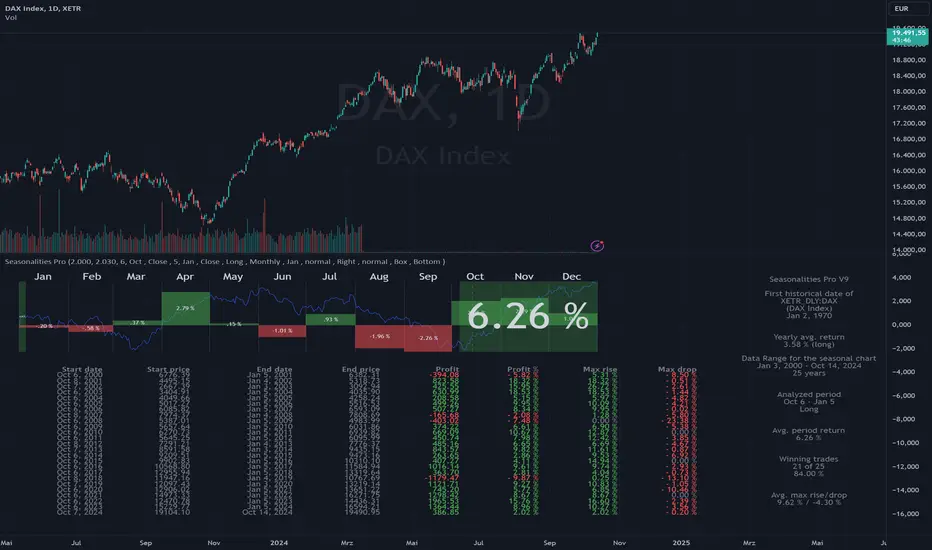
Seasonalities ProSeasonalities Pro indicator for TradingView - identify, evaluate and exploit seasonal patterns
Identification of seasonal investment opportunities
Easy to use without prior knowledge with just a few clicks
Statistical evaluation over an adjustable data basis (5 to 40 years)
Period to be considered also across year boundaries
Applicable to all instruments/symbols (indices, stocks, commodities, currencies, cryptos) that TradingView provides
Best price/performance ratio
Differences between Lite and Pro
Pro: Evaluation of all symbols available at TradingView up to 40 years in the past.
Lite: Like Pro, but only "DAX", "SPX" and "NDX" up to 40 years in the past, all other symbols 5 years.
Der Seasonalities Pro Indikator für TradingView – saisonale Muster erkennen, auswerten und nutzen
Identifizierung von saisonalen Investmentmöglichkeiten
Einfache Anwendung ohne Vorkenntnisse mit wenigen Klicks
Statistische Auswertung über eine einstellbare Datenbasis (5 bis 40 Jahre)
Zu betrachtende Periode auch über die Jahresgrenze hinweg
Anwendbar auf alle Instrumente/Symbole (Indizes, Aktien, Rohstoffe, Währungen, Cryptos) die TradingView zur Verfügung stellt
Bestes Preis-/Leistungsverhältnis
Unterschiede zwischen Lite und Pro
Pro: Auswertung aller bei TradingView verfügbaren Symbole bis zu 40 Jahre in die Vergangenheit
Lite: Wie Pro, jedoch nur "DAX", "SPX" und "NDX" bis zu 40 Jahre in die Vergangenheit, alle anderen Symbole 5 Jahre.
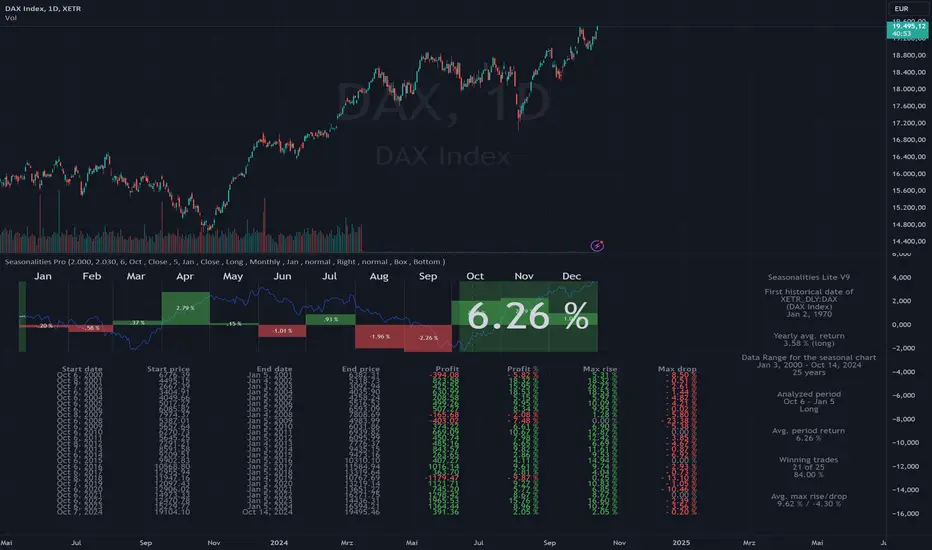
Seasonalities LiteSeasonalities Pro indicator for TradingView - identify, evaluate and exploit seasonal patterns
Identification of seasonal investment opportunities
Easy to use without prior knowledge with just a few clicks
Statistical evaluation over an adjustable data basis (5 to 40 years)
Period to be considered also across year boundaries
Applicable to all instruments/symbols (indices, stocks, commodities, currencies, cryptos) that TradingView provides
Best price/performance ratio
Differences between Lite and Pro
Pro: Evaluation of all symbols available at TradingView up to 40 years in the past.
Lite: Like Pro, but only "DAX", "SPX" and "NDX" up to 40 years in the past, all other symbols 5 years.
Der Seasonalities Pro Indikator für TradingView – saisonale Muster erkennen, auswerten und nutzen
Identifizierung von saisonalen Investmentmöglichkeiten
Einfache Anwendung ohne Vorkenntnisse mit wenigen Klicks
Statistische Auswertung über eine einstellbare Datenbasis (5 bis 40 Jahre)
Zu betrachtende Periode auch über die Jahresgrenze hinweg
Anwendbar auf alle Instrumente/Symbole (Indizes, Aktien, Rohstoffe, Währungen, Cryptos) die TradingView zur Verfügung stellt
Bestes Preis-/Leistungsverhältnis
Unterschiede zwischen Lite und Pro
Pro: Auswertung aller bei TradingView verfügbaren Symbole bis zu 40 Jahre in die Vergangenheit
Lite: Wie Pro, jedoch nur "DAX", "SPX" und "NDX" bis zu 40 Jahre in die Vergangenheit, alle anderen Symbole 5 Jahre.
Institutional Behavior AnalyticsJapanese below / 日本語説明は下記
■Summary
This indicator provides analysis on institutional investors/traders’ behavior by discovering and interpreting patterns of CFTC positions and price action in order to help users follow market directions that maker makers create and make decisions.
■What can we do with this indicator?
●Display institutional investors/traders’ position(CFTC COT position)
●Analyze institutional investors/traders’ behavior
Analyze institutional investors’ behavior from CFTC position data and price action and patternize the movement where strong buying/selling pressures are indicated
●Notify institutional investors’ behavioral changes with signals and alerts
In case strong buying/selling pressures detected, signals will be displayed along with the factors by which the behavioral changes identified. Alerts can be set with the same condition as signals.
■Why is it important to analyze institutional investors/traders behavior?
Financial markets are created by institutional investors/traders aka market makers. Analyzing their behavior and knowing where they are heading are chances for retail traders for trend trading.
■Functions
There is three core functions in this indicator.
1. CFTC COT Positions
2. Institutional Behavior Analysis
3. Alert
■Function Details:
1. CFTC COT Positions
1-1. CFTC COT Position
This indicator shows COT(Commitment of Traders) positions provided by CFTC with selection of legacy format and new format.
Users also can select position type from Futures only and Futures and Options.
Data source is quandle.com
The indicator shows the data of the assets listed below based on the code and the ticker code of which users open charts.
This is upgrade functions of CFTC Positions by COT Report(Legacy and New Format) Indicator which I previously released by adding more assets and new functions; (1)manual CFTC code entry, (2)display of changes from previous week and (3) Auto-identification of peak position level (see below)
CFTC Positions by COT Report(Legacy and New Format)
Indices:
Dow Jones Industrial Average / CFTC code:12460P / when DJI/US30 open
S&P 500 STOCK INDEX / CFTC code:13874P / when SPX / SPX500USD /US500 open
NASDAQ-100 STOCK INDEX / CFTC code:20974P / when NDX/US100 open
E-MINI Russel2000 INDEX / CFTC code:239742 / when RUT/US2000 open
NIKKEI STOCK AVERAGE / CFTC code:240741 / when NI225 / JP225USD open
Currencies:
EURO / CFTC code:099741 / when EURUSD open
Japanese Yen / CFTC code:097741 / when USDJPY open
British Pound / CFTC code:096742 / when GBPUSD or EURGBP open
Australian Dollars / CFTC code:232741 / when AUDUSD open
New Zealand Dollars / CFTC code:112741 / when NZDUSD open
Canadian Dollars / CFTC code:090741 / when USDCAD open
Swiss Franc / CFTC code:092741 / when USDCHF open
Commodities:
USOIL / CFTC code:067411 / when USOIL open
Brent oil / CFTC code:06765T / when UKOIL open
GOLD / CFTC code:088691 / when GOLD or XAUUSD open
Silver / CFTC code:084691 / when SILVER or XAGUSD open
Platinum / CFTC code:076651 / when PLATINUM or XPTUSD open
Palladium / CFTC code:075651 / when PALLADIUM or XPDUSD open
Copper(Grade#1) / CFTC code:085692 / HG1! or HG2! Open
Natural Gas(Henry Hub) / CFTC code:023391 / when NATURALGAS open)
Corn / CFTC code:002602 / ZC1! Or ZC2! Open
Cryptos:
Bitcoin / CFTC code:133741 / when BTCUSD open
Ether / CFTC code:146021 / when ETHUSD open
Data to be displayed:
Legacy format:
1. Open Interest
2. Non Commercial Long
3. Non Commercial Short
4. Non Commercial Net Positions (calculated by 2 and 3)
5. Non Commercial Spreads
6. Commercial Long
7. Commercial Short
8. Commercial Net Positions(calculated by 6 and 7)
9. Total Long
10. Total Short
11. Non Reportable Positions Long
12. Non Reportable Positions Short
13. Non Reportable Net Positions(calculated by 11 and 12)
New format:
1. Open Interest
2. Producer/Merchant/Processor/User Longs
3. Producer/Merchant/Processor/User Shorts
4. Producer/Merchant/Processor/User Net Positions(calculated by 2 and 3)
5. Swap Dealer Longs
6. Swap Dealer Shorts
7. Swap Dealer Net Positions(calculated by 5 and 6)
8. Swap Dealer Spreads
9. Money Manager Longs
10. Money Manager Shorts
11. Money Manager Net Positions(calculated by 9 and 10)
12. Money Manager Spreads
13. Other Reportable Longs
14. Other Reportable Shorts
15. Other Reportable Net Positions(calculated by 13 and 14)
16. Other Reportable Spreads
17. Total Reportable Longs
18. Total Reportable Shorts
19. Non Reportable Longs
20. Non Reportable Shorts
21. Non Reportable Net Positions(calculated by 19 and 20)
Sample chart
Colors and chart type are configurable.
❶.Non commercial long(green)/short(purple)/net(blue) position
❷.All data in legacy format
❸. All net positions in new format
1-2 Manual CFTC code entry
Besides the assets above, users now can enter CFTC code manually when they want to specify CFTC code regardless of charts they are opening and see other assets' COT position data.
1-3 Changes from previous week
Changes from previous week are displayed as text for Open interest, Non Commercial Long/Short/Net positions.
1-4 Auto-identification of peak position level in past N week
By specifying number of weeks(=N), the indicator automatically identify highest position level in the past N weeks for Non-commercial long and short positions.
By knowing this, users can prepare for trend reversal possibilities.
Sample chart
2. Institutional Behavior Analysis
This indicator detects institutional behavior changes based on changes of positions and price action and then categorizes them into patterns where strong buying/selling pressures of institutional investors are indicated.
Once the patterns identified, those will be displayed as signals and also it plots the factors in text by which the patterns are identified in order to support users’ decision making.
Sample chart
What makes indicator suggest institutional investors’ strong buy/sell will be remarked in the bottom right corner.
Please be noted that this function works on weekly timeframe only as institutional investors positions are updated on weekly basis by CFTC.
3. Alert
Alerts can be set with the same condition as signals so that users do not miss indicated strong buying/selling pressure of institutional investors.
■What timeframe/trading style is this indicator for?
As CFTC position updated on weekly basis, weekly, daily and 4H timeframes are most appropriate hence swing trading and day trading is best fitting trading style.
Scalping? Possible but why would we aim such small movement, knowing the directions that institutional investors are going to which could lead to big trends.
---------------------------------------------------
■サマリー
機関投資家の建玉とプライスアクションに基づいて機関投資家の行動分析を提供するインジケーターです。
機関投資家の強い買い圧力、売り圧力が示唆されるケースをその構成要素と共にパターン分類。
マーケットメーカーの作り出す相場の方向性に追従しやすくなるように、ユーザーの意思決定を支援します。
■このインジケーターでできること
●CFTC建玉の分析
CFTC(アメリカ商品先物取引委員会)が公開するCOT(Commitment of Traders)レポートに基づき機関投資家や商業筋の建玉データを分析することができます。
●機関投資家の行動分析
建玉データと値動きから機関投資家の行動を分析することが可能です。
インジケーターは建玉データとプライスアクションを基に機関投資家の強い買い圧力、売り圧力が示唆されるケースをその構成要素と共にパターン分類します。
●機関投資家の行動変化をシグナルとアラートで通知
機関投資家の強い買い圧力、売り圧力が検知された場合、その構成要素と共にシグナルを表示します。またシグナル表示のタイミングでアラート設定することも可能です。
■なぜ機関投資家の建玉や行動を分析することが重要なのか?
相場はマーケットメーカーと呼ばれる機関投資家によって作られています。
彼らのポジション状況や行動を分析し、彼らがどの方向に進んでいるのかを知ることは、個人投資家にとってトレンドフォローでトレードする機会、特に大きなトレンドに乗る機会を見出すことに繋がります。
機能
このインジケーターには主に3つの機能が搭載されています。
1. CFTC建玉データの表示
2. 機関投資家の行動分析
3. アラート
1. CFTC建玉データの表示
1-1. CFTC建玉データの表示
COTレポートが提供するCFTC建玉をサブウィンドウに表示することができます。
データレイアウトについては、レガシーフォーマットと新フォーマットの二つのレポートフォーマットを選択可能です。
またポジション種類として先物のみを表示するか、先物とオプションを含んだポジションを表示するかの選択も可能です。
インジケーターが表示する対象の資産と該当のCFTCコード、どのティッカーコードのチャートで表示されるかは以下の通りです。(データソースはquandle.com)
この機能は以前リリースしたCFTC Positions by COT Report(Legacy and New Format) Indicatorのアップグレードバージョン機能です。
対象データが追加されている他、新機能として(1)マニュアルでのCFTCコード指定、(2)前週比の表示、(3)過去のピークポジションのレベルライン自動描画が追加されています。
(詳細は下記)
CFTC Positions by COT Report(Legacy and New Format)
株価インデックス:
ダウ工業平均 / CFTC code:12460P / DJI/US30 を開いたとき
S&P500 / CFTC code:13874P / SPX / SPX500USD /US500
ナスダック100指数 / CFTC code:20974P / NDX/US100
E-MINI ラッセル2000指数 / CFTC code:239742 / RUT/US2000
日経平均 / CFTC code:240741 / NI225 / JP225USD
通貨:
ユーロ / CFTC code:099741 / EURUSDを開いた時
円 / CFTC code:097741 / USDJPY
ポンド / CFTC code:096742 / GBPUSD または EURGBP
豪ドル / CFTC code:232741 / AUDUSD
ニュージーランドドル / CFTC code:112741 / NZDUSD
カナダドル / CFTC code:090741 / USDCAD
スイスフラン / CFTC code:092741 / USDCHF
コモディティ:
WTI原油 / CFTC code:067411 / USOIL
北海ブレント原油 / CFTC code:06765T / UKOIL
ゴールド / CFTC code:088691 / GOLD または XAUUSD
シルバー / CFTC code:084691 / SILVER または XAGUSD
プラチナ / CFTC code:076651 / PLATINUM または XPTUSD
パラジウム / CFTC code:075651 / PALLADIUM または XPDUSD
銅(Grade#1) / CFTC code:085692 / HG1! または HG2!
天然ガス(Henry Hub) / CFTC code:023391 / NATURALGAS
コーン / CFTC code:002602 / ZC1! または ZC2!
暗号資産:
ビットコイン / CFTC code:133741 / BTCUSD
イーサ / CFTC code:146021 / ETHUSD
表示されるデータ:
レガシーフォーマット(一般的によく見るのはこのフォーマットです。)
1. Open Interest
2. Non Commercial Long
3. Non Commercial Short
4. Non Commercial Net Positions (calculated by 2 and 3)
5. Non Commercial Spreads
6. Commercial Long
7. Commercial Short
8. Commercial Net Positions (calculated by 6 and 7)
9. Total Long
10. Total Short
11. Non Reportable Positions Long
12. Non Reportable Positions Short
13. Non Reportable Net Positions(calculated by 11 and 12)
新フォーマット:
1. Open Interest
2. Producer/Merchant/Processor/User Longs
3. Producer/Merchant/Processor/User Shorts
4. Producer/Merchant/Processor/User Net Positions(calculated by 2 and 3)
5. Swap Dealer Longs
6. Swap Dealer Shorts
7. Swap Dealer Net Positions(calculated by 5 and 6)
8. Swap Dealer Spreads
9. Money Manager Longs
10. Money Manager Shorts
11. Money Manager Net Positions(calculated by 9 and 10)
12. Money Manager Spreads
13. Other Reportable Longs
14. Other Reportable Shorts
15. Other Reportable Net Positions(calculated by 13 and 14)
16. Other Reportable Spreads
17. Total Reportable Longs
18. Total Reportable Shorts
19. Non Reportable Longs
20. Non Reportable Shorts
21. Non Reportable Net Positions(calculated by 19 and 20)
サンプルチャート:
色とグラフ/線種は変更可能です。
❶.Non commercial(いわゆる投機筋)のポジション: ロング(緑)/ショート(紫)/ネット(青)
❷.レガシーフォーマットの全データ出力
❸. 新フォーマットで提供される全てのネットポジション
1-2 CFTCコードのマニュアル入力
上記のアセットに加え、任意のCFTCコードを指定して建玉データを表示することができます。
現在開いているチャートに関係なく、特定のアセットの建玉を確認したい時、他のアセットの建玉との相関を見るときに活用できます。
1-3 前週比の表示
Open Interest, Non Commercial(投機筋)のLong/Short/Netについて、前週比を表示します。
1-4. 過去N週間における建玉のピークを自動表示
過去N週間(Nはパラメータ設定)におけるNon Commercial(投機筋)のロング·ショートポジションのピークを自動で表示します。
過去の建玉のピークを知ることで、建玉が再びそのラインに接近した時のトレンド転換の可能性に備えることが可能です。
サンプルチャート
2. 機関投資家の行動分析
この機能では建玉の変化とプライスアクションから機関投資家の行動変化を検知し、機関投資家の強い買い、売りの存在が示唆されるケースをパターン分類します。
パターンが特定されたタイミングでシグナル表示するとともに、パターンを構成する要素(何を以て機関投資家の強い買い/売りの存在を判断したか)をテキストで表示することでユーザーの意思決定を支援します。
サンプルチャート
インジケーターが機関投資家の強い買い·売りの存在が示唆されると判断した要素がサブウィンドウの右下に記載されます。
この機能は週足でのみ有効です。
3. アラート
上記2のシグナルが表示されるタイミングでアラートを設定することができます。
機関投資家の強い買い·売りを検知したタイミングを逃さないよう活用してください。
■このインジケーターが適しているタイムフレーム
CFTCのポジションが週次で更新されることから、長めの時間軸である週足、日足から4時間足くらいまでが適しています。
トレードスタイルとしては、機関投資家が作る大きなトレンドに追尾するスイングトレードが最も適していると考えますが、デイトレードにも使えます。

Indice di forza relativa con benchmark S&P 500Indice di Forza Relativa che calcola il rapporto tra il prezzo del titolo scelto (grafico principale) e il prezzo dell'indice SP:SPX .

US Sector CorrelationsA new and interesting way to look at Breadth. As for the usefulness of it, one would have to do some proper backtesting to get a full grasp of the capabilities. This is just a concept currently. But in general, SPX holding near ATHs with very low sector correlations can be a topping indicator. SPX selling off with Correlations all very positive across each sector...can be a sign of an impending bottom. But, needs the "full bake" of proper testing and analysis versus just guessing. I like the concept and want to explore it further, and I will. This is just the start.
