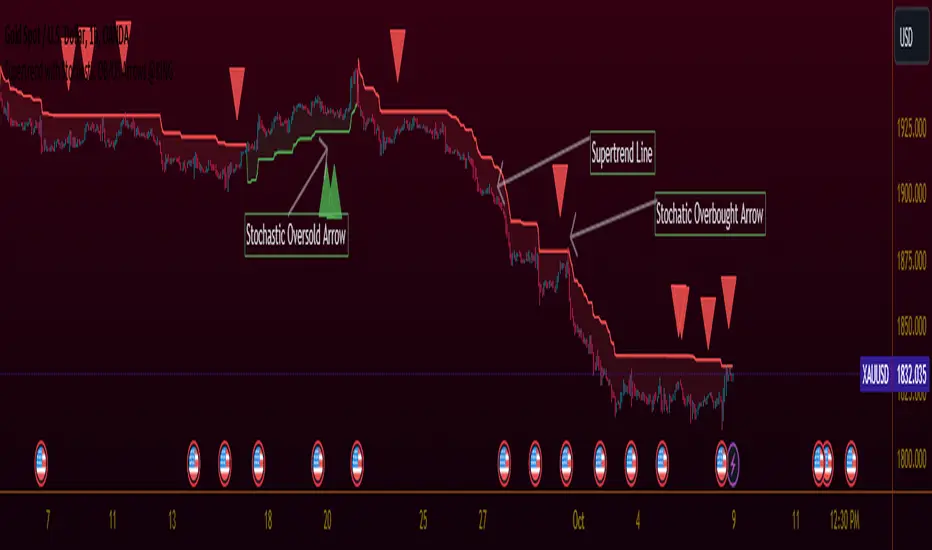
Supertrend with Stochastic OB/OS Arrows @KING
TradingView Idea: Supertrend with Stochastic Arrows @KING
Overview:
- Combining the Supertrend indicator with Stochastic arrows for a comprehensive market
view, providing insights into trend direction and potential reversal points.
Supertrend Settings:
- ATR Length: The length parameter for calculating the Average True Range (ATR).
- Factor: A multiplier used to determine the distance of the Supertrend line from the
price.
Supertrend Display:
The Supertrend is color-coded:
- During an uptrend, it is displayed in green .
- During a downtrend, it is displayed in red .
- The body of the candlesticks is filled with color during the corresponding trend direction.
Stochastic Settings:
- K Length: The period length for the %K line in the Stochastic oscillator.
- K Smoothing: Smoothing factor for %K.
- D Smoothing: Smoothing factor for %D.
- Overbought Level: The threshold indicating an overbought condition.
- Oversold Level: The threshold indicating an oversold condition.
Arrows:
- Buy arrows are displayed below the bars during a downtrend when Stochastic is below the
oversold level.
- Sell arrows are displayed above the bars during an uptrend when Stochastic is above the
overbought level.
Supertrend Display:
- The Supertrend line is plotted with a color change based on its direction.
- The body of the candlesticks is filled with green during an uptrend and red during a downtrend.
Usage:
- Traders can use this script to identify potential entry and exit points, leveraging the
insights provided by both the Supertrend indicator and Stochastic oscillator. This
combination aims to capture trend strength and potential reversal opportunities.
Search in scripts for "stoch"
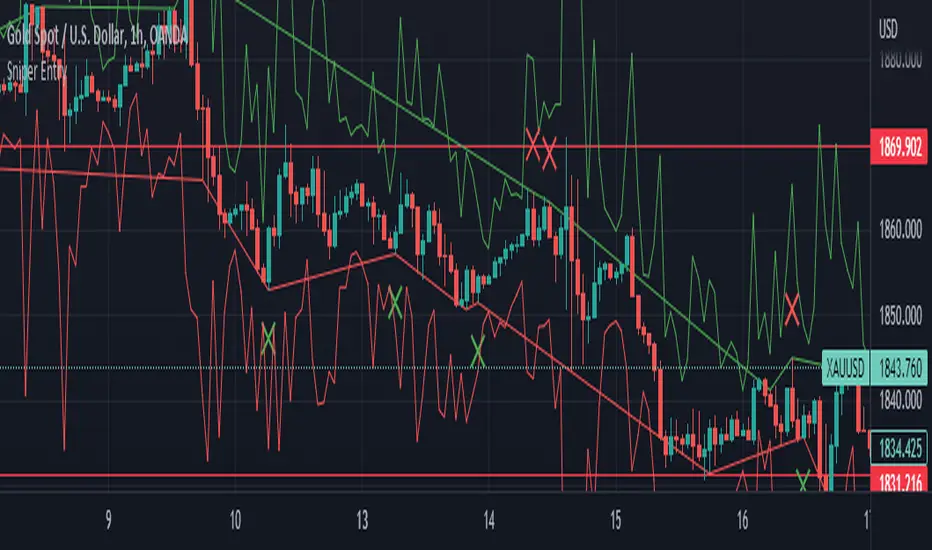
Sniper EntryThis source code is an implementation of a TradingView indicator called "Sniper Entry". The purpose of this indicator is to identify potential entry points for trades based on certain candlestick patterns and the Stochastic oscillator.
The indicator calculates the Stochastic oscillator based on the close, high, and low prices of the asset over a period of 14 bars. It then uses this oscillator to generate buy and sell signals.
For a buy signal to be generated, the Stochastic oscillator must cross above the oversold level of 20, and the current candle must either be a bullish pin bar or a bullish engulfing pattern. For a sell signal to be generated, the Stochastic oscillator must cross below the overbought level of 80, and the current candle must either be a bearish pin bar or a bearish engulfing pattern.
The indicator also calculates the stop loss and target levels for both buy and sell trades. The stop loss is calculated based on the low or high of the candle that generated the signal, depending on whether it's a buy or sell signal. The target is calculated based on the risk/reward ratio, which is set to 3 in this implementation. The lot size is also set to 0.01, and the starting capital is set to 100.
The indicator then plots the buy and sell signals, the stop loss and target levels, and the Stochastic oscillator on the chart.
It's important to note that this is just one example of a trading indicator, and its effectiveness may vary depending on market conditions and the asset being traded. It's also important to perform your own analysis and use proper risk management techniques when making trades based on any indicator or strategy.
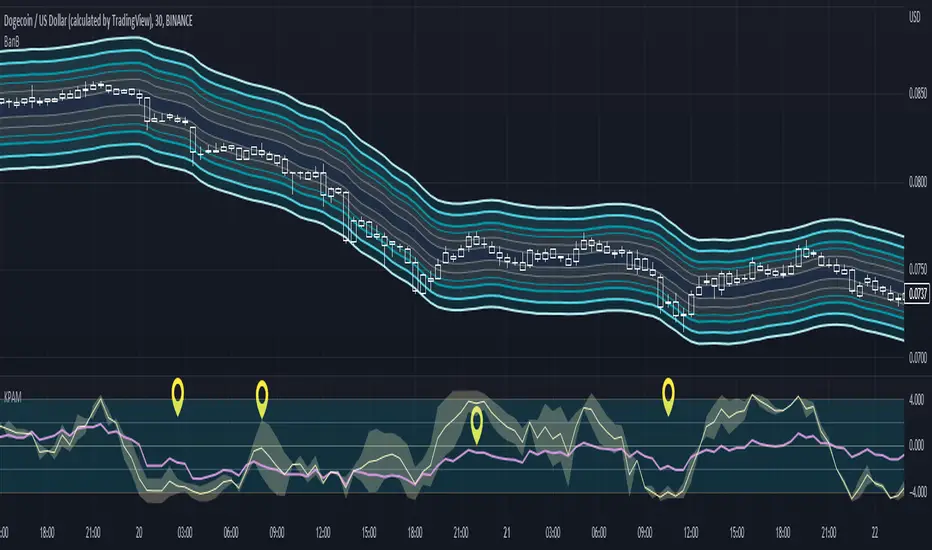
Key Points of Adjoining Median (KPAM)This indicator shows more reliable overbought & oversold levels buy combing 3 different level-indicators (i.e., indicators showing overbought/oversold levels).
A median is created by adjoining two of them and then it is assisted by a third one.
This reduces noise in calculating entries when using level indicators.
Note: The extra indicator shown is "Bands Bands (BanB)"
----- HOW TO USE IT -----
Use with price-action trading and with indicators showing the overall trend.
See notes in chart for more explanation.
The high and low levels of the RSI are within a range of 2 & -2 respectively.
The high and low levels for the median range from 4 & -4 respectively.
The Discordance shows how certain the level of the median is.
For example, if a part of the Discordance touches a low level while the median is at a higher level, then it usually indicates that the median is about to reverse.
The more Discordance that is visible, the less certain the current trend of the median is.
----- HOW THIS INDICATOR IS ORIGINAL; WHAT IT DOES AND HOW IT DOES IT -----
This indicator has an original, unique ability to reduce noise when comparing overbought and oversold levels.
It does this by first adjoining the Stochastic and the Stochastic RSI. Second, it creates a median from the two.
Third, the median is compared to the RSI on the same scale to assist in deciding where the median is at in relation to itself.
It shows whether the median lows and highs are near overbought or oversold levels.
----- VERSION -----
This is not a variant of the Stochastic, Stochastic RSI, and/or the RSI.
The focus is on the median that is created by an adjoining of the Stochastic and Stochastic RSI.
The Stochastic and Stochastic RSI are needed in order to obtain and plot the Median and the Discordance.
The RSI is plotted on the same scale to serve as the comparison needed to evaluate the Median levels with more visual accuracy.
Reverse Stochastic Momentum Index On ChartIntroducing the Reverse Stochastic Momentum Index "On Chart" version
According to Investopedia :
“The Stochastic Momentum Index (SMI) is a more refined version of the stochastic oscillator, employing a wider range of values and having a higher sensitivity to closing prices.”
The SMI is considered a refinement of the stochastic oscillator developed by William Blau and introduced in 1993 in an attempt to provide a more reliable indicator, less subject to false swings.
It calculates the distance of the current closing price as it relates to the median of the high/low range of price.
The SMI has a normal range of values between +100 and -100.
When the present closing price is higher than the median, or midpoint value of the high/low range, the resulting value is positive.
When the current closing price is lower than that of the midpoint of the high/low range, the SMI has a negative value.
Here I have reverse engineered the SMI formula to derive 2 functions.
One function calculates the chart price at which the SMI will reach a particular SMI scale value.
The second function calculates the chart price at which the SMI will crossover its signal line.
I have employed those functions here to give the "crossover" price levels for :
Upper alert level ( default 40, color : aqua blue )
Mid-Line ( default value 0, color : white )
Lower alert level ( default -40, color : purple )
Signal line ( default 13, colors : bright red & lime green )
And also to give the SMI eq price ( colors : red & green )
The midline, upper and lower alert levels return the closing price which would make SMI equal to their respective values
The user can infer from this that.....
Closing above these prices will cause the Stochastic Momentum Index to cross above the associated levels
Closing below these prices will cause the Stochastic Momentum Index to cross below the associated levels
Signal line returns the closing price where Stochastic Momentum Index is equal to its signal line
The user can infer from this that.....
Closing above this price will cause the Stochastic Momentum Index to cross above the signal line
Closing below this price will cause the Stochastic Momentum Index to cross below the signal line
SMI eq price returns the closing price which would make the SMI equal to its previous value
The user can infer from this that.....
Closing above this price will cause the Stochastic Momentum Index to increase
Closing below this price will cause the Stochastic Momentum Index to decrease
Note : all returned prices have a returned value filter to replace any values below zero with zero to help prevent auto focus issues.
These levels are displayed as plotted lines on the chart and also as an optional infobox with choice of displayed info.
This allows the user to see directly on the chart the interplay between the various crossover levels and price action and to precisely plan entries, exits and stops for their SMI based trades.
Traditionally traders and analysts will consider:
Positives values above 40 indicate a bullish trend
Negative values below -40 indicate a bearish trend .
Common traditional ways to derive signals from the SMI :
When the SMI crosses below -40 and then moves back above it, a buy signal is generated.
When the SMI crosses above +40 and then moves back below it, a sell signal is generated.
When the SMI line crosses above the signal line. A signal to buy is generated
When the SMI line crosses below the signal line signal to sell is generated.
When the SMI crosses above the zeroline, signal line and the SMI eq level many interpret that as a full bullish bias signal and take trades only in that direction, vice versa for bearish bias.
Traders also look for divergences between the SMI and price action.
The SMI is often used in conjunction with the Chande Momentum Oscillator or R squared indicator to determine overall market trendiness where the SMI is used to determine the direction of the trend, and also with volume indicators to show if the momentum carries significant selling or buying pressure.

[blackcat] L2 Ehlers MESA Stochastic IndicatorLevel: 2
Background
John F. Ehlers introuced MESA Stochastic Indicator in Jan, 2014.
Function
The MESA Stochastic oscillator, a stochastic successor that removes the effect of spectral dilation through the use of a roofing filter.
Key Signal
MESAStochastic --> Ehlers MESA Stochastic Indicator fast line
Trigger --> Ehlers MESA Stochastic Indicator slow line
Pros and Cons
100% John F. Ehlers definition translation, even variable names are the same. This help readers who would like to use pine to read his book.
Remarks
The 101th script for Blackcat1402 John F. Ehlers Week publication.
Readme
In real life, I am a prolific inventor. I have successfully applied for more than 60 international and regional patents in the past 12 years. But in the past two years or so, I have tried to transfer my creativity to the development of trading strategies. Tradingview is the ideal platform for me. I am selecting and contributing some of the hundreds of scripts to publish in Tradingview community. Welcome everyone to interact with me to discuss these interesting pine scripts.
The scripts posted are categorized into 5 levels according to my efforts or manhours put into these works.
Level 1 : interesting script snippets or distinctive improvement from classic indicators or strategy. Level 1 scripts can usually appear in more complex indicators as a function module or element.
Level 2 : composite indicator/strategy. By selecting or combining several independent or dependent functions or sub indicators in proper way, the composite script exhibits a resonance phenomenon which can filter out noise or fake trading signal to enhance trading confidence level.
Level 3 : comprehensive indicator/strategy. They are simple trading systems based on my strategies. They are commonly containing several or all of entry signal, close signal, stop loss, take profit, re-entry, risk management, and position sizing techniques. Even some interesting fundamental and mass psychological aspects are incorporated.
Level 4 : script snippets or functions that do not disclose source code. Interesting element that can reveal market laws and work as raw material for indicators and strategies. If you find Level 1~2 scripts are helpful, Level 4 is a private version that took me far more efforts to develop.
Level 5 : indicator/strategy that do not disclose source code. private version of Level 3 script with my accumulated script processing skills or a large number of custom functions. I had a private function library built in past two years. Level 5 scripts use many of them to achieve private trading strategy.

RSI Stochastic AlignmentRSI Stochastic Alignment input RSI and Stochastic into 1 windows and align them to find bullish and bearish divergence.
A. The Line display in windows:
1. Fast RSI (green line) is RSI(close,3)
2. Slow Rsi (red line) is Linear Regession of Fast RSI with 5 period and offset 0 = linreg(rsi,5,0)
3. Fast Stochastic (blue line) is %K of Stochastic
4. Slow Stochastic (aqua line) is %D of Stochastic
B. Alignment and Divergence Detect
1. Bearish Divergence:
* Slow RSI at top
* Fast Stochastic at bottom
* Fast RSI over overbought level (default = 70)
* Slow Stochastic under overbought level minus a constant value (Divergence Power value, default this value = 1)
2. Bullish Divergence:
* Fast Stochastic at top
* Slow RSI at bottom
* Fast RSI under oversold level (default = 30)
* Slow Stochastic over oversold level plus a constant value (Divergence Power value, default this value = 1)
C. Script Option
1. RSI value adjustable
2. Stochastic value adjustable
3. Overbought and Oversold Level adjustable
4. Enable/Disable Level line
5. Enable/Disable Divergence Column
6. Enable/Disable Key Bar Colored

[blackcat] L2 Ehlers Modified Stochastic IndicatorLevel: 2
Background
John F. Ehlers introuced Modified Stochastic Indicator in his "Cycle Analytics for Traders" chapter 7 on 2013.
Function
Conventional indicators are not immune to the effects of spectral dilation. For example, a Stochastic indicator remains near its upper bound when the market is in an uptrend even though a relatively short lookback period is used. This, of course, is due to the presence of the larger and longer cyclic components in the data. In a broad sense, the classic Stochastic indicator acts as a one-pole filter because there is just a single difference term in the numerator of its calculation. This calculation is the same as the standard, except Dr. Ehlers use a SuperSmoother for the smoothing instead of moving averages. The bottom subgraph shows an identical calculation except that the Stochastic calculations are preceded by the roofing filter that constrains the cyclic components to fall within the range from 10-bar to 48-bar periods. Clearly, the Stochastic indicator has been dramatically altered by the insertion of the roofing filter.
Dr. Ehlers leaves it to the reader to explore how standard indicators can be improved simply by inserting the roofing filter before the indicator computations are begun.
Key Signal
MyStochastic --> Modified Stochastic Indicator fast line
Trigger --> Modified Stochastic Indicator slow line
Pros and Cons
100% John F. Ehlers definition translation of original work, even variable names are the same. This help readers who would like to use pine to read his book. If you had read his works, then you will be quite familiar with my code style.
Remarks
The 44th script for Blackcat1402 John F. Ehlers Week publication.
Readme
In real life, I am a prolific inventor. I have successfully applied for more than 60 international and regional patents in the past 12 years. But in the past two years or so, I have tried to transfer my creativity to the development of trading strategies. Tradingview is the ideal platform for me. I am selecting and contributing some of the hundreds of scripts to publish in Tradingview community. Welcome everyone to interact with me to discuss these interesting pine scripts.
The scripts posted are categorized into 5 levels according to my efforts or manhours put into these works.
Level 1 : interesting script snippets or distinctive improvement from classic indicators or strategy. Level 1 scripts can usually appear in more complex indicators as a function module or element.
Level 2 : composite indicator/strategy. By selecting or combining several independent or dependent functions or sub indicators in proper way, the composite script exhibits a resonance phenomenon which can filter out noise or fake trading signal to enhance trading confidence level.
Level 3 : comprehensive indicator/strategy. They are simple trading systems based on my strategies. They are commonly containing several or all of entry signal, close signal, stop loss, take profit, re-entry, risk management, and position sizing techniques. Even some interesting fundamental and mass psychological aspects are incorporated.
Level 4 : script snippets or functions that do not disclose source code. Interesting element that can reveal market laws and work as raw material for indicators and strategies. If you find Level 1~2 scripts are helpful, Level 4 is a private version that took me far more efforts to develop.
Level 5 : indicator/strategy that do not disclose source code. private version of Level 3 script with my accumulated script processing skills or a large number of custom functions. I had a private function library built in past two years. Level 5 scripts use many of them to achieve private trading strategy.

Currency Group Stochastic (Dual Timeframe)
This is a stochastic for an entire currency group (majors and crosses). So if you are wondering whether the entire group will reverse this might help. For example, if you are think the USD group will roll over you can see an amalgamated stochastic of AUDUSD, NZDUSD, USDJPY, USDCHF, EURUSD, GBPUSD, USDCAD (average stochastic of all of them). The concept is that it might give help to identify 2 opposing currencies - an overbought currency verses an oversold currency.
Also, if your 'classic' instrument specific stochastic is showing an entry, does the the entire currency group agree?
There's more! You can also see the stochastic of the timeframe above on the current timeframe. You're current period stochastic tells you you've an entry and the stochastic from the timeframe above can indicate there is momentum in your direction. (There is a classic stochastic version of this on my profile)
There is a limit to how much I can fit into a single indicator so if you want to see the current and timeframe above together (recommended) you need to overlap the indicator on itself. See below
You can create a dashboard combined with 'currency relative strengths' (that indicator is on my profile) as per below. You now have an idea of the currency strengths, which currencies are correlating and potential turning point to help you decide which currencies to focus on...
Example...
gbp group COULD be ready to buy
chf group COULD be ready to sell
gbpchf - wait for the 3 min chart to roll over and an its not a bad call (considering it took 60 secs to review the market and choose an entry with the possible backing of the entire currency groups :o) )
REMEMBER, YOU CAN'T THIS TRADE FROM THIS INDICATOR. LOOK AT IT TO UNDERSTAND WHAT THE MARKET MIGHT BE DOING AND FOCUS YOUR DETAILED ATTENTION BASED ON YOUR CONCLUSION.
Good luck

Double Stochastic Oscillator The Double Stochastic Oscillator is a deviation from the Stochastic Oscillators
developed by George C. Lane in the 1950's. The Double Stochastic Oscillator can
be interpreted in the same manner as other Stochastic Oscillators. Like the original
Stochastic Oscillators, it is a momentum indicator designed to show the relation of
the current close price relative to the high/low range over a given number of periods
using a scale of 0-100. It is based on the assumption that in a rising market the price(s)
will close near the high of the range and in a declining market the price(s) will close
near the low of the range.
UCS_S_Stochastic Pop and Drop StrategyMy Contribution to Jake Bernstein Educational Series, Initiated by Chris Moody.
The Stochastic Pop was developed by Jake Bernstein and modified by David Steckler. Bernstein's original Stochastic Pop is a trading strategy that identifies price pops when the Stochastic Oscillator surges above 80. Steckler modified this strategy by adding conditional filters using the Average Directional Index (ADX) and the weekly Stochastic Oscillator.
Modifications
1. Weekly Stochastic Oscillator for Trading Bias = 5* Daily Stochastic
2. Optional Volume Confirmation, Custom Average Volume Length
Future Plans
1. Adding Triggers for Entry, Stops and Target. - This will be release when we have ability to code the complete Strategy. Although it can be done with the current pinescript options, it would be far more easier if we have strategy ability.
Link for Educational Purpose
stockcharts.com
-
Good Luck Trading
UCSgears

Nuh's Stochastic + Structure 1.0Nuh's Stochastic + Structure 1.0 is an advanced momentum–structure fusion indicator designed to identify high-probability reversal and continuation zones using a multi-layer confirmation engine. The script combines enhanced Stochastic analysis, market structure detection (HH/HL/LH/LL), divergence tracking, volume spikes, higher-timeframe trend alignment, and extreme-duration filters to deliver highly reliable buy/sell signals. Each signal is dynamically scored for strength, and a compact one-line trend panel provides real-time market state at a glance. Colors and visual elements follow a clear and intuitive hierarchy optimized for fast decision-making. Ideal for crypto, indices, and forex traders who want precision entries with minimal noise.

REMS Synergy OverlayThis 3rd generation REMS indicator builds upon the foundations assessing the relationships between RSI, EMAs, MACDs, and Stochastic RSI across multiple timeframes. Designed to help traders identify less frequent, but high probability entries across 2 time frames. Uses 3 levels of confluence indicators for both long and short moves.
Confluence Level 1 (Highest Conviction):
Evaluates selected criteria across both timeframes. All selected criteria must be in confluence to trigger signal.
Confluence Level 2 (Moderate Conviction):
Selected criteria can be selected by each timeframe individually. All selected criteria must be in confluence to trigger signal.
Confluence Level 3 (Lower/supportive confluence):
Of the selected criteria, this level can evaluate a set number of conditions that must be met. Number of conditions is user-defined.
Includes VWAP and 4 EMAs as optional visual representations.
Includes 'Enhanced Candles' than can colour code candlesticks for better visual identification. (off by default)
Originally designed with 5 minute and 2 minute timeframes in mind, and pairs well with REMS First Strike and/or REMS Snap Shot indicators.
Values coded below:
RSI
-Primary: Length = 14, Smoothing = 20 (via SMA)
-Secondary: Length = 7, Smoothing = 20 (via SMA)
Stochastic RSI
Primary:
-RSI Length = 14
-Stochastic Length = 8
-%K = 3, %D = 3
Secondary:
-RSI Length = 7
-Stochastic Length = 7
-%K = 3, %D = 2
MACD - applied to both timeframes
-Fast = 12, Slow = 26, Signal = 9

Premier Stochastic Oscillator [LazyBear, V2]This script builds on the well-known Premier Stochastic Oscillator (PSO) originally introduced by LazyBear, and adds a Z-Score extension to provide statistical interpretation of momentum extremes.
Features
Premier Stochastic Core: A smoothed stochastic calculation that highlights bullish and bearish momentum phases.
Z-Score Mapping: The PSO values are standardized into Z-Scores (from –3 to +3), quantifying the degree of momentum stretch.
Positive / Negative Z-Scores:
Positive Z values suggest momentum strength that can align with accumulation or favorable buying conditions.
Negative Z values indicate stronger bearish pressure, often aligning with selling or distribution conditions.
On-Chart Label: The current Z-Score is displayed on the latest bar for quick reference.
How to Use
Momentum Confirmation: Use the oscillator to confirm whether bullish or bearish momentum is intensifying.
Overextended Conditions: Extreme Z-Scores (±2 or beyond) highlight statistically stretched conditions, often preceding reversions.
Strategic Integration: Best applied in confluence with trend tools or higher-timeframe filters; not a standalone trading signal.
Originality
Unlike the standard PSO, this version:
Adds a Z-Score framework for objective statistical scaling.
Provides real-time labeling of Z values for clarity.
Extends the classic oscillator into a tool for both momentum detection and mean-reversion context.

VIX Stoch RSI Oscillator [HUD Box + Compression]vix stoch rsi Oscillator
watch volatility without switching charts,
gives signal based off fib levels 0-100 / volatility,
emoji box to show signal,
HUD Box: emoji-coded tactical feedback
bounce 100 "💥 Expansion" :
bounce 0.8 "🔴 Overbought" :
bounce 0.618 "📉 Distribution" :
bounce 0.5 "🧠 Midline" :
bounce 0.382 "📈 Accumulation" :
bounce 0.2 "🟢 Oversold" :
bounce0.0 "💣 Expansion" : "⚪ Neutral"
Tiger EMA/STOCH
This logic checks if the oscillator is trending above or below its 48-period EMA,
If above, it paints the line GREEN🟢 (bullish),
If below, it paints it RED🔴 (bearish),
If compression is active, it overrides both with purple🟣 to highlight tactical squeeze conditions,
⚠️WARNING⚠️
ALWAYS REMEMBER THIS CHART IS VIX/USD
IN MOST CASES SPY MOVES VICE VERSA
I AM NOT RESPOSIBLE FOR YOUR OWN ACTIONS/TRADE IDEAS
AMEX:USD
TVC:VIX
SP:SPX

Universal Stochastic Fusion (Simplified) — v6What this indicator is
This indicator is called Universal Stochastic Fusion (USF).
It’s a tool that helps traders see when the market might be too high (overbought) or too low (oversold), and when it might be a good time to buy or sell.
________________________________________
How it works
Think of the market like a rubber band.
• If the band stretches too far up, it usually snaps back down.
• If it stretches too far down, it usually bounces back up.
The USF indicator measures this stretch using something called the Stochastic Oscillator (just a fancy way of saying it looks at where the current price sits compared to recent highs and lows).
It shows this on a scale from 0 to 100:
• Near 100 → market is stretched upward (too hot).
• Near 0 → market is stretched downward (too cold).
• Around 50 → normal, middle ground.
________________________________________
What’s special about USF
1. Two views at once
o It lets you see the market’s stretch on your current chart and on another timeframe (like a daily view).
o This way, you can see the short-term and the bigger picture together.
2. Smart levels
o Instead of always using the same “too high/too low” levels (like 80 and 20), it can adjust these lines automatically depending on how wild or calm the market is.
3. Buy and Sell signals
o When the market looks too low and starts turning up, it can mark a BUY.
o When the market looks too high and starts turning down, it can mark a SELL.
4. Extra filter (optional)
o It can also use another tool (RSI) to double-check signals, so you don’t get as many false alerts.
________________________________________
How this helps traders
• It helps traders avoid buying when prices are already too high.
• It helps them spot possible bottoms where prices may bounce back.
• It combines short-term and long-term signals so traders don’t get tricked by quick moves.
________________________________________
Where it works
This indicator is universal — meaning it works on almost any market:
• Stocks (like Apple, Tesla, etc.)
• Forex (currencies like EUR/USD)
• Crypto (Bitcoin, Ethereum, etc.)
• Commodities (Gold, Oil, etc.)
• Futures and Indices (S&P 500, Nasdaq, etc.)
Because all these markets share the same pattern of prices going up and down too much and then pulling back, the USF can be applied everywhere.
________________________________________
👉 In short:
The Universal Stochastic Fusion is like a heat meter for the market.
It tells you when prices might be too hot (good chance to sell) or too cold (good chance to buy), and it works in all markets and timeframes.
________________________________________
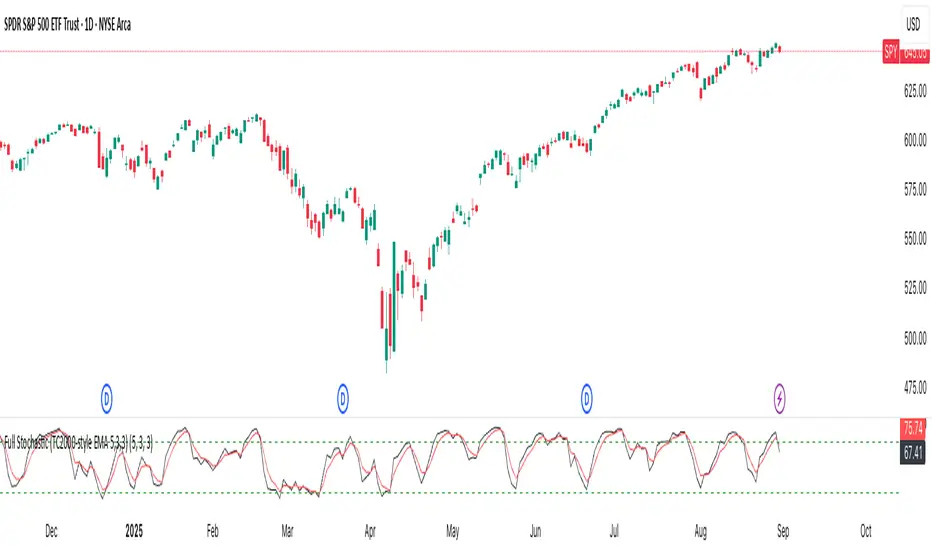
Full Stochastic (TC2000-style EMA 5,3,3)Full Stochastic (TC2000-style EMA 5,3,3) computes a Full Stochastic oscillator matching TC2000’s settings with Average Type = Exponential.
Raw %K is calculated over K=5, then smoothed by an EMA with Slowing=3 to form the Full %K, and %D is an EMA of Full %K with D=3.
Plots:
%K in black, %D in red, with 80/20 overbought/oversold levels in green.
This setup emphasizes momentum shifts while applying EMA smoothing at both stages to reduce noise and maintain responsiveness. Inputs are adjustable to suit different symbols and timeframes.
Gap Reversal Signal with Indicators🔍 Gap Reversal Signal with Indicators — 結合 KD、MACD、SAR 與背離分析的多功能指標
🔍 Gap Reversal Signal with Indicators — A Multi-Tool Signal Indicator Combining KD, MACD, SAR, and Divergence Analysis
中文說明:
本指標結合多種常用技術分析工具,包括 KD 隨機指標、MACD 動能交叉、SAR 趨勢方向、以及 MACD 背離偵測,用以辨識潛在的價格反轉區域。適用於日內交易與波段操作,支援各類市場,如加密貨幣、股票與外匯等。
English Description:
This indicator combines several popular technical tools: Stochastic KD, MACD momentum crossovers, SAR trend direction, and MACD divergence detection. It helps traders identify potential reversal areas and is ideal for both intraday and swing trading. Works well on crypto, stocks, and forex markets.
🧠 功能特點 | Key Features
✅ KD指標(慢速隨機指標)檢測超買超賣並提供%K與%D交叉訊號
✅ Stochastic KD (slow) to detect overbought/oversold zones and crossover signals
✅ MACD金叉/死叉與零軸突破捕捉趨勢轉變與動能反轉
✅ MACD Crossovers + Zero-Line Breaks to capture trend changes and momentum reversals
✅ SAR指標即時顯示多空方向
✅ Parabolic SAR for real-time trend direction indication
✅ MACD背離偵測協助辨識潛在反轉區域
✅ MACD Divergence Detection for identifying hidden trend reversals
✅ 圖形提示與標籤提示可視化呈現各類訊號
✅ Visual Alerts and Labels for easy and quick signal recognition
📈 支援市場 | Supported Markets
📊 台股 / 美股 / 外匯 / 加密貨幣
📊 Taiwan Stocks / US Stocks / Forex / Cryptocurrencies (e.g. BTC, ETH)
🔧 推薦用法 | Recommended Use
搭配缺口策略與支撐壓力位使用
Use with gap-trading strategies and support/resistance zones
用於盤整末期或趨勢反轉的提示
Helpful for end-of-consolidation signals or trend reversals
支援短線與波段交易風格
Suitable for scalping and swing trading styles
💡 把這個指標加入你的圖表,立即體驗多重技術分析所帶來的交易優勢!
💡 Add this indicator to your chart now and experience the power of multi-tool technical analysis!

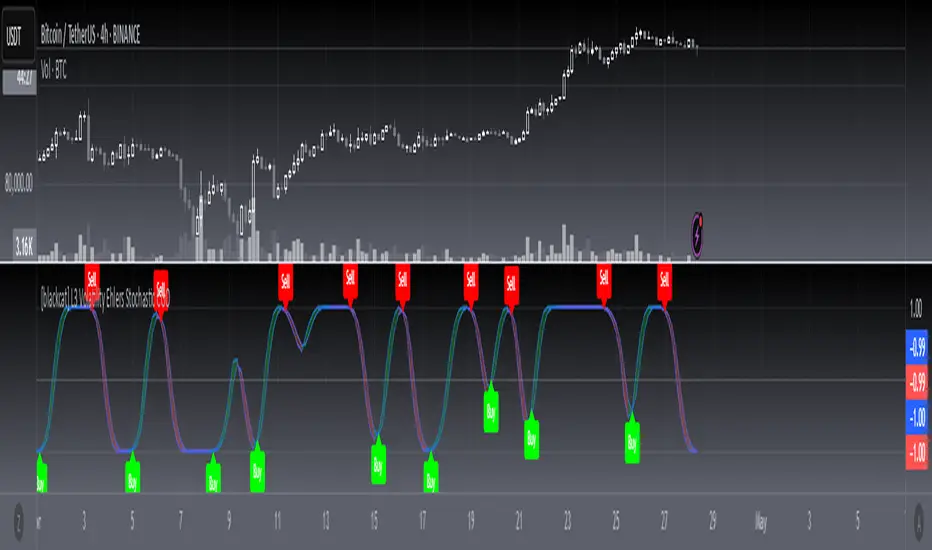
[blackcat] L3 Volatility Ehlers Stochastic CGOOVERVIEW
This advanced indicator integrates the Center of Gravity Oscillator (CGO) with an Ehlers-Stochastic framework and an Adaptive Local Minimum-Maximum Average (ALMA) smoothing algorithm. Designed for non-overlaid charts, it identifies market momentum shifts by analyzing price action through multi-layer volatility analysis.
FEATURES
• Dual-line system:
✓ Stochastic CGO: Core oscillating line derived from weighted OHLC price calculations
✓ ALMA Lagging Line: Smoothing component using customizable offset/sigma parameters
• Dynamic color scheme:
✓ Green/red trend differentiation via crossover comparison
✓ Optional fill areas between lines (toggleable)
• Clear trade signals:
✓ Buy/Sell labels triggered by mathematically defined crossovers
✓ Zero-reference baseline marker (#0ebb23)
• Customizable parameters:
Fast Length (9 default) controls CGO sensitivity
Slow Length (5 default) governs ALMA responsiveness
ALMA Offset/Sigma allow adaptive curve optimization
HOW TO USE
Configure core parameters:
• Adjust Fast Length (CGO timeframe window)
• Set Slow Length, ALMA Offset, and Sigma for smoother/laggier response
Interpret visuals:
• Bullish trend = green shaded zone (when primary line above lagging line)
• Bearish trend = red shaded zone (primary line below lagging line)
Analyze signals:
• Buy triggers occur when rising CGO crosses above ALMA while below zero
• Sell triggers activate when falling CGO breaks below ALMA after exceeding zero base
Optimize display:
✓ Enable/disable fill area via Fill Between Lines
LIMITATIONS
• Relies heavily on lookback periods - rapid market changes may reduce predictive accuracy
• Signal frequency increases during high-volatility environments
• Requires additional confirmation methods due to occasional premature crossovers
• Default parameter settings may lack universality across asset classes
NOTES
• Best paired with volume-based confirmations for stronger signals
• Reducing ALMA Sigma sharpens line responsiveness at cost of noise susceptibility
• Increasing Fast Length extends calculation horizon while reducing peak sensitivity
• Weighted OHLC source formula prioritizes closing prices for swing direction assessment
Polyphase Stochastic RSI (PSRSI)The Polyphase Stochastic RSI (PSRSI) provides a continuous estimate of higher timeframe Stochastic RSI behavior by using polyphase decimation. The number of phases represents the timeframe multiplier - for example, 3 phases approximates a 3x higher timeframe.
While traditional higher timeframe indicators only update at the completion of each higher timeframe bar, the PSRSI creates a continuous signal by maintaining multiple phase-shifted calculations and combining them with appropriate anti-aliasing filters. This approach eliminates the gaps and discontinuities typically seen in higher timeframe indicators, though the resulting signal may sometimes deviate from the true higher timeframe values due to its estimative nature.
The indicator processes data through parallel phase calculations, each handling a different subset of price data offset in time. These phases are then filtered and combined to prevent aliasing artifacts that occur in simple timeframe conversions. The result is a smooth, continuous signal that starts providing meaningful values immediately, without requiring a warm-up period of higher timeframe bars.
Users can choose between RSI and Stochastic RSI modes, with both benefiting from the same polyphase processing technique. The indicator maintains the standard interpretation of overbought and oversold conditions while providing a more continuous view of higher timeframe momentum.

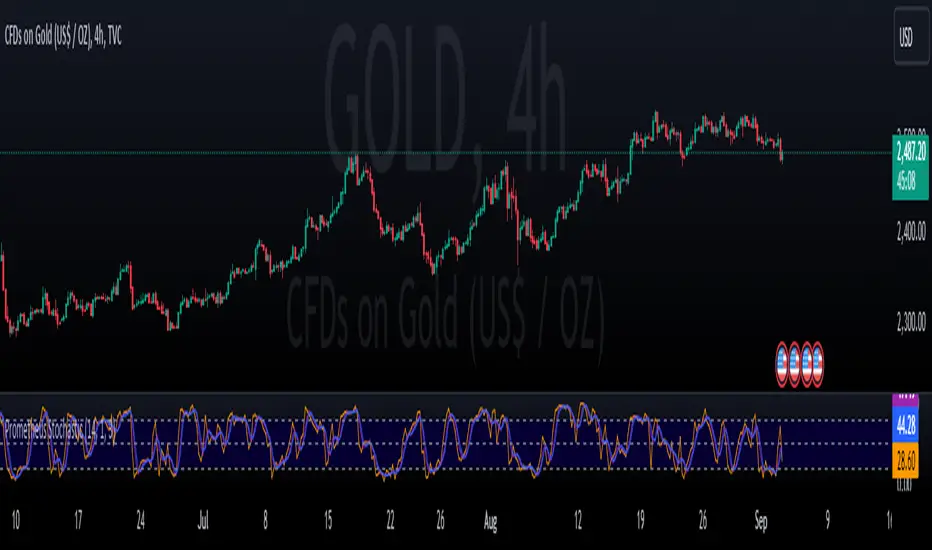
Prometheus StochasticThe Stochastic indicator is a popular indicator developed in the 1950s. It is designed to identify overbought and oversold scenarios on different assets. A value above 80 is considered overbought and a value below 20 is considered oversold.
The formula is as follows:
%k = ((Close - Low_i) / (High_i / Low_i)) * 100
Low_i and High_i represent the lowest low and highest high of the selected period.
The Prometheus version takes a slightly different approach:
%k = ((High - Lowest_Close_i) / (High_i / Low_i)) * 100
Using the Current High minus the Lowest Close provides us with a more robust range that can be slightly more sensitive to moves and provide a different perspective.
Code:
stoch_func(src_close, src_high, src_low, length) =>
100 * (src_high - ta.lowest(src_close, length)) / (ta.highest(src_high, length) - ta.lowest(src_low, length))
This is the function that returns our Stochastic indicator.
What period do we use for the calculation? Let Prometheus handle that, we utilize a Sum of Squared Error calculation to find what lookback values can be most useful for a trader. How we do it is we calculate a Simple Moving Average or SMA and the indicator using a lot of different bars back values. Then if there is an event, characterized by the indicator crossing above 80 or below 20, we subtract the close by the SMA and square it. If there is no event we return a big value, we want the error to be as small as possible. Because we loop over every value for bars back, we get the value with the smallest error. We also do this for the smoothing values.
// Function to calculate SSE for a given combination of N, K, and D
sse_calc(_N, _K, _D) =>
SMA = ta.sma(close, _N)
sf = stoch_func(close, high, low, _N)
k = ta.sma(sf, _K)
d = ta.sma(k, _D)
var float error = na
if ta.crossover(d, 80) or ta.crossunder(d, 20)
error := math.pow(close - SMA, 2)
else
error := 999999999999999999999999999999999999999
error
var int best_N = na
var int best_K = na
var int best_D = na
var float min_SSE = na
// Loop through all combinations of N, K, and D
for N in N_range
for K in K_range
for D in D_range
sse = sse_calc(N, K, D)
if (na(min_SSE) or sse < min_SSE)
min_SSE := sse
best_N := N
best_K := K
best_D := D
int N_opt = na
int K_opt = na
int D_opt = na
if c_lkb_bool == false
N_opt := best_N
K_opt := best_K
D_opt := best_D
This is the section where the best lookback values are calculated.
We provide the option to use this self optimizer or to use your own lookback values.
Here is an example on the daily AMEX:SPY chart. The top Stochastic is the value with the SSE calculation, the bottom is with a fixed 14, 1, 3 input values. We see in the candles with boxes where some potential differences and trades may be.
This is another comparison of the SSE functionality and the fixed lookbacks on the NYSE:PLTR 1 day chart.
Differences may be more apparent on lower time frame charts.
We encourage traders to not follow indicators blindly, none are 100% accurate. SSE does not guarantee that the values generated will be the best for a given moment in time. Please comment on any desired updates, all criticism is welcome!
Pulse Oscillator [UAlgo]The "Pulse Oscillator " is a trading tool designed to capture market momentum and trend changes by combining the strengths of multiple well-known technical indicators. By integrating the RSI (Relative Strength Index), CCI (Commodity Channel Index), and Stochastic Oscillator, this indicator provides traders with a comprehensive view of market conditions, offering both trend filtering and precise buy/sell signals. The oscillator is customizable, allowing users to fine-tune its parameters to match different trading strategies and timeframes. With its built-in smoothing techniques and level adjustments, the Pulse Oscillator aims to be a reliable tool for both trend-following and counter-trend trading strategies.
🔶 Key Features
Multi-Indicator Integration: Combines RSI, CCI, and Stochastic Oscillator to create a weighted momentum oscillator.
Why Use Multi-Indicator Integration?
Script uses Multi-Indicator Integration to combine the strengths of different technical indicators—such as RSI, CCI, and Stochastic Oscillator—into a single tool. This approach helps to reduce the weaknesses of individual indicators, providing a more comprehensive and reliable analysis of market conditions. By integrating multiple indicators, we can generate more accurate signals, filter out noise, and enhance our trading decisions.
Customizable Parameters: Allows users to adjust weights, periods, and smoothing techniques, providing flexibility to adapt the indicator to various market conditions.
Trend Filtering Option: An optional trend filter is available to enhance the accuracy of buy and sell signals, reducing the risk of false signals in choppy markets.
Dynamic Levels: The indicator dynamically calculates multiple levels of support and resistance, adjusting to market conditions with customizable decay factors and offsets.
Visual Clarity: The indicator visually represents different levels and trends with color-coded plots and fills, making it easier for traders to interpret market conditions at a glance.
Alerts: Configurable alerts for buy and sell signals, as well as trend changes, enabling traders to stay informed of key market movements without constant monitoring.
🔶 Interpreting the Indicator
Buy Signal: A buy signal is generated when the Slow Line crosses under the Fast Line during an uptrend or when the trend filter is disabled. This indicates a potential bullish reversal or continuation of an upward trend.
Sell Signal: A sell signal occurs when the Slow Line crosses above the Fast Line during a downtrend or when the trend filter is disabled, signaling a potential bearish reversal or continuation of a downward trend.
Trend Change: The indicator detects trend changes when the Fast Line shifts from increasing to decreasing or vice versa, providing early warning of possible market reversals.
Dynamic Levels: The indicator calculates upper and lower levels based on the Fast Line's values. These levels can be used to identify overbought or oversold conditions and potential areas of support or resistance.
🔶 Disclaimer
Use with Caution: This indicator is provided for educational and informational purposes only and should not be considered as financial advice. Users should exercise caution and perform their own analysis before making trading decisions based on the indicator's signals.
Not Financial Advice: The information provided by this indicator does not constitute financial advice, and the creator (UAlgo) shall not be held responsible for any trading losses incurred as a result of using this indicator.
Backtesting Recommended: Traders are encouraged to backtest the indicator thoroughly on historical data before using it in live trading to assess its performance and suitability for their trading strategies.
Risk Management: Trading involves inherent risks, and users should implement proper risk management strategies, including but not limited to stop-loss orders and position sizing, to mitigate potential losses.
No Guarantees: The accuracy and reliability of the indicator's signals cannot be guaranteed, as they are based on historical price data and past performance may not be indicative of future results.

Stocastic Reference Dinoa technical analysis indicator named "Stocastic Reference Dino," which is a stochastic oscillator used to analyze market trends and potential price reversals.
Key Features:
Inputs:
K Period (lengthK): Defines the period for the %K line calculation (default 13).
D Period (lengthD): Defines the period for the %D line calculation (default 9).
Smoothing Period (smoothK): Smoothing period for the %K line (default 8).
Low Threshold (lowThreshold): Lower bound threshold for the oscillator (default 10).
High Threshold (highThreshold): Upper bound threshold for the oscillator (default 80).
%K Line Calculation:
Calculates the lowest low and highest high over the lengthK period.
Computes the %K value and smooths it using a simple moving average over smoothK periods.
%D Line Calculation:
Calculates the %D line as a simple moving average of the %K line over the lengthD period.
Plotting:
Plots the %K line in blue and the %D line in red on a new pane.
Adds horizontal lines to represent the low and high thresholds, colored green and red, respectively.
This indicator helps traders identify potential overbought and oversold conditions by analyzing the stochastic oscillator lines (%K and %D) relative to the defined thresholds.

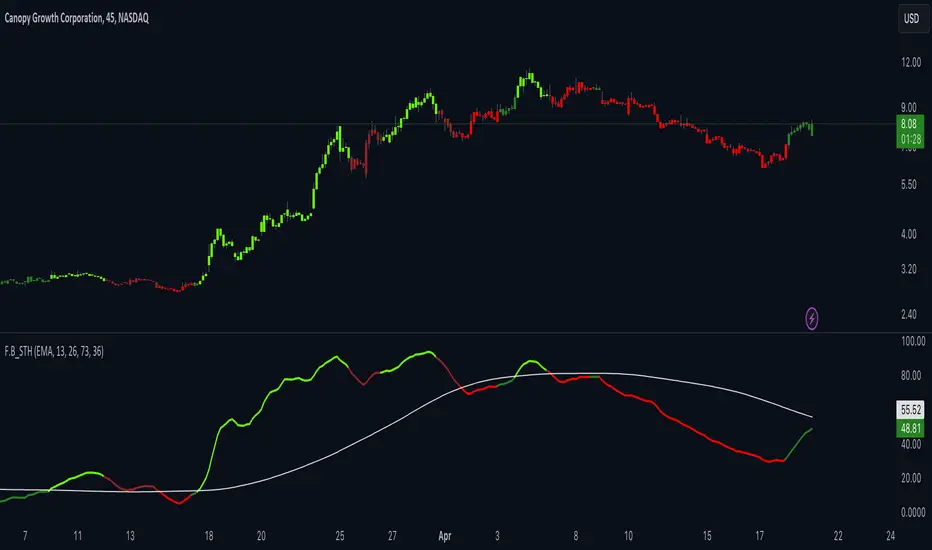
F.B_Stochastic Trend HarmonizerThe "F.B_Stochastic Trend Harmonizer" has been developed to provide insights into market trends. It combines stochastic oscillations with moving averages. Stochastic oscillators are used to measure market fluctuations, while moving averages serve to smooth these fluctuations and identify trends. By linking these elements, the indicator aims to offer an enhanced representation of market dynamics and potential trend reversals.
You can choose various types of moving averages such as SMA, EMA, or WMA and control the sensitivity of the lines by adjusting the smoothing factors. The fast line displays harmonized stochastic values, while the slow line is smoothed by a moving average.
The "Fast Line 2" marks individual candles for better visibility. It is recommended to combine this indicator with other analysis tools to make trading decisions.
If the "Fast Line" is greater than the "Slow Line MA," it indicates an uptrend. Conversely, if the "Fast Line" is smaller than the "Slow Line MA," it signals a downtrend.