NY Trading Session TrackerNY Trading Session Tracker
This indicator highlights the New York trading session (14:30–21:00 UTC) directly on your chart. It visually identifies the session with a customizable background color and optional labels marking the session’s open and close. For added clarity, the labels can display the precise open and close prices, formatted with commas and up to 4 decimal places. Perfect for intraday traders looking to focus on one of the most active market periods.
Features:
• Highlight the NY session with a customizable background.
• Optional session open/close labels.
• Display open/close prices with professional formatting.
• Fully customizable settings for labels and colors.
Streamline your trading workflow and focus on what matters with the NY Trading Session Tracker!
Search in scripts for "track"

Dynamic Support & Resistance Tracker with MTFDynamic Support & Resistance Tracker with Weekly, Monthly & Daily Levels
The Dynamic Support & Resistance Tracker is designed to help traders identify key support and resistance levels across multiple timeframes, enhancing market analysis and decision-making. This indicator calculates and plots support and resistance levels for daily, weekly, and monthly periods, along with extension lines that provide insights into potential price targets.
Key Features:
Multi-Timeframe Analysis:
Daily Levels: Identifies the high, low, and midpoint for each trading day. These levels help traders recognize important price points for short-term trading strategies.
Weekly Levels: Plots the high, low, and midpoint for each week. This feature is valuable for swing traders who need to understand broader market trends.
Monthly Levels: Displays the high, low, and midpoint for each month, which is essential for long-term investors.
Extension Lines:
Calculates extension lines beyond the standard support and resistance levels to help anticipate potential price targets and reversals. These extensions are based on the distance between the high/low and midpoint levels.
Real-Time Updates:
Automatically updates the levels based on the most recent market data, ensuring traders have the most current information for their analysis.
Clear Visuals:
The indicator provides clearly labeled and color-coded lines for easy identification of key levels, improving the visual clarity of market analysis.
How It Works:
Daily, Weekly, and Monthly Levels: The indicator calculates the high, low, and midpoint levels for daily, weekly, and monthly timeframes and plots them on the chart. These levels serve as potential areas of support and resistance where price action may react.
Extension Lines: The extension lines are calculated based on the distance between the high/low and midpoint levels, projecting potential areas where price may find support or resistance beyond the standard levels.
Automatic Updates: The indicator continuously updates the plotted levels based on the latest market data, providing real-time insights.
Benefits:
Improved Market Analysis: By providing a clear view of support and resistance levels across multiple timeframes, this indicator helps traders understand market trends and price movements more effectively.
Informed Trading Decisions: The detailed plotting of levels and extensions allows traders to make more informed decisions, enhancing their trading strategies.
Versatility: Suitable for various trading styles, including intraday trading, swing trading, and long-term investing.
Instructions for Use:
Analyze the Levels: Observe the plotted high, low, and mid-levels for daily, weekly, and monthly timeframes.
Plan Your Trades: Use the identified support and resistance levels to set your entry and exit points, stop-losses, and profit targets.
Monitor the Market: Stay updated with real-time adjustments of the levels, ensuring you always have the latest market information.
Note: This indicator is designed to enhance your trading analysis by providing clear and reliable support and resistance levels. However, it should be used as part of a comprehensive trading strategy and not as the sole basis for trading decisions.

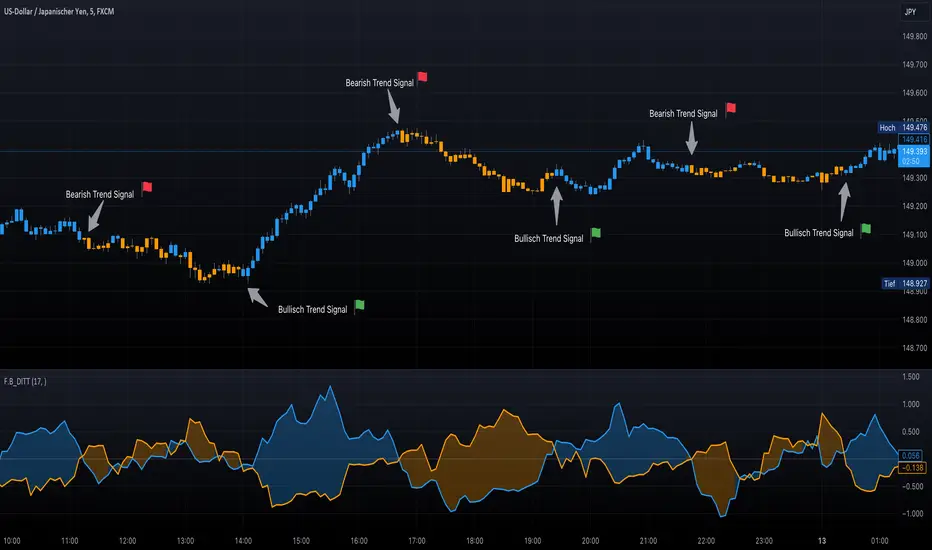
F.B_DI+ DI- Trend TrackerThe F.B_DI+ DI- Trend Tracker is an indicator developed based on Directional Movement and True Range to identify trends in the market and assess their strength. Here is the logic behind the indicator and how to use it for trading:
Direction Determination
Unlike traditional DI+ and DI- based on simple calculations, this indicator utilizes derived versions of these directional indicators. These derived versions offer a more precise measurement of price directional movements by specifically tailoring to market conditions and the chosen time frame.
Trend Strength
The derived directional indicators are generated by dividing smoothed Directional Movements by smoothed True Range and converting them into percentages. These values provide insights into the strength of the trend by considering directional movements relative to market volatility.
Identifying Trend Reversals
To capture changes in trend strength more accurately, the first derivative of DI+ and DI- is computed. A crossover of these derived versions could indicate a potential trend reversal, with a crossover of DI+ over DI- suggesting a possible uptrend and a crossover of DI- over DI+ indicating a potential downtrend.
Making Trading Decisions
Traders can use crossovers between the derived DI+ and DI- to receive signals for potential trend reversals. Additionally, changes in the color of candlesticks or background can be used as confirmation of the trend direction and its strength.
By utilizing these derived directional indicators, the F.B_DI+ DI- Trend Tracker indicator offers more precise trading signals and improved trend analysis, enabling traders to make informed trading decisions.
The Shiller: S/R and Momentum Tracker"The Shiller: S/R and Momentum Tracker" is a sophisticated and comprehensive Pine Script designed for traders who thrive on the cutting edge of market analysis. This script is a powerful blend of technical indicators and strategic insights, tailored to offer a commanding view of the cryptocurrency markets. Here's a glimpse into what makes "The Shiller" a standout choice:
Dynamic Support and Resistance (S/R) Levels: At its core, "The Shiller" efficiently identifies and plots crucial support and resistance levels. By harnessing the power of pivot points, the script delineates these key zones, providing traders with a clear visual guide to potential areas of market interest. Whether you're eyeing an entry point or setting up stop-loss levels, "The Shiller" keeps you one step ahead.
Real-Time RSI Analysis: The Relative Strength Index (RSI), a staple in any trader's toolkit, is integrated seamlessly. This feature allows you to gauge the current market momentum and identify overbought or oversold conditions. By keeping a pulse on the RSI readings, "The Shiller" empowers traders to make more informed decisions, be it riding a trend or anticipating a reversal.
Awesome Oscillator (AO) Insights: Adding another layer to its analytical prowess, "The Shiller" includes the Awesome Oscillator. This indicator offers a unique perspective on market dynamics, highlighting the essence of market movements. Whether the market is gathering strength for a potential breakout or showing signs of exhaustion, the AO readings on "The Shiller" are an invaluable resource.
Elegant and Informative Display Panel: One of the script's most striking features is its display panel. Positioned unobtrusively on the chart, this panel presents real-time updates of the RSI, AO, and their positions relative to the S/R levels. This efficient summarization provides a snapshot of market conditions, all at a glance.
Customizable and User-Friendly: "The Shiller" is designed with the user in mind. Inputs for RSI period, pivot range for S/R levels, and more can be easily adjusted to suit individual trading styles and preferences.
Versatile Application: While optimized for the volatile crypto markets, "The Shiller" is versatile enough to be applied to a range of financial instruments. Whether you're trading cryptocurrencies, stocks, forex, or commodities, this script is a valuable addition to your trading arsenal.
"The Shiller: S/R and Momentum Tracker" is more than just a script; it's a strategic partner in your trading journey. With its combination of technical precision and user-friendly design, it stands as a beacon of clarity in the often tumultuous financial markets.

Optimized Trend Tracker STRATEGY & SCREENEROptimized Trend Tracker - OTT STRATEGY & SCREENER screens the BUY and SELL signals (trend reversals) for 20 user defined different tickers in Tradingview charts.
Simply input the name of the ticker in Tradingview that you want to screen.
Terminology explanation:
Confirmed Reversal: OTT reversal that happened in the last bar and cannot be repainted.
Potential Reversal: OTT reversal that might happen in the current bar but can also not happen depending upon the timeframe closing price.
Downtrend: Tickers that are currently in the sell zone
Uptrend: Tickers that are currently in the buy zone
Screener has also got a built in OTT indicator which users can confirm the reversals on graphs.
Screener explores the 20 tickers in current graph's time frame and also in desired parameters of the OTT indicator.
Also you can optimize the parameters manually with the built in STRATEGY version.
Optimized Trend Tracker indicator :
Built in Moving Average type defaultly set as VAR but users can choose from 8 different Moving Average types like:
SMA : Simple Moving Average
EMA : Exponential Movin Average
WMA : Weighted Moving Average
TMA : Triangular Moving Average
VAR : Variable Index Dynamic Moving Average aka VIDYA
WWMA : Welles Wilder's Moving Average
ZLEMA : Zero Lag Exponential Moving Average
TSF : True Strength Force
Tip: In sideways VAR would be a good choice
You can use OTT default alarms and Buy Sell signals like:
1-
BUY when Prices are above OTT
SELL when Prices are below OTT
2-
BUY when OTT support Line crosses over OTT line.
SELL when OTT support Line crosses under OTT line.
3-
BUY when OTT line is Green and makes higher highs.
SELL when OTT line is Red and makes lower lows.
IMPORTANT: SCREENER ONLY EXPLORES AND SCREENS FOR THE 2nd SIGNAL TYPE:
BUY when OTT support Line crosses over OTT line.
SELL when OTT support Line crosses under OTT line.

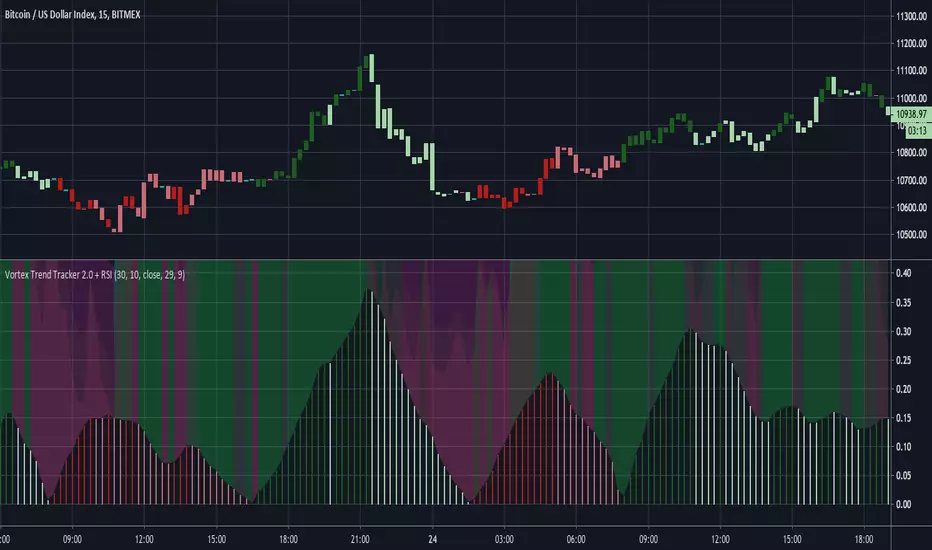
Vortex Trend Tracker 2.0 + RSIHere's an updated version of our Vortex Trend Tracker indicator.
Here's the link to the original if anyone wants to read more about the Vortex or see the first version:
We've added in 4 rsi's of varying lengths for this second version(2 fast and 2 slow) that create the background color effect.
Trend tracker (Gabriel Freitas)The Trend Tracker indicator is a trend tracker, as the name itself says. It indicates possible buying and selling points for traders. Based on setups of trader Oliver Velez and widely used in Brazil by André Machado.
I added a mother moving average (200 periods) and another to assist in the entries (20 periods)
[Azmath]_[Track]_[Day_High]_[Day_Low]
This indicators Tracks the Day's high and low as the day progresses and has the ability to alert when a new high or new low is detected

NeuroSwarm ETH — Crowd vs Experts Forecast TrackerEnglish:
NeuroSwarm — Crowd vs Experts Forecast Tracker (ETH)
This indicator visualizes monthly forecast data collected from two independent groups:
Crowd – a large sample of retail participants
Experts – a curated group of analysts and experienced market participants
For each month, the indicator plots the following values as horizontal levels on the price chart:
Median forecast (Crowd)
Average forecast (Crowd)
Median forecast (Experts)
Average forecast (Experts)
Shaded zones highlighting the difference between median and mean
All values are fixed for each month and stay unchanged historically.
This allows traders to analyze sentiment dynamics and compare how expectations from both groups align or diverge from actual price action.
Purpose:
This tool is intended for sentiment visualization and analytical insight — it does not generate trading signals.
Its main goal is to compare collective expectations of retail traders vs experts across time.
Data source:
All forecasts come from monthly surveys conducted within the NeuroSwarm project between the 1st and 5th day of each month.
Interface notice:
The script's UI may contain non-English labels for convenience, but a full English documentation is provided here in compliance with TradingView rules.
Русская версия:
NeuroSwarm — Мудрость Толпы vs Эксперты (ETH)
Индикатор отображает ежемесячные прогнозы двух групп:
Толпа: медиана и средняя прогнозов
Эксперты: медиана и средняя прогнозов
Значения фиксируются для каждого месяца и показываются горизонтальными уровнями.
Заливка отображает диапазон между медианой и средней, что упрощает визуальное сравнение настроений.
Это аналитический инструмент для визуализации настроений — не торговая стратегия.
Все данные берутся из ежемесячных опросов проекта NeuroSwarm.

NeuroSwarm BTC — Crowd vs Experts Forecast TrackerEnglish:
NeuroSwarm — Crowd vs Experts Forecast Tracker (BTC)
This indicator visualizes monthly forecasts collected from two independent groups:
Crowd – a large sample of retail traders
Experts – a smaller, curated group of analysts and experienced market participants
For each month, the following values are displayed as horizontal levels on the chart:
Median forecast of the Crowd
Average forecast of the Crowd
Median forecast of Experts
Average forecast of Experts
Shaded zones showing the range between median and mean
The values remain fixed throughout each month. This allows traders to compare sentiment dynamics between groups and see how expectations evolve relative to actual market movement.
Purpose:
This indicator is designed for sentiment analysis — NOT for generating trading signals.
It helps identify divergences between retail expectations and expert forecasts, which can be informative during trend transitions.
Data source:
All values come from monthly surveys conducted within the NeuroSwarm project (1–5 of every month).
Crowd and Expert groups are collected separately to avoid bias and to preserve independent aggregation.
Interface language note:
The indicator’s interface may contain non-English labels for ease of use, but full English documentation is provided here in compliance with TradingView House Rules.
Русская версия (optional, allowed only AFTER English):
NeuroSwarm — Мудрость Толпы vs Эксперты (BTC)
Индикатор показывает ежемесячные прогнозы двух групп:
Толпа: медиана и средняя прогнозов
Эксперты: медиана и средняя прогнозов
Значения фиксируются на весь месяц и отображаются на графике горизонтальными уровнями.
Заливка показывает диапазон между медианой и средней.
Цель индикатора — визуализировать настроение толпы и экспертов и сравнить его с реальным движением цены.
Это аналитический инструмент, а не торговая стратегия.
Данные берутся из ежемесячных опросов (1–5 числа), проводимых в рамках проекта NeuroSwarm.

Market Movers TrackerMarket Movers Tracker — Live Big-Move + Volume + Gap Screener (2025)
The cleanest, fastest, most beautiful real-time scanner for stocks, crypto, forex — instantly tells you:
• Daily / Session / Weekly % change
• HUGE moves (5%+) and BIG moves (3%+) with glowing background
• Volume spikes (2x+ average) with orange bar highlights
• Gap-up / Gap-down detection with arrows
• Live stats table (movable to any corner)
• “HUGE” / “BIG” / “Normal” status with emoji
• Built-in alerts for huge moves, volume spikes & gaps
Perfect for:
→ Day traders hunting momentum
→ Swing traders catching breakouts
→ Scalpers riding volume explosions
→ Anyone who wants to see the hottest movers at a glance
Works on ANY symbol, ANY timeframe.
Zero lag. Zero repainting. Pure price + volume truth.
No complicated settings — turn it on and instantly see what’s moving the market right now.
Not financial advice. Just the sharpest scanner on TradingView.
Made with love for the degens, apes, and momentum chads & volume junkies.

HC HighCrew Multi-Timeframe RSI Tracker A cross-timeframe momentum alignment engine that synchronizes RSI readings from short-term to macro intervals (1m–4h).
Each timeframe is classified as bullish, bearish, or neutral based on threshold bands, allowing the system to measure whether momentum is unified or fragmented across the market structure.
When the majority align in one direction, the tracker identifies consensus control — a key signal for sustained continuation or early reversal exhaustion.
Designed to simplify complex confluence analysis by showing clear alignment states inside one terminal panel.
Use cases: trend confirmation, confluence validation, bias alignment across RSI layers.

VipPro VWAP Momentum Tracker — Auto Buy/Sell + Fibonacci TPVipPro VWAP Momentum Tracker is an auxiliary tool designed to complement the main VipPro Realtime indicator.
It is primarily used on lower timeframes to filter false entries and refine intraday precision.
The script combines VWAP (Volume Weighted Average Price) with short-term momentum analysis and Fibonacci-based target projection.
It automatically generates two technical profit levels derived from Fibonacci extensions — 1.27 and 1.61 — providing a structured approach to short-term trade management.
VWAP acts as the dynamic reference line (orange).
When price is above VWAP, it reflects buying pressure and potential long setups.
When price is below VWAP, it suggests selling pressure and potential short opportunities.
The VWAP represents the market’s fair-value zone based on both price and volume, making it one of the most reliable metrics for identifying institutional positioning and volume-weighted trend direction.
This tool can be used independently or in combination with VipPro Realtime, especially when confirming signals from the upper dashboard that summarizes:
Market trend
Liquidity conditions
Momentum strength
RSI and volatility context
Overbought/Oversold signals
Results may vary depending on the trader’s experience and ability to interpret market structure in conjunction with VWAP behavior and momentum alignment.

Luxy Adaptive MA Cloud - Trend Strength & Signal Tracker V2Luxy Adaptive MA Cloud - Professional Trend Strength & Signal Tracker
Next-generation moving average cloud indicator combining ultra-smooth gradient visualization with intelligent momentum detection. Built for traders who demand clarity, precision, and actionable insights.
═══════════════════════════════════════════════
WHAT MAKES THIS INDICATOR SPECIAL?
═══════════════════════════════════════════════
Unlike traditional MA indicators that show static lines, Luxy Adaptive MA Cloud creates a living, breathing visualization of market momentum. Here's what sets it apart:
Exponential Gradient Technology
This isn't just a simple fill between two lines. It's a professionally engineered gradient system with 26 precision layers using exponential density distribution. The result? An organic, cloud-like appearance where the center is dramatically darker (15% transparency - where crossovers and price action occur), while edges fade gracefully (75% transparency). Think of it as a visual "heat map" of trend strength.
Dynamic Momentum Intelligence
Most MA clouds only show structure (which MA is on top). This indicator shows momentum strength in real-time through four intelligent states:
- 🟢 Bright Green = Explosive bullish momentum (both MAs rising strongly)
- 🔵 Blue = Weakening bullish (structure intact, but momentum fading)
- 🟠 Orange = Caution zone (bearish structure forming, weak momentum)
- 🔴 Deep Red = Strong bearish momentum (both MAs falling)
The cloud literally tells you when trends are accelerating or losing steam.
Conditional Performance Architecture
Every calculation is optimized for speed. Disable a feature? It stops calculating entirely—not just hidden, but not computed . The 26-layer gradient only renders when enabled. Toggle signals off? Those crossover checks don't run. This makes it one of the most efficient cloud indicators available, even with its advanced visual system.
Zero Repaint Guarantee
All signals and momentum states are based on confirmed bar data only . What you see in historical data is exactly what you would have seen trading live. No lookahead bias. No repainting tricks. No signals that "magically" appear perfect in hindsight. If a signal shows in history, it would have triggered in real-time at that exact moment.
Educational by Design
Every single input includes comprehensive tooltips with:
- Clear explanations of what each parameter does
- Practical examples of when to use different settings
- Recommended configurations for scalping, day trading, and swing trading
- Real-world trading impact ("This affects entry timing" vs "This is visual only")
You're not just getting an indicator—you're learning how to use it effectively .
═══════════════════════════════════════════════
THE GRADIENT CLOUD - TECHNICAL DETAILS
═══════════════════════════════════════════════
Architecture:
26 precision layers for silk-smooth transitions
Exponential density curve - layers packed tightly near center (where crossovers happen), spread wider at edges
75%-15% transparency range - center is highly opaque (15%), edges fade gracefully (75%)
V-Gradient design - emphasizes the action zone between Fast and Medium MAs
The Four Momentum States:
🟢 GREEN - Strong Bullish
Fast MA above Medium MA
Both MAs rising with momentum > 0.02%
Action: Enter/hold LONG positions, strong uptrend confirmed
🔵 BLUE - Weak Bullish
Fast MA above Medium MA
Weak or flat momentum
Action: Caution - bullish structure but losing strength, consider trailing stops
🟠 ORANGE - Weak Bearish
Medium MA above Fast MA
Weak or flat momentum
Action: Warning - bearish structure developing, consider exits
🔴 RED - Strong Bearish
Medium MA above Fast MA
Both MAs falling with momentum < -0.02%
Action: Enter/hold SHORT positions, strong downtrend confirmed
Smooth Transitions: The momentum score is smoothed using an 8-bar EMA to eliminate noise and prevent whipsaws. You see the true trend , not every minor fluctuation.
═══════════════════════════════════════════════
FLEXIBLE MOVING AVERAGE SYSTEM
═══════════════════════════════════════════════
Three Customizable MAs:
Fast MA (default: EMA 10) - Reacts quickly to price changes, defines short-term momentum
Medium MA (default: EMA 20) - Balances responsiveness with stability, core trend reference
Slow MA (default: SMA 200, optional) - Long-term trend filter, major support/resistance
Six MA Types Available:
EMA - Exponential; faster response, ideal for momentum and day trading
SMA - Simple; smooth and stable, best for swing trading and trend following
WMA - Weighted; middle ground between EMA and SMA
VWMA - Volume-weighted; reflects market participation, useful for liquid markets
RMA - Wilder's smoothing; used in RSI/ADX, excellent for trend filters
HMA - Hull; extremely responsive with minimal lag, aggressive option
Recommended Settings by Trading Style:
Scalping (1m-5m):
Fast: EMA(5-8)
Medium: EMA(10-15)
Slow: Not needed or EMA(50)
Day Trading (5m-1h):
Fast: EMA(10-12)
Medium: EMA(20-21)
Slow: SMA(200) for bias
Swing Trading (4h-1D):
Fast: EMA(10-20)
Medium: EMA(34-50)
Slow: SMA(200)
Pro Tip: Start with Fast < Medium < Slow lengths. The gradient works best when there's clear separation between Fast and Medium MAs.
═══════════════════════════════════════════════
CROSSOVER SIGNALS - CLEAN & RELIABLE
═══════════════════════════════════════════════
Golden Cross ⬆ LONG Signal
Fast MA crosses above Medium MA
Classic bullish reversal or trend continuation signal
Most reliable when accompanied by GREEN cloud (strong momentum)
Death Cross ⬇ SHORT Signal
Fast MA crosses below Medium MA
Classic bearish reversal or trend continuation signal
Most reliable when accompanied by RED cloud (strong momentum)
Signal Intelligence:
Anti-spam filter - Minimum 5 bars between signals prevents noise
Clean labels - Placed precisely at crossover points
Alert-ready - Built-in ALERTS for automated trading systems
No repainting - Signals based on confirmed bars only
Signal Quality Assessment:
High-Quality Entry:
Golden Cross + GREEN cloud + Price above both MAs
= Strong bullish setup ✓
Low-Quality Entry (skip or wait):
Golden Cross + ORANGE cloud + Choppy price action
= Weak bullish setup, likely whipsaw ✗
═══════════════════════════════════════════════
REAL-TIME INFO PANEL
═══════════════════════════════════════════════
An at-a-glance dashboard showing:
Trend Strength Indicator:
Visual display of current momentum state
Color-coded header matching cloud color
Instant recognition of market bias
MA Distance Table:
Shows percentage distance of price from each enabled MA:
Green rows : Price ABOVE MA (bullish)
Red rows : Price BELOW MA (bearish)
Gray rows : Price AT MA (rare, decision point)
Distance Interpretation:
+2% to +5%: Healthy uptrend
+5% to +10%: Getting extended, caution
+10%+: Overextended, expect pullback
-2% to -5%: Testing support
-5% to -10%: Oversold zone
-10%+: Deep correction or downtrend
Customization:
4 corner positions
5 font sizes (Tiny to Huge)
Toggle visibility on/off
═══════════════════════════════════════════════
HOW TO USE - PRACTICAL TRADING GUIDE
═══════════════════════════════════════════════
STRATEGY 1: Trend Following
Identify trend : Wait for GREEN (bullish) or RED (bearish) cloud
Enter on signal : Golden Cross in GREEN cloud = LONG, Death Cross in RED cloud = SHORT
Hold position : While cloud maintains color
Exit signals :
• Cloud turns ORANGE/BLUE = momentum weakening, tighten stops
• Opposite crossover = close position
• Cloud turns opposite color = full reversal
STRATEGY 2: Pullback Entries
Confirm trend : GREEN cloud established (bullish bias)
Wait for pullback : Price touches or crosses below Fast MA
Enter when : Price rebounds back above Fast MA with cloud still GREEN
Stop loss : Below Medium MA or recent swing low
Target : Previous high or when cloud weakens
STRATEGY 3: Momentum Confirmation
Your setup triggers : (e.g., chart pattern, support/resistance)
Check cloud color :
• GREEN = proceed with LONG
• RED = proceed with SHORT
• BLUE/ORANGE = skip or reduce size
Use gradient as confluence : Not as primary signal, but as momentum filter
Risk Management Tips:
Never enter against the cloud color (don't LONG in RED cloud)
Reduce position size during BLUE/ORANGE (transition periods)
Place stops beyond Medium MA for swing trades
Use Slow MA (200) as final trend filter - don't SHORT above it in uptrends
═══════════════════════════════════════════════
PERFORMANCE & OPTIMIZATION
═══════════════════════════════════════════════
Tested On:
Crypto: BTC, ETH, major altcoins
Stocks: SPY, AAPL, TSLA, QQQ
Forex: EUR/USD, GBP/USD, USD/JPY
Indices: S&P 500, NASDAQ, DJI
═══════════════════════════════════════════════
TRANSPARENCY & RELIABILITY
═══════════════════════════════════════════════
Educational Focus:
Detailed tooltips on every input
Clear documentation of methodology
Practical examples in descriptions
Teaches you why , not just what
Open Logic:
Momentum calculation: (Fast slope + Medium slope) / 2
Smoothing: 8-bar EMA to reduce noise
Thresholds: ±0.02% for strong momentum classification
Everything is transparent and explainable
═══════════════════════════════════════════════
COMPLETE FEATURE LIST
═══════════════════════════════════════════════
Visual Components:
26-layer exponential gradient cloud
3 customizable moving average lines
Golden Cross / Death Cross labels
Real-time info panel with trend strength
MA distance table
Calculation Features:
6 MA types (EMA, SMA, WMA, VWMA, RMA, HMA)
Momentum-based cloud coloring
Smoothed trend strength scoring
Conditional performance optimization
Customization Options:
All MA lengths adjustable
All colors customizable (when gradient disabled)
Panel position (4 corners)
Font sizes (5 options)
Toggle any feature on/off
Signal Features:
Anti-spam filter (configurable gap)
Clean, non-overlapping labels
Built-in alert conditions
No repainting guarantee
═══════════════════════════════════════════════
IMPORTANT DISCLAIMERS
═══════════════════════════════════════════════
This indicator is for educational and informational purposes only
Not financial advice - always do your own research
Past performance does not guarantee future results
Use proper risk management - never risk more than you can afford to lose
Test on paper/demo accounts before using with real money
Combine with other analysis methods - no single indicator is perfect
Works best in trending markets; less effective in choppy/sideways conditions
Signals may perform differently in different timeframes and market conditions
The indicator uses historical data for MA calculations - allow sufficient lookback period
═══════════════════════════════════════════════
CREDITS & TECHNICAL INFO
═══════════════════════════════════════════════
Version: 2.0
Release: October 2025
Special Thanks:
TradingView community for feedback and testing
Pine Script documentation for technical reference
═══════════════════════════════════════════════
SUPPORT & UPDATES
═══════════════════════════════════════════════
Found a bug? Comment below with:
Ticker symbol
Timeframe
Screenshot if possible
Steps to reproduce
Feature requests? I'm always looking to improve! Share your ideas in the comments.
Questions? Check the tooltips first (hover over any input) - most answers are there. If still stuck, ask in comments.
═══════════════════════════════════════════════
Happy Trading!
Remember: The best indicator is the one you understand and use consistently. Take time to learn how the cloud behaves in different market conditions. Practice on paper before going live. Trade smart, manage risk, and may the trends be with you! 🚀

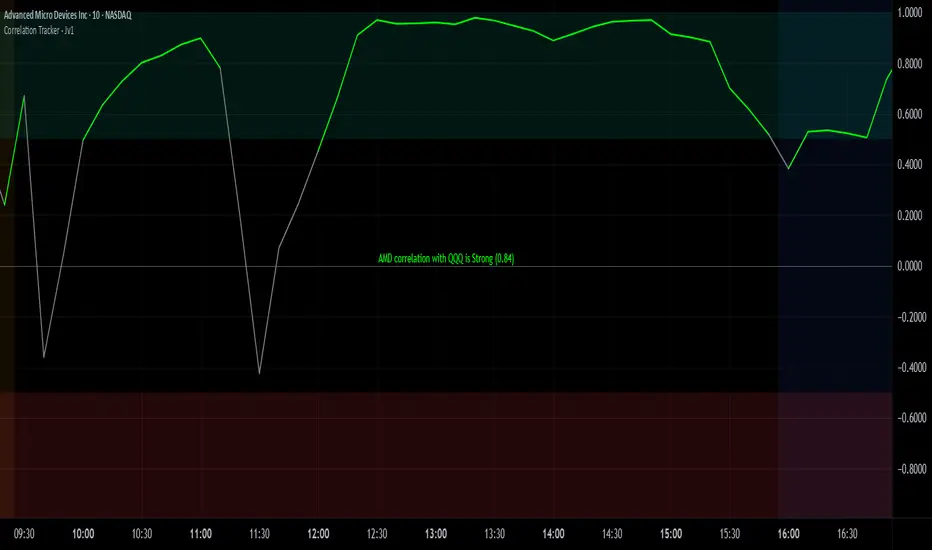
Correlation Tracker - Joe v1Correlation Tracker – Joe v1
This indicator calculates the correlation between a selected ticker and an index over a user-defined period. It visualizes correlation with color-coded lines, thresholds, and a descriptive rating, helping traders quickly gauge the strength and direction of correlation.
________________________________________
Options and What They Do
General Settings
• Symbol: Select the ticker you want to analyze.
• Use Chart Symbol: If enabled, the script will use the symbol of the current chart instead of a manually selected symbol.
• Index: Choose the reference index or asset to compare the correlation against. Default is NASDAQ:QQQ.
• Length: Sets the number of periods used to calculate correlation via a moving average. Shorter lengths respond faster; longer lengths smooth correlation.
Correlation Rating Settings
• Show Correlation Rating: Display a textual description of correlation strength (e.g., Ultra Strong, Moderate, Weak).
• Position: Choose where the correlation rating table will appear on the chart (Top/Bottom, Left/Center/Right).
Correlation Line Settings
• Positive Color: Line color when correlation is above the positive threshold. Default: green.
• Negative Color: Line color when correlation is below the negative threshold. Default: red.
• Neutral Color: Line color when correlation is between thresholds. Default: gray.
Correlation Thresholds
• Positive – From: Minimum correlation value considered positive. Default: 0.5 (range 0–0.9).
• Positive Color BG: Background color fill for positive correlation range.
• Negative – From: Maximum correlation value considered negative. Default: -0.5 (range -0.9–0).
• Negative Color BG: Background color fill for negative correlation range.
________________________________________
How It Works
1. Calculates correlation between the selected ticker and the index using logarithmic returns.
2. Plots the correlation line with colors based on thresholds: positive (green), negative (red), neutral (gray).
3. Displays a correlation rating table showing strength (Ultra Weak → Ultra Strong) and absolute correlation on a 0–1 scale.
4. Allows customization of visual appearance, thresholds, and position of rating for clarity on any chart.
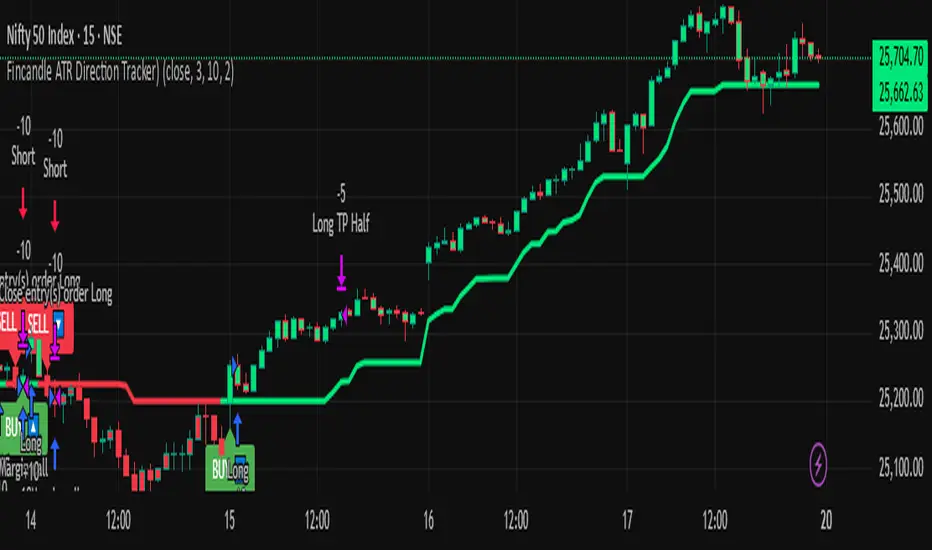
Fincandle ATR Direction TrackerOverview
The Fincandle ATR Direction Tracker is a strategy designed to capture momentum moves in the market using a dynamic ATR-based trailing stop. It identifies strong momentum candles and filters signals using trend alignment with moving averages.
Partial exits allow users to take a portion of profit at a predefined ATR multiple while keeping the remaining position open until the opposite signal occurs.
How It Works
Momentum Detection:
Measures candle body size relative to the Average True Range (ATR).
A candle is considered momentum if its body size exceeds ATR × Multiplier.
Trend Filter:
Uses two moving averages (Fast MA and Slow MA) to determine the market trend.
Bullish trend: Fast MA > Slow MA → long trades allowed
Bearish trend: Fast MA < Slow MA → short trades allowed
Trend filter can be toggled on or off.
ATR Trailing Stop:
A dynamic trailing stop adapts to price volatility.
Crossing above the trail triggers a buy signal, crossing below triggers a sell signal.
Partial Exit / Take Profit:
Step 1: Exit 50% of the position when price moves a configurable multiple of ATR in your favor.
Step 2: Close the remaining position when the opposite signal occurs (e.g., price crosses below/above the ATR trail).
How to Use
Add the strategy to any chart (stocks, indices, forex, crypto).
Configure ATR period, sensitivity, take profit multiple, and moving average lengths to suit the timeframe and asset.
Monitor buy/sell markers and dynamic ATR trail on the chart.
Optional: Set alerts for real-time notifications when signals trigger.
Adjust partial exit multiplier to control risk/reward.
Example Settings
ATR Period: 10
ATR Sensitivity: 3 × ATR
Take Profit: 2 × ATR
Fast MA: 50
Slow MA: 200
Partial Exit: 50% of position at take profit, remaining exits on opposite signal
Key Features
Adaptive ATR trailing stop for volatility-based entries/exits.
Trend alignment filter with Fast/Slow MA.
Partial exit logic for better risk management.
Visual BUY/SELL markers and alerts.
Fully Pine Script v6 compatible.
Disclaimer
This strategy is for educational and analytical purposes only.
It does not guarantee profits. Traders should always use proper risk management.
Dual Options Price Tracker – Visualize Call & Put StrikesDescription:
This innovative indicator provides a unique, real-time visualization of both Call and Put option prices for the same strike price directly on your TradingView chart. Designed for active options traders, it simplifies the analysis of price action for specific strikes, helping you quickly identify significant levels and potential shifts in market interest.
important : choose only put strike call strike automatically plot on chart
This indicator works with Indian market (nifty , banknifty ,sensex ,crudeoil , naturalgas )
Key Features:
Integrated Call & Put Prices: Clearly displays the prices of both Call and Put options for a user-defined strike price within the same indicator pane, offering an immediate side-by-side comparison.
Real-time Data: Plots live option price updates, allowing you to monitor the dynamic interplay between Calls and Puts throughout the trading session.
Intuitive Visualization: Transforms complex options data into easily digestible lines on your chart, making it easier to spot trends, relative strength, and support/resistance levels at crucial strikes.
User-Friendly Inputs: Simple input fields allow you to easily select the underlying symbol, expiry date, and the specific strike price you wish to monitor.
Enhanced Options Analysis: A valuable tool for gauging market participants' expectations and positioning at key psychological or technical levels.
How to Use:
Add the "Dual Options Price Tracker" to your chart.
The indicator will then plot the corresponding Call and Put prices on your chart in real time.
Important Note:
This indicator provides a visual tool for options analysis and does not constitute financial advice.
Options trading involves significant risk and may not be suitable for all investors.
Users are encouraged to combine this tool with their own comprehensive analysis and risk management strategies.

Multi-Symbol Volatility Tracker with Range DetectionMulti-Symbol Volatility Tracker with Range Detection
🎯 Main Purpose:
This indicator is specifically designed for scalpers to quickly identify symbols with high volatility that are currently in ranging conditions . It helps you spot the perfect opportunities for buying at lows and selling at highs repeatedly within the same trading session.
📊 Table Data Explanation:
The indicator displays a comprehensive table with 5 columns for 4 major symbols (GOLD, SILVER, NASDAQ, SP500):
SYMBOL: The trading instrument being analyzed
VOLATILITY: Color-coded volatility levels (NORMAL/HIGH/EXTREME) based on ATR values
Last Candle %: The percentage range of the most recent 5-minute candle
Last 5 Candle Avg %: Average percentage range over the last 5 candles
RANGE: Shows "YES" (blue) or "NO" (gray) indicating if the symbol is currently ranging
🔍 How to Identify Trading Opportunities:
Look for symbols that combine these characteristics:
RANGE column shows "YES" (highlighted in blue) - This means the symbol is moving sideways, perfect for range trading
VOLATILITY shows "HIGH" or "EXTREME" - Ensures there's enough movement for profitable scalping
Higher candlestick percentages - Indicates larger candle ranges, meaning more profit potential per trade
⚡ Optimal Usage:
Best Timeframe: Works optimally on 5-minute charts where the ranging patterns are most reliable for scalping
Trading Strategy: When you find a symbol with "YES" in the RANGE column, switch to that symbol and look for opportunities to buy near the lows and sell near the highs of the ranging pattern
Risk Management: Higher volatility symbols offer more profit potential but require tighter risk management
⚙️ Settings:
ATR Length: Adjusts the Average True Range calculation period (default: 14)
Range Sensitivity: Fine-tune range detection sensitivity (0.1-2.0, lower = more sensitive)
💡 Pro Tips:
The indicator updates in real-time, so monitor for symbols switching from "NO" to "YES" in the RANGE column
Combine HIGH/EXTREME volatility with RANGE: YES for the most profitable scalping setups
Use the candlestick percentages to gauge potential profit per trade - higher percentages mean more movement
The algorithm uses advanced statistical analysis including standard deviation, linear regression slopes, and range efficiency to accurately detect ranging conditions
Perfect for day traders and scalpers who want to quickly identify which symbols offer the best ranging opportunities for consistent buy-low, sell-high strategies.

Weekly pecentage tracker by PRIVATE
Settings Picture below this link: 👇
i.ibb.co
What it is
A lightweight “Weekly % Tracker” overlay that lets you manually enter weekly performance (in percent) for XAUUSD + up to 10 FX pairs, then shows:
a small table panel with each enabled symbol and its % result
one TOTAL row (Sum / Average / Compounded across all enabled symbols)
an optional mini badge showing the % for a single selected symbol
Nothing is auto-calculated from price—you type the % yourself.
Key settings
Panel: show/hide, position, number of decimals, colors (background, text, green/red).
Total mode:
Sum – adds percentages
Average – mean of enabled rows
Compounded –
(
∏
(
1
+
𝑝
/
100
)
−
1
)
×
100
(∏(1+p/100)−1)×100
Symbols:
XAUUSD (toggle + label + % input)
10 FX pairs (each has On/Off, label text, % input). You can rename labels to any symbol text you want.
Mini badge: show/hide, position, and symbol to display.
How it works
Overlay indicator: overlay=true; just draws UI on the chart (no plots).
Arrays (syms, vals, ons) collect the row data in order: XAU first, then FX1…FX10.
Helpers:
posFrom() converts a position string (e.g., “Top Right”) into a position.* constant.
wp_col() picks green/red/neutral based on the sign of the %.
wp_round() rounds values to the selected decimals.
calc_total() computes the TOTAL with the chosen mode over enabled rows only.
Table creation logic:
Counts how many rows are enabled.
If none enabled or panel is off: the panel table is deleted, so no box/background is visible.
If enabled and on: the panel is (re)created at the chosen position.
On each last bar (barstate.islast), it clears the table to transparent (bgcolor=na) and then fills one row per enabled symbol, followed by a single TOTAL row.
Mini badge:
Always (re)created on position change.
Shows selected symbol’s % (or “-” if that symbol isn’t enabled or has no value).
Colors text green/red by sign.
Notes & limits
It’s manual input—the script doesn’t read trades or P/L from price.
You can rename each row’s label to match any symbol name you want.
When no rows are enabled, the panel disappears entirely (no empty background).
Designed to be light: only draws tables; no heavy plotting.
If you want the TOTAL row to be optional, or different color thresholds, or CSV-style export/import of the values, say the word and I’ll add it.

Inefficient Candle TrackerThe Inefficient Candle Tracker indicator highlights large, inefficient price moves and plots their midpoints as Squared Up Points.
Detects large candles using Percentile or ATR multiple methods
Draws dynamic dashed lines at candle midpoints until price “squares them up”
Built-in alerts for new SUP creation and when levels are touched
Great for spotting unfinished business in price action, confluence with support/resistance, and potential return levels.

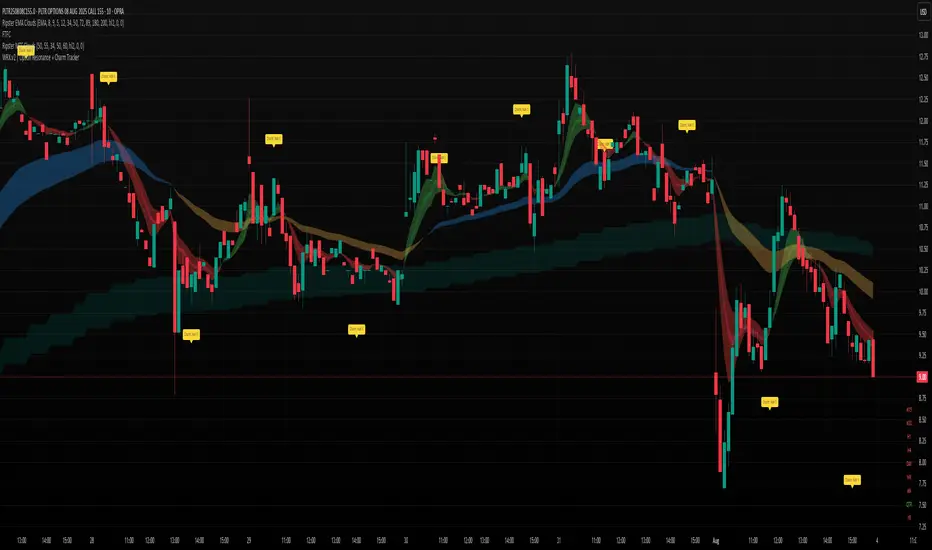
WRX.v2 | Option Resonance + Charm TrackerINSPIRED by RIPSTER
Charm tracker
Options use only
Charm vomma