TopTenAlgo 8. Elliottwave Cycle EN: The Elliottwaves Cycle Oscillator is an indicator that allows the detection of impulsive (impulsive / ascend) or corrective (correction / fall) waves, ie each cycle (cycle) in Elliott Waves . The aim is to measure the speed of a real trend and to predict returns. In the uptrend or impulsive movement, Cycle continues its movement in the upper band after the price is set on a certain band, while in the downtrend or corrective move, the Cycle continues its movement in the lower band.
This algorithm is prepared with @Top10Algo ...
TR: Elliottwaves Cycle Osilatörü Elliott Dalgalarında ki impulsive (itkisel/yükseliş) yada corrective (düzeltme/düşüş) dalgaların yani her bir siklus’ un (cycle) önceden tespit edilmesini sağlayan bir göstergedir. Amaç gerçek bir trendin hızını ölçmek ve geri dönüşleri önceden tespit etmektir. Yükseliş trendi içinde yada impulsive bir harekette fiyat belli bir banda oturduktan sonra Cycle üst band’ da hareketine devam ederken, düşüş trendi içinde yada corrective bir harekette fiyat belli bir banda oturduktan sonra Cycle alt bandda hareketine devam eder.
Bu algoritma @Top10Algo ile beraber hazırlanmıştır...
Search in scripts for "wave"

VWAP OscillatorToday I'm proposing a simple VWAP oscillator script to trade buy and sell waves more easily.
You trade this similar to how you trade Awesome Oscillator, so if you want an explanation just look up YT videos.
In addition to that, this will also show volume squeezes, please note that this is a makeshift way and not real volume squeeze phenomena of volume profile and tape. None the less, it is quite good at allowing you to ride out good trending waves and locate weak price action due to volume squeeze. You can turn off bar coloring from settings if you don't want this.
For ease of reading, I've also applied Allenstars Dynamic zones on this indicator so you can easily locate where the reading is entering in long and where it is in sell, this is compared to selected sample size. I've already selected the most common setting for that, so you don't really need to fiddle with it unless you find something better.
This indicator can be used to trade divergences as well, in fact, I feel it is better for that compared to RSI/MACD, the usual suspects.
Past performance is not assurance of future performance and this idea is published for only educational purposes, author taken no responsibility for your profit or loss.
Hodl Wave v1.0Hodl Wave identifies waves and shows market strength. It's perfect companion to Hodl SR indicator.

Fianchetto v1Hello, I created this script last year I decided I would release it to the public. This script uses Moving Averages to attack or defend price action given the current conditions of the market. This strategy is ONLY for currencies I would NOT recommend using on any other markets. This strategy is wrong about 55% of the time so use at your own risk. This strategy has 2 main focuses, 1. Catching trends and riding trends 2. Defending Profits from a Trend, as a trend starts to form you want to make sure you can get the most juice out of the trend while also ensuring profit taking throughout the trend. This algorithm uses moving averages in a more creative way than just trading crossover's, we use a small MA to use it's direction of travel as a traffic light while using a bigger MA as a filter for our trade bias (bear or bull). Our Traffic light or small MA is what ensures we are defending profits as when the traffic light switches colors we close our trade even if our filter is still the same bias. This however does not mean we are done trading the current trend wave, We wait for our traffic light to switch back to the same bias as our filter to re-enter the trade. I will be updating this system as time goes on, if you have any questions or problems please pm me, QuantsGambit

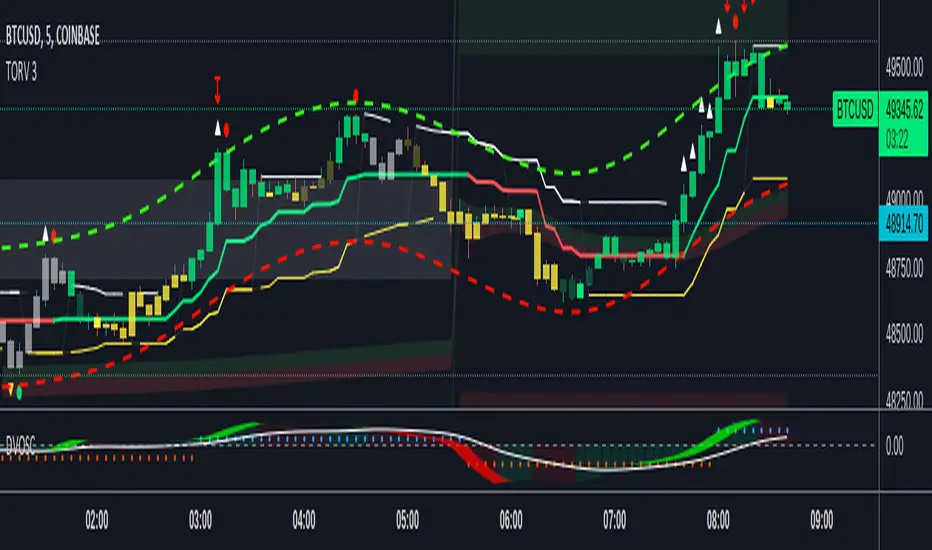
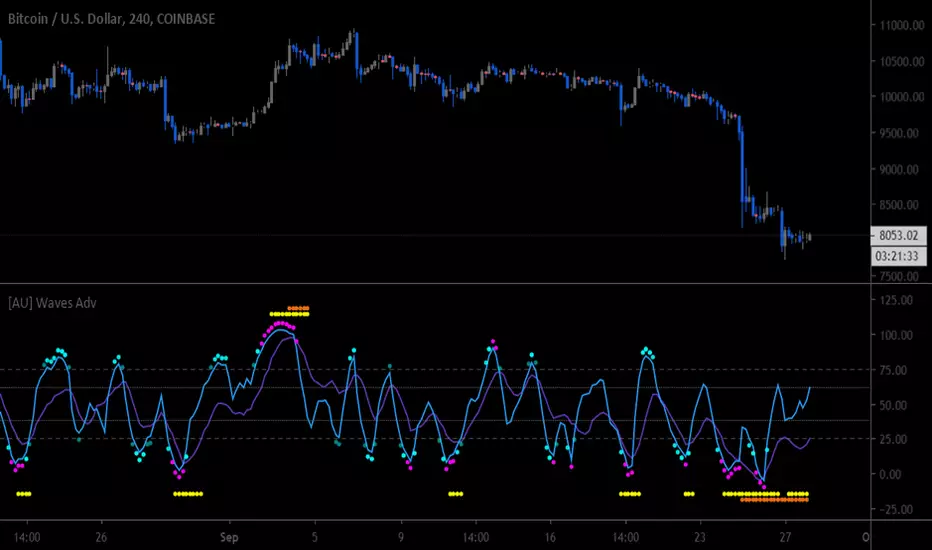
Market Waves Alpha All-In-One IndicatorMarket Waves Alpha Indicator is a part of the Market Waves All-In-One indicators. It provides indicators on top of the candles which give accurate information on where the market it heading. It is important to familiarize yourself with the different keys available in Market Waves Alpha Indicator . These indicators appear above each candle, but it is important to wait until the candle actually closes before reacting on them. To make things a little easier, we are going to look at each indicator on its own and compare it with market price to see how it performs.
Blood & Red Diamond
These are suppose to be showing you when there is bearish momentum in the trend. Blood & Red Diamonds mean strong bearish momentum.
Yellow Cross – Market Manipulation
This indicator can identify when there is market manipulation about to occur, so be careful with your trade! Let’s see it in action:
Red Cross – Bearish Indicator
The red cross above the candle shows that there is bearish signals showing, so be careful!
Green Dot
The green dot that appears above the candles on Market Waves Alpha Indicator is suppose to where there is bullish intent:
The image above shows 2 green dots that appeared on 1 hour time frame. Clearly, the green dot appear followed by a large spike in price.
Blue Triangle
The blue triangle on Market Waves Alpha Indicator lets you know when there is a trend change, so if price action currently looks bullish the triangle lets you know that we are now in a bearish zone. Let’s take a look at this indicator:
EMA Ribbon
EMA ribbon can be used to identify the trend. Price is above the EMA ribbon when the trend is bullish and below the EMA ribbon when the trend is bearish.
This indicator is recommended to be used with Market Waves Omega Indicator for additional confirmation:
M waves Mk3 'Magical M's v1
V2
V3
So I forgot this existed so here is the Opened sourced code (pm me for older sorce code there are 600+ Saves)(pm me for other scrips course code too lazy to republish everything)
Changes: Simplified and annotated code/upgraded to v4 format
as always adjust before using
i use this indicator combined with the other frequency one to help me identify time and direction of next move.
Pair with rsi
Pair with detrended tsi (have unpublished script might share later)
‘Redraw’ safe
Slightly detrented(adjustable) to avoid traps
quick how to use:
Meant as and adjustable indicator to “tune" to personal risk/reward preference
Green means buy red means sell
arrow indicators for long term sell and buy
Highly customizable (candles too)
Check out my profile for previous versions they are less customizable but also easier to get started with
similar to rsi you want to buy/sell when the indicator turns green/red and lines are as pinched as posible (the lines that are being filled).
keep an eye on the other line that moves around ;) if its not matching the other 2 moving averages and the main color indicator chances are its a trap(works both ways)
use the candles to help you keep your eye on the indicator when scalping (look at the original post for some color ideas)


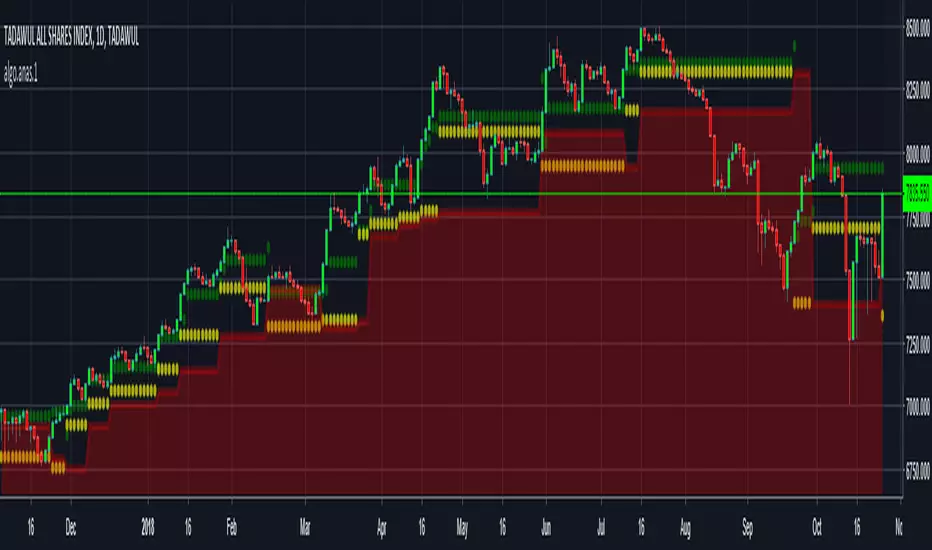
Price Action based indicator to visualize waves and trendsANAS indicator is a proprietary script that quickly analyze price action and plot 3 price levels around each bar. Namely, green level, yellow level, and red zone. You will easily be able to identify current trend, support/resistance levels, wave count, targets and stops by studying different patterns and scenarios evolving around each bar. When applying the indicator to the same symbol on two different time frames, you differently got an edge!
Nothing can explain things more than giving it a try.
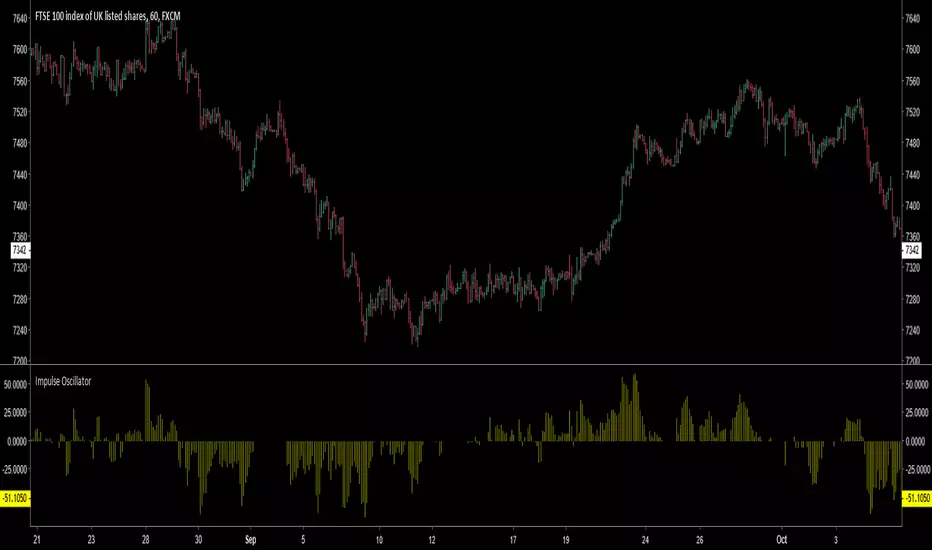
Impulse Oscillator without legs for Price Action & Elliott WavesHi Traders,
I have a newcomer for impulsetrading.
This indicator is an oscillator that show without legs impulses of Price Action .
For the expertise: you can use it for counting elliott waves !
Have fun and winning trades!
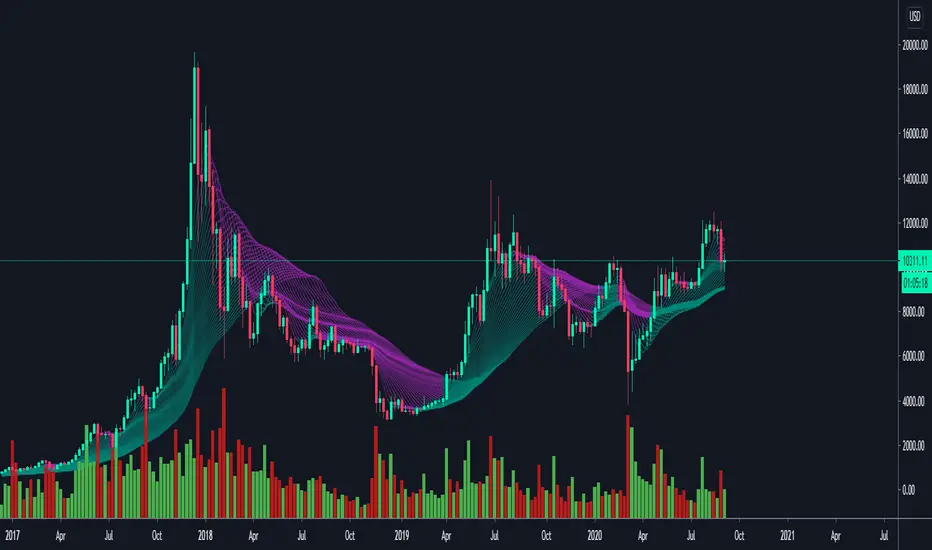
Kumo WavesKumo Waves is included in the Richimoku Traiding System.
Kumo Waves (Indentify divergences, trends, investor sentiment. Know First. Act Faster. A must-have for every trader!)
*As some indicators you may come across are using the repainting mode (which consists in correcting the false signal back in time).
You'll never see such thing in the Richimoku Trading System. What's on the charts is displayed in real time, no cheating...
Feel free to test Kumo Waves or the Richimoku Trading System For 12 hours! Study the chart history on all timeframes. Study all details incl. divergences, trend and investor sentiment etc.
FAQ.
How to access Kumo Waves in tradingview?
To access your indicator simply click on “Indicators” at the top of your Chart, and click on “Invite-Only Scripts”. Click on the indicator to activate it. That’s it!
Will Kumo Waves work for Stock and Index trading?
Sure! It works on all Forex, Stocks, Indexes, Metals and Crypto's!
Does this indicator work with a free TradingView Account?
Yes you can use Kumo Waves or the Richimoku Indicator Trading System with a free TradingView account.
Does the indiators work on all timeframes?
Yes, the indicators can be used on all time frames!


MACD Waves SignalsThia is a standard MACD inclucing thoses signals:
- White line, you are at the possible bottom or top of a flag or a reversal. See it, a warning.
- Green line , possible bullish reversal.
- Red line , possible bearish reversal.
How to use :
- Simply do your waves analysis using the standard MACD of the indicator.
- At critical prices in your analysis, a corresponding bar can help to validate your forecast.
- Do not do your forecast only based on signals.
Happy trading!

Multiple Moving Averages (Rainbow Waves)Two moving averages with toggle for Rainbow Wave mode (total of 16 equally spaced moving averages)

EMA Wave and GRaB Candles by JustUncleLThis is a specialised Price Action Channel (PAC) or Wave that mirrors the indicator used by Raghee Horner, the "34EMA Wave and GRaB Candles".
The Wave consist of:
34 period exponential moving average on the high
34 period exponential moving average on the close
34 period exponential moving average on the low
The GRaB candles colour scheme:
Lime = Bull candle closed above Wave
Green = Bear candle closed above Wave
Red = Bull candle closed below Wave
DarkRed = Bear candle closed below Wave
Aqua = Bull candle closed inside Wave
Blue = Bear candle closed inside Wave
Optionally display a trend direction indication along bottom of chart.
References:
For some details on how Raghee uses this indicator check out this:
www.forexfactory.com
Also her various training and webinar videos on Youtube
Note: This code is licensed under open source GPLv3 terms and conditions. Any modifications to it should be made public and linked to the original code.

MC Waves OscillatorMC Waves Oscillator © is one of the five MC Fractal Studies ©
MC Fractal Studies (c) disassemble the market data in an objective way and organize charts information in order to identify all the various Waves on all the various fractal scales, that make up the typical market charts, and show them to the eyes of investors in an inclusive but detailed way.
The ability to view and examine the multi-scale fractal market structure of a chart can immensely help an investor, giving him an edge that can be used to increase trading performance.

MC Waves SizeMC Waves Size © is one of the five MC Fractal Studies ©
MC Fractal Studies (c) disassemble the market data in an objective way and organize charts information in order to identify all the various Waves on all the various fractal scales, that make up the typical market charts, and show them to the eyes of investors in an inclusive but detailed way.
The ability to view and examine the multi-scale fractal market structure of a chart can immensely help an investor, giving him an edge that can be used to increase trading performance.

MC Wave Structure OnChartMC Wave Structure OnChart © is one of the five MC Fractal Studies ©
MC Fractal Studies (c) disassemble the market data in an objective way and organize charts information in order to identify all the various Waves on all the various fractal scales, that make up the typical market charts, and show them to the eyes of investors in an inclusive but detailed way.
The ability to view and examine the multi-scale fractal market structure of a chart can immensely help an investor, giving him an edge that can be used to increase trading performance.

Elliot Wave OscillatorEWO Indicator, helps to indentify waves
Similar like LazyBear's Indicator: ElliotWave Oscillator
I extended and changed the following:
Allow custom SMA interval default 5 and 35. Dont use EMAs
Choose input source: default close, f.e. use HL2
Show difference of SMAs in percent based on current candle default "true", this is very useful for historical charts

[RS]MTF Donchian Range Wave Sync V1EXPERIMENTAL: using Donchian channels with diferent lengths to extract multiple time frame's to extract price in range rates. the title may be a tiny bit misleading tho -_-''
update: reversed colors, joined the line zone space to make the waves visually stand out more.
