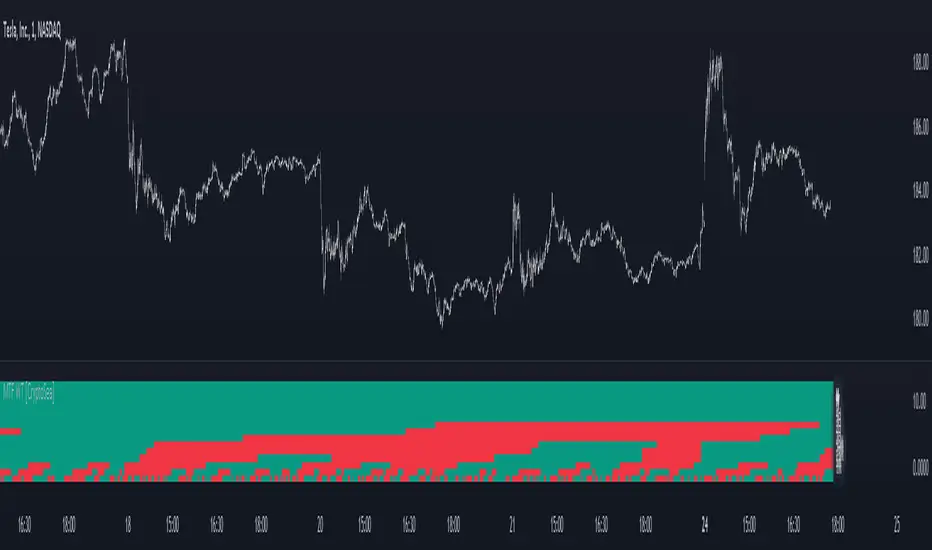
MTF WaveTrend [CryptoSea]The MTF WaveTrend Indicator is a sophisticated tool designed to enhance market analysis through multi-timeframe WaveTrend calculations. This tool is built for traders who seek to identify market momentum and potential reversals with higher accuracy.
In the example below, we can see all the choosen timeframes agree on bearish momentum.
Key Features
Multi-Timeframe WaveTrend Analysis: Tracks WaveTrend values across multiple timeframes to provide a comprehensive view of market momentum.
Customizable Colour Rules: Offers three different colour rules (Traditional, WT1 0 Rule, WT1 & WT2 0 Rule) to suit various trading strategies.
Timeframe Visibility Control: Allows users to enable or disable specific timeframes, providing flexibility in analysis.
Clear Visual Indicators: Uses color-coded squares and labels to clearly display WaveTrend status across different timeframes.
Candle Colouring Option: Includes a setting for neutral candle coloring to enhance chart readability.
This example shows what can happen when all timeframes start alligning with eachother.
How it Works
WaveTrend Calculation: Computes the WaveTrend oscillator by applying a series of exponential moving averages and scaling calculations.
Multi-Timeframe Data Aggregation: Utilizes the `request.security` function to gather and display WaveTrend values from various timeframes without repainting issues.
Conditional Plotting: Displays visual cues only when higher timeframes align with the selected timeframe, ensuring relevant and reliable signals.
Dynamic Colour Rules: Adjusts the indicator colors based on the chosen rule, whether it's a traditional crossover, WT1 crossing zero, or both WT1 & WT2 crossing zero.
Traditional: Colors are determined by the relationship between WT1 and WT2. If WT1 is greater than WT2, it is bullish (bullColour), otherwise bearish (bearColour).
WT1 0 Rule: Colors are based on whether WT1 is above or below zero. WT1 above zero is bullish (bullColour), below zero is bearish (bearColour).
WT1 & WT2 0 Rule: A more complex rule where both WT1 and WT2 need to be above zero for a bullish signal (bullColour) or both below zero for a bearish signal (bearColour). If WT1 and WT2 are not in agreement, a neutral color (neutralColour) is displayed.
This indicator will make sure that the lowest timeframe you can see data from will be the timeframe you are on. This is to avoid false signals as you cannot display 3 x 5 minute candles whilst looking at the 15 minute candle.
Application
Strategic Decision-Making: Assists traders in making informed decisions by providing detailed analysis of WaveTrend movements across different timeframes.
Trend Confirmation: Reinforces trading strategies by confirming potential reversals with multi-timeframe WaveTrend analysis.
Customized Analysis: Adapts to various trading styles with extensive input settings that control the display and sensitivity of WaveTrend data.
The MTF WaveTrend Indicator by is an invaluable addition to a trader's toolkit, offering depth and precision in market trend analysis to navigate complex market conditions effectively.
Search in scripts for "wave"
[GYTS-CE] Signal Provider | WaveTrend 4D with QMCWaveTrend 4D with Quantile Median Crosses (Community Edition)
🌸 " 📡 Signal Provider" in GoemonYae Trading System (GYTS) 🌸
WaveTrend 4D (WT4D) is an extension of the incredible WaveTrend 3D (2022, Justin Dehorty) . This oscillator elevates the classic WaveTrend by integrating advanced mathematical models for a multi-dimensional view of market momentum, capturing subtle shifts and trends that traditional indicators might miss. Each oscillator layer uses a combination of normalised derivatives, hyperbolic tangent transformations, and dual-pole filtering (John Ehlers' SuperSmoother), providing normalised and smooth signals with minimised lag.
The name "WaveTrend 4D" is derived from the usage of 4 dimensions, representing different frequencies or timeframes. Next to the "fast", "normal" and "slow" frequency, the fourth frequency is called "lethargic" (very slow). This gives the opportunity utilise more dimensions without having abundant signals, since we quantify and filter the quality of signals.
WT4D strives to help discriminating high-quality signals from the indicator by introducing the Gradient Divergence Measure (GDM) and Quantile Median Crosses (QMC). For simplicity, speed and focus, this particular indicator includes only the QMC part. Check the other 🤲Community Edition of this indicator that focuses on the GDM. For QMC, see below for more information.
🌸 --- QUANTILE MEDIAN CROSSES (QMC) --- 🌸
💮 Introduction
--
A powerful approach when working with WaveTrend is to use the frequencies' crossings of the median (zero) line. This would signify a continuation of the reversal. However, not all of those crossings would be trades with a high probability of success. For this reason, we strive to only consider reversals after the most strong trends start to show weakness. We call these reversals the "Quantile Median Crosses" (QMC), deriving the name from the used methodology.
💮 Methodology
--
To find these "most strong trends", we calculate the integral ("the area") of a frequency between all historical median crosses, and take an upper quantile of those integrals. This means that when the frequency is crossing the median in a period of consolidation, the areas between those crosses would be small. But if there was a strong momentum, and the frequency would separate itself significantly from the median and would do so for a long time, its area would be large.
So after considering all the past integrals, we take the upper quantile of those (i.e. sort all integrals and for example take the top 5%) and if the latest trend's integral was in this upper quantile, it is considered "significant". Hence, the name "quantile" in the name "Quantile Median Cross".
💮 QMC on the Oscillator
--
The QMC is shown as a label "🔴" above the median or with "🟢" below the median. The normal frequency has a "bronze" colour, the slow frequency "silver" and the lethargic is "gold". In addition to the labels, there are also diamond shapes in the same colour drawn on the median in the oscillator. This represents the previous median crossing, and helps the user to see between which two points the integral is calculated.
🌸 --- GOEMONYAE TRADING SYSTEM --- 🌸
As previously mentioned, this indicator is a 📡 Signal Provider, part of the suite of the GoemonYae Trading System (🤲 Community Edition). The greatest value comes from connecting multiple 📡 Signal Providers to the 🧬 Flux Composer to find confluence between signals. Contrary to most other indicators that connect with each other, the signals that are passed are not just binary signals ("buy" or "sell") but pass the actual GDM and QMC values. This gives the opportunity in the 🧬 Flux Composer to more accurately use multiple signals with different strengths to finally give an overall signal. On its turn, the Flux Composer can be connected to the GYTS "🎼 Order Orchestrator" for backtesting and trade automation.

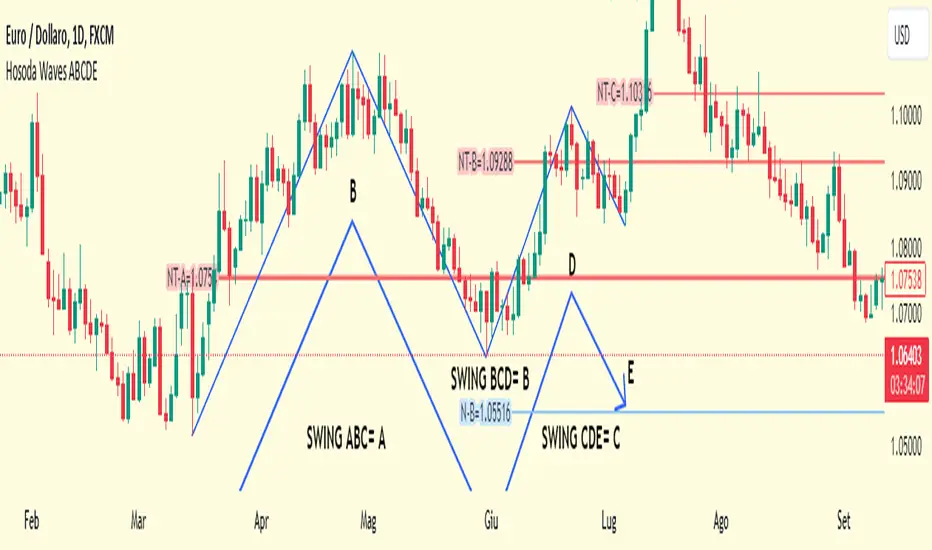
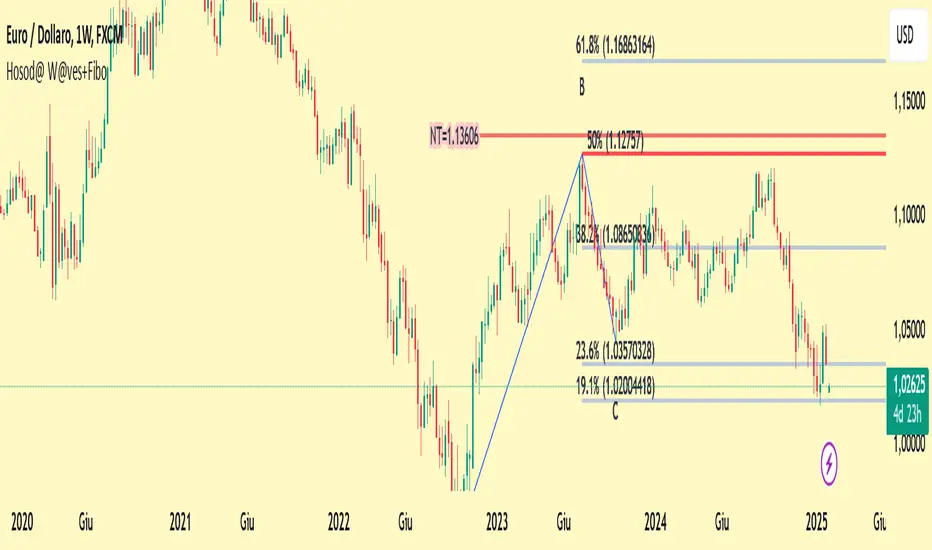
Hosoda Waves ABCDEThe Hosoda Waves indicator was devised by Goichi Hosoda, who is also the creator of the Ichimoku system, with the idea that previous highs and lows could determine future price ranges that the market would react to.
Hosoda's projections are the NT, N, V, and E waves, which are derived from calculations based on both upward and downward ABC swings.
Hosoda's waves are derived from the following calculations:
NT Wave = C + (C - A)
N Wave = B + (B - A)
V Wave = B + (B - C)
E Wave = C + (B - A)
There are already scripts for the Hosoda waves, and my idea is to project an ABCDE swing simultaneously, meaning projecting three swings:
ABC, indicated with an A, resulting in NT-A, N-A, V-A, E-A.
BCD, indicated with a B, resulting in NT-B, N-B, V-B, E-B.
CDE, indicated with a C, resulting in NT-C, N-C, V-C, E-C.
Once the indicator is applied to the chart, the interactive Pine Script tool version 5 will prompt you to identify 5 points of "low-high-low-high-low" or "high-low-high-low-high," both for upward and downward movements and mixed.
Once clicked, these price points can be moved. If you change the time frame or market instrument, the indicator must be removed because it remains tied to the prices where it was initially drawn.
Weis Wave With Speed Index SignalsWeis Wave with Speed Index Signals
The Concept
This indicator has been created to try to quantify "Change in Behavior" concept and provide buy and sell based on this concept. What is Change in Behavior? Price is moving at speed rate based on the trading volume direction (buyers and sellers) until there is imbalance of Supply/Demand. An algorithm has been created to identify this change of Supply/Demand behavior producing a number called "Speed Index". Abnormal Speed Index notes this change in behavior when compared with previous Speed Index numbers of the same pair and in the same timeframe. Speed Index is a relevant number and it's use is to be compared with previous Speed Index numbers and not as an absolute number. Based on Speed Index Behavior of recent waves, price and price wave structure buy and sell signals are available called Plutus.
What it does
This indicator draws a waveline of price waves swings. Up swing is when price goes up and down swing is when price goes down. It adds the volume of each bar within the wave swing, it measures the distance in pips of each swing and measure the numbers of bars of each swing. Furthermore, it creates the Speed Index of each swing, the average Speed Index of x selectable wave swings back as well as the average of Speed Index of the x up swings back and the average of the down swing. The indicator is also able to designate a Fast wave which means large pip move with small volume with the letter "F" displayed next to Speed Index and a Slow wave which small pip move with small volume with the letter "S". Finally based on price, Speed Index history and structure it creates eight buy/sell signals called Plutus.
Information available for display all selectable
For each wave swing: Total Volume, Pip Distance, Number of Bars or Total Volume + Pips or Total Volume + Pip Distance+Total Number of Bars
For each wave swing: Speed Index or Total Volume + Speed Index or Speed Index + Average Speed Index or Speed Index+(F or S).
Plutus buy and sell signals when criteria of price location, speed index comparison (abnormal speed index) and wave price structure have been met.
How it does it
This indicator draws a wave-line of price waves swings. Wave Sensitivity can be adjusted by AutoSensitivity parameter (min value =2 and max value=11). The larger the number the more sensitive it is, which means more wave swings will be created. All calculations are based on each wave swing. The code calculates all the above mentioned on the "Information available for Display" section. Based on price, Speed Index history, Speed Index ratio and structure Plutus buy and sell signals are created. The default value of Speed Index ratio is 2. Decreasing Speed Index ratio will create more signals while increasing it will create less signals.
Note: last wave re-paints and no information is displayed on the forming wave, but the whole trading methodology is based on reading previous waves information.
Technical Information
Speed Index
High Speed Index number means a slow wave "S" = Abnormal Speed (high volume small pip move)
Low Speed Index number means a fast wave "F" =Anormal Speed (small volume large pip move)
Normal Speed Index number (are the more frequent numbers seen in the chart which means that the market agrees with the move).
Plutus Signals
PL - Plutus Long, this is when the price will follow in the same direction of the wave with the High Speed Index. When signal is generated we enter when price close breaks the previous two wave structure Resistance Level
PS - Plutus Short, same as above, this is when the price will follow in the same direction of the wave with the High Speed Index. When signal is generated, we enter when price close breaks the previous two wave structure Support Level
PRL - Plutus Reversal Long, this is when the price will go in the opposite direction of the wave with the High Speed Index.
PRS - Plutus Reversal Short, same as above, this is when the price will go in the opposite direction of the wave with the High Speed Index.
PFL - Plutus Fake Long, this when price will do a fast break of the previous down swing bottom and then comes back within the previous swing range (fake break)
PFL - Plutus Fake Short, this when price will do a fast break of the previous up swing top and then comes back within the previous swing range (fake break)
WU - Wyckoff Upthrust plutus (short signal)- this is when the last two swings resemble(are) Wyckoff's UpThrust pattern price swings. This resemblance together with Speed Index criteria and price break of structure create this signal.
WS - Wyckoff Spring plutus(long signal)- this is when the last two swings resemble(are) Wyckoff's pattern price swings. This resemblance together with Speed Index criteria and price break of structure create this signal.
How to use it
Draw Support/Resistance and Fib - usually supply and demand imbalance happens at his level
First and most important of all adjust AutoSesnsitivity to get your swings correct, meaning that are catching the tops and bottoms of each price wave swing.
Monitor Speed Index behavior. Be alerted from Abnormal Speed Index number. You can also set using the Extreme Threshold parameter that provide you an alert if the current Speed Index is above or below average Speed Index of x waves back and also meets the min and max bar criteria. For example if we would like to be alerted for a an Abnormal Speed Index of a Slow wave of at 3 bars then we have set the Min Slow Bar parameter to 3, the Extreme Threshold parameter to 0.5 (50%) and the Avg Waves back to 8 then an alert will be produced if the wave before the forming has at least 3 bars and the Speed Index of the wave is 50% higher than the Average Speed Index calculated from 8 waves back. For a Fast wave we can set the Min Fast Bars to 1, Extreme Threshold to 50% and Avg Waves back to 8 which means that we will get an alert if the wave before the forming one has at least 1 bar and it's Speed Index is at least 50% less than the Speed Index Average of 8 waves back.
Plutus signals provide buy and sell entries after specific criteria have been met. These signals have a higher success rate when price is exiting a range or when price is leaving from Support/Resistance or Fib. Consider Plutus signals invalid within a range unless is the exit of the range (Range Break)
What makes it unique
The ability to identify, quantify and be alerted of the Change in Behavior of waves swings when compared with recent previous wave swings making it easier for the trader to be notified about Supply / Demand imbalance. Furthermore, another unique point of this indicator is the Plutus signals providing buy and sell entries. Plutus entries take into consideration this Abnormal Behavior, the wave swings structure and price location.
Example Trades
Wyckoff Up- rust formation strategy- Reading the chart
1. We have broken a Resistance Level with a Fast Speed Index of 0.7F
2. Abnormal Speed Index of 2.3 provides the alert for abnormal Speed Index behavior. There is not a high Speed Index like that in all the up wave swings which automatic makes it abnormal Supply Demand imbalance.
3. WU - Wyckoff Up-trust plutus signal has been created, which means Short.
4. PRS - Plutus Reversal Short also created at the same location which makes the Short even a higher probability trade
5. Entry: We enter Short on the close of the bar
Exit from Range Strategy - Reading the chart
1. We are in a Ranging environment
2. PS and PRS are invalid signals because according to the rules mentioned previously we do not trade any signals created within the range when the price does not break the range.
3. PRL - Plutus Reversal Long which means that price will move in the opposite direction of the High Speed Index (the 2.2) is a valid signal since price breaks the top of the range
4. Entry Long after breaking the top of the range
PRL after Support hit Strategy and Exit from Range Strategy - Reading the chart
In this we have two different strategies available. The first one is Plutus Reversal Long signal after hitting support and the second on an Exit from Range.
The Story:
1. We have hit support (double bottom)
2. Speed Index 2.2 at the bottom is on the High side, not too extreme but on the high side.
3. A PRL long signal is generated which means that price will move in the opposite direction of the 2.2 Speed Index
4. Entry Long on the close of the bar- This trade has provided 482 pips of profit
5. Price goes into Range
6. Classic textbook strategy Exit from Range with Plutus. We get a PL Plutus Long signal which means price will follow the directions of the high Speed Index wave and in this case is the 2.7 wave
7. Entry Long after the range break. This trade provided 384 pips up to now.

Elliott Wave Theory [Alerts]This indicator may be one of the first to provide signals & alerts for the Elliott Wave Theory Pattern. Unfortunately, there are few, if any, indicators that are public which allow the Elliott Wave Theory to be plotted+with alerts.
Because this is experimental, I'm going to offer access to it free of charge. Send me a direct message requesting access.
Elliott Wave Theory is a complex chart pattern to learn, and even harder to master. It requires being able to identify the wave lengths of price history and using various tools to plot and assess the price structure in order to find the wave counts. Whilst there are many ways to compute the waves apart of the pattern, there is no universal method that everyone would agree upon. For this indicator, I am using the traditional method.
The different colors represent different cycle types. Using it on a higher timeframe is strongly encouraged for best results.
This version currently provides alerts for the final wave, wave 5. I WILL BE ADDING MORE TO THIS INDICATOR SHORTLY, SEE BELOW:
-Will be adding the other counts to display all the waves
-Will be adding 'correction wave' alerts
-Will be adding 'inverse' pattern alerts
-Will be improving the the labels to include their cycle type
This is not a buy & sell indicator.. This is a TOOL to help analyze the market using Elliott Wave Theory.
The indicator should be used for the following:
-Aiding with EWT analysis
-Helping find potential exit points
-Assist with learning EWT by using this as a template
-Timing trades and improving risk management
-Plotting the overall market

SSL + Wave Trend StrategyStrategy incorporates the following features:
Risk management:
Configurable X% loss per stop loss
Configurable R:R ratio
Trade entry:
Based on strategy conditions below
Trade exit:
Based on strategy conditions below
Backtesting:
Configurable backtesting range by date
Trade drawings:
Each entry condition indicator can be turned on and off
TP/SL boxes drawn for all trades. Can be turned on and off
Trade exit information labels. Can be turned on and off
NOTE: Trade drawings will only be applicable when using overlay strategies
Alerting:
Alerts on LONG and SHORT trade entries
Debugging:
Includes section with useful debugging techniques
Strategy conditions
Trade entry:
LONG
C1: SSL Hybrid baseline is BLUE
C2: SSL Channel crosses up (green above red)
C3: Wave Trend crosses up (represented by pink candle body)
C4: Entry candle height is not greater than configured threshold
C5: Entry candle is inside Keltner Channel (wicks or body depending on configuration)
C6: Take Profit target does not touch EMA (represents resistance)
SHORT
C1: SSL Hybrid baseline is RED
C2: SSL Channel crosses down (red above green)
C3: Wave Trend crosses down (represented by orange candle body)
C4: Entry candle height is not greater than configured threshold
C5: Entry candle is inside Keltner Channel (wicks or body depending on configuration)
C6: Take Profit target does not touch EMA (represents support)
Trade exit:
Stop Loss: Size configurable with NNFX ATR multiplier
Take Profit: Calculated from Stop Loss using R:R ratio
Credits
Strategy is based on the YouTube video "This Unique Strategy Made 47% Profit in 2.5 Months " by TradeSmart.
It combines the following indicators to determine trade entry/exit conditions:
Wave Trend: Indicator: WaveTrend Oscillator by @LazyBear
SSL Channel: SSL channel by @ErwinBeckers
SSL Hybrid: SSL Hybrid by @Mihkel00
Keltner Channels: Keltner Channels Bands by @ceyhun
Candle Height: Candle Height in Percentage - Columns by @FreeReveller
NNFX ATR: NNFX ATR by @sueun123

Squeeze mom MTF filtered by Wavetrend with div (Tilt)📋 Description :
This script is based on two famous indicators from @Lazybear : Squeeze Momentum and WaveTrend. fr.tradingview.com
The idea is to use the Wavetrend crossovers and filter them according to the momentum curve.
There is a multi timeframe module with automatic selection of the higher timeframe. The user can also choose his timeframe manually.
There is also a detection of regular and hidden divergences
🛠 Options :
- filtering the cross wave trend according to the momemtum curve
- active or not higher timeframe with automatic or manually timeframe selection
- display or not WaveTrend ans squeeze momentum
- Show a tape that signals when wavetrend is overbought or oversold
- choose colors and apparences
- display a panel for the higher timeframe value

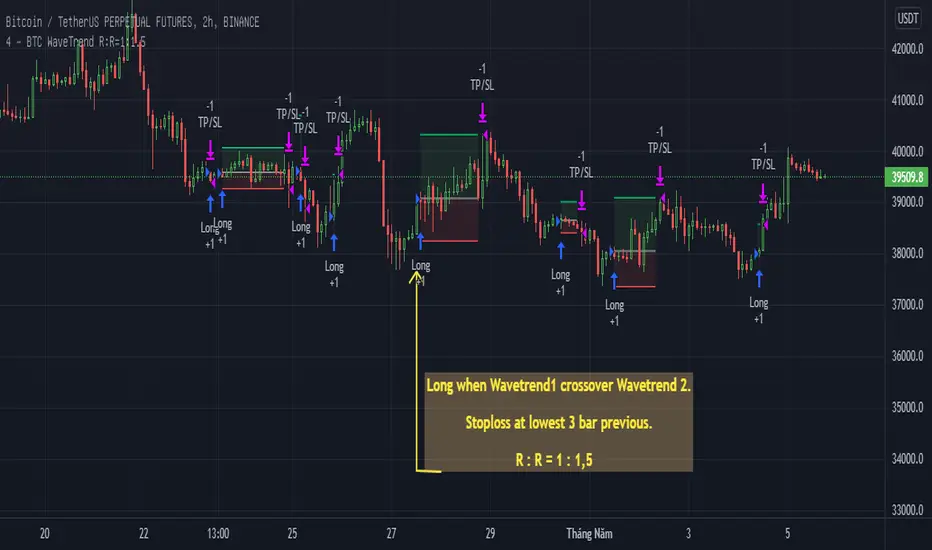
BTC WaveTrend R:R=1:1.5In this strategy, I used Wavetrend indicator (Lazy Bear).
It is very simple and easy to understanding: Long when Wavetrend1 crossover Wavetrend2 and they are less than a limit value (not buy when price overbought). Stoploss at lowest 3 bar previous. R:R = 1:1,5.
About other shortterm strategies for crypto market, you can view my published strategies.
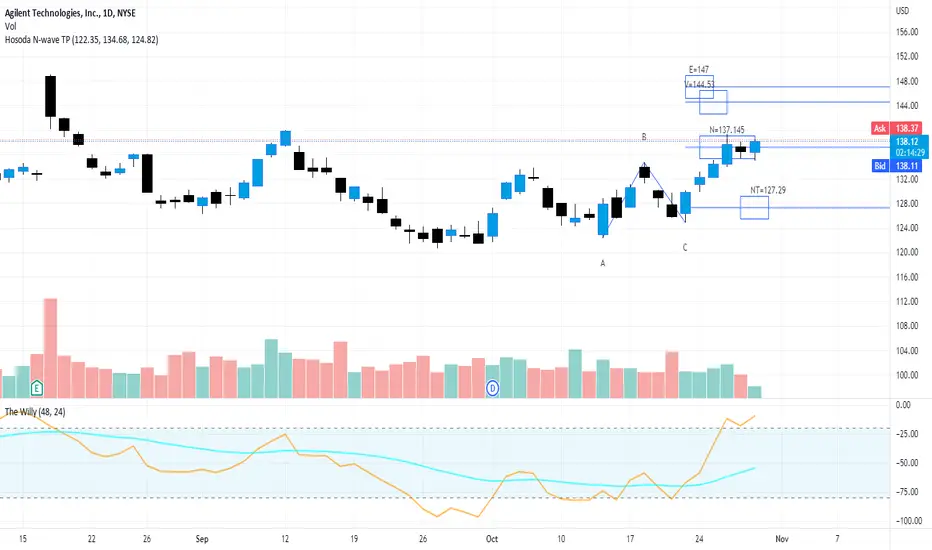
Hosoda N Wave and TPs {fmz}This script allows you to establish in a graphic and interactive way which are the N, NT, V and E targets for a Hosoda N wave.
Apply the indicator to the chart.
The interactive tool of Pine script version 5 will ask you to identify three points of "minimum-maximum-higher minimum" that form a bullish N wave of Hosoda (refer to the specific documentation for Hosoda N wave), or on the contrary three points "maximum-minimum-lower maximum" for a bearish N wave.
Once drawn, the price points can be moved.
When changing the market instrument, the indicator must be removed because it remains linked to the prices where it was first drawn.
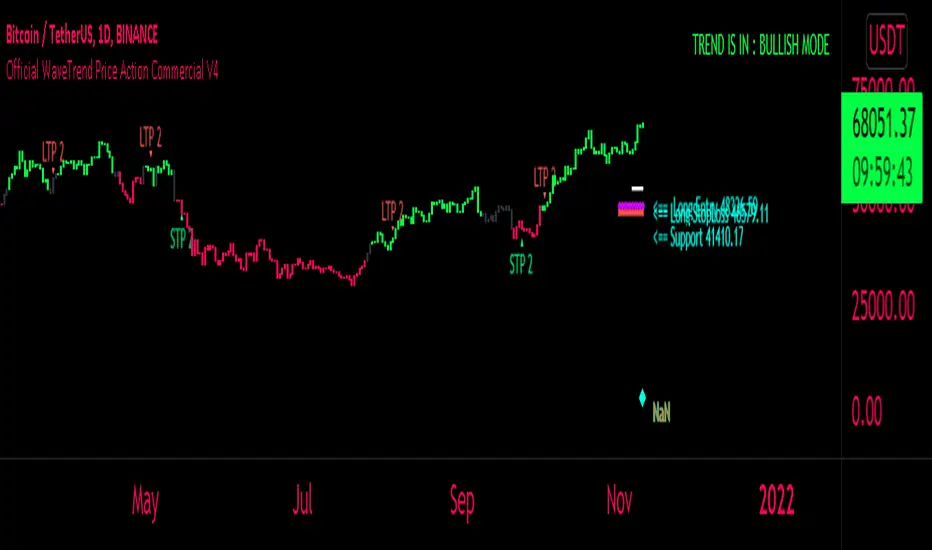
FaizanN Official WaveTrend Price Action Commercial PINEV4Hello Traders,
Here i bring you my first Price Action WaveTrend based Indictor combined with fib entry and exit trailing levels with minimum risk and maximum profit , as we must have seen at times as we enter the trend reverse and hits our stoploss . Keeping that in mind as i too struggled and made losses so i decided and focused more on minimizing the loss and only on confirmation Long or Short trade is been initiated along with Stoploss as explaned in the images below , why should we give market our money ;) as we are here to make money :D .. There is no holy grail as Stop loss wont be hit but yes it will be way less and all alerts are based on candle close ... One can use this on any chart and any timeframe and its very good for scalping too . Better results are on 15m and above . Hope you guys will like it and comment if you have any doubts..
-----------------
Disclaimer
Copyright by FaizanNawazz.
The information contained in my scripts/indicators/strategies/ideas does not constitute financial advice or a solicitation to buy or sell any securities of any type. I will not accept liability for any loss or damage, including without limitation any loss of profit, which may arise directly or indirectly from the use of or reliance on such information.
All investments involve risk, and the past performance of a security, industry, sector, market, financial product, trading strategy, or individual’s trading does not guarantee future results or returns. Investors are fully responsible for any investment decisions they make. Such decisions should be based solely on an evaluation of their financial circumstances, investment objectives, risk tolerance, and liquidity needs.
My scripts/indicators are only for educational purposes!
Happy Trading!
TradingGroundhog - Strategy & Wavetrend V2#-- Public Strategy - No Repaint - Fractals - Wavetrend --
Here I come with another script, a nice and simple strategy based on fractals and Wavetrends.
#-- Synopsis --
A simple idea, on a small time frame (15 min) we buy when the opening price goes below a Bottom fractals and sell when it goes over a Top fractals, but in order to avoid bad and evil downtrends, we use Wavetrends based on a Daily time frame. From it, Tops and Bottoms are extracted. If the opening price goes above Wavetrend Tops, no trades will be conducted during the day. If the price goes below Wavetrend bottoms, no trades will be executed from 1 to N days, until a new Wavetrend bottom is generated.
I developed the strategy using BTC /EUR 15 MIN BINANCE but it can be applied to many other cryptos, I don't know for forex or others. You can use it for long term and automated trading, I implemented the Wavetrend indicator to do so, or for short term if you have spot a long coming uptrend. Test it, look at its profit and long or short period on your crypto of choice.
#-- Graph reading --
And now, how to read it ?
Wavetrends:
Red Backgrounds are associated to No Trade periods. These periods occur when the price goes below a Wavetrend bottom or above a Wavetrend Top. They are here to limit the loss.
Blue Gradient lines represent the past Tops. For each bar, only the increasing values of the Wavetrend tops are acquired. Going from light to dark blue based on the age of the Tops. Thus, if on line goes from dark to light, this means the price is approaching a previous Wavetrend top. In the opposite, if it darken, thus the price say 'buy buy' and go dropping.
Yellow Gradient lines represent the past Bottoms. They are based on the same principe that the blue lines.
Fractals:
Yellow Flags occur when the opening price goes below a Bottom fractal , it means Buy.
White Flags appear when the opening price goes over a Top fractal , it means Sell.
#-- Parameters --
*** Parameters have been intensively optimized using 10 cryptocurrency markets in order to have potent efficiency for each of them. I would recommend to only change the Can Be touch parameter. For the others, I don't recommend any modifications. The idea behind the script is to be able to switch between markets without having to optimize parameters, less work, easy to target active crypto and therefor limit the risks. ***
Can be touch :
'Combined Smoothness' : The number of open individuals used by the Wavetrend. (6 or 9, often 9 is better but with less volatile crypto it will be 6)
'Filter fractals' : Activate or Disable the filtering fractal operation. If Enable, buy during less risky periods. (Disable is often better)
Can be touch but not necessary :
'VolumeMA' : The Volume corrector used by the fractals
'Extreme window' : The number of price individuals to look for if we want to remove extreme fractals.
Not to touch :
'Limit_candle to look on' : Number of candles to use to compute the Wavetrend Tops and Bottoms.
'Length top bottom drawn' : Size of the lines
'Long Sop Loss (%)' : The minimal difference of price between a Fractal bottom and the opening price to buy.
#-- Time frame --
Should be used with the following time frames depending on the necessity:
1 MIN
3 MIN (Interesting for short term profit, may need some parameter ajustements)
5 MIN
15 MIN (Preferred for long term profit, the script was developed on it)
#-- Last words --
The script can be set up to send Tradingview signals to 3comma just by adding comment = " " in strategy.close_all() and strategy.entry().
Good trades !
Disclaimer (As it should always be one to any script)
***
This script is intended for and only to be used for personal purposes only. No such information provided by it constitutes advice or a recommendation for any investment or trading strategy for any specific person. There is no guarantee presented or implied as to the accuracy of specific forecasts, projections, or predictive statements offered by the script. Users of the script agree that its original developer does not take responsibility for any of your investment decisions. Please seek professional advice before trading.
***
# Here are the results from the 1rst of July 2021 with 100% of equity on the BTC /EUR 15 Min and with a capital of 1 000 EUR.
# As I saw, it goes from +20% to more than +100% depending on the selected crypto. Sometimes it's negative but it's quite rare on crypto using the EUR.

MTF Wave Trend CrossThis indicator is based on the famous "Wave Trend Oscillator" by LazyBear.
I have noticed that the Wave Trend Crosses (not the waves themselves) give a pretty good indication on the current status of the market (above Zero = bullish / below Zero = bearish ).
This new indicator is a Multi TF Version of this where it is possible to define 4 fixed Higher Time Frames and 4 fixed Lower Time Frames.
The results are then plotted above (higher TF) and below (lower TF) of the result of the current TF. (Offset can be flexibly changed in the settings)
This allows to judge the trend based on the various TFs.
Basically the greener it looks, the more bullish the situation is at the moment. More red color indicates a more bearish situation.
Enjoy.

EMA Wave Indicator [LazyBear]This is a 3 EMA visualization tool. Relative momentum across 3 timeframes are rendered as A/B/C waves. Also, helpful in identifying spike/exhaustion bars.
When all the waves are in the same direction, the momentum is very high on that direction. I have made all options configurable, have fun tuning for your instrument :)
Complete list of all my indicators:
docs.google.com

Low-High Waves for NeowaveOpen your chart at daily and hide the symbol graphic. Now you can see the waves. It’s including limited data sorry for this but I’m not a programmer and TradingView have limitations.

WaveTrend with MFI and Auto/Manual HTFWaveTrend with MFI and Auto/Manual HTF
WaveTrend with MFI and Auto/Manual HTF
WaveTrend with MFI and Auto/Manual HTF
WaveTrend with MFI and Auto/Manual HTF

Elliott Wave — HYBRID BEAST MODE⭐ Elliott Wave — HYBRID BEAST MODE
Description (Copy/Paste for Publishing)
Elliott Wave — HYBRID BEAST MODE is an advanced, automated Elliott Wave detection engine that blends classical wave theory with modern algorithmic logic. This tool identifies impulsive waves, corrective structures, wave-strength conditions, and volume-enhanced Wave 3 confirmations — all while automatically adapting to any timeframe.
This script uses a hybrid approach:
• Elliott Oscillator (5/35 MA difference)
• Pivot-based wave structure detection
• Automated wave spacing (dynamic by timeframe)
• Fibonacci projection mapping
• Wave channels & structure geometry
• Dashboard for quick-read market conditions
• Automatic alerts for Wave 3, Wave 5, and corrective waves
Key Features
✔ Auto Wave Detection using pivot geometry and spacing logic
✔ Elliott Oscillator histogram for momentum confirmation
✔ Wave Labels (1–5, A–B–C) with intelligent spacing
✔ Adaptive Timeframe System that recalculates wave spacing automatically
✔ Wave 3 Strength Logic using your custom volume multiplier
✔ Fibonacci Levels for projection and confirmation
✔ Wave Channels for structure alignment
✔ Built-In Alerts for key high-probability moments
✔ Designed for 4H / Daily, but optimized for all timeframes
Use Cases
• Identifying impulsive wave cycles
• Confirming corrections & retracements
• Determining trend exhaustion
• Timing Wave 3 and Wave 5 extensions
• Integrating wave theory with oscillator momentum
This is a full Elliott Wave toolbox packed into one script — ideal for traders who want automatic structure detection without the subjectivity of manual wave counting.
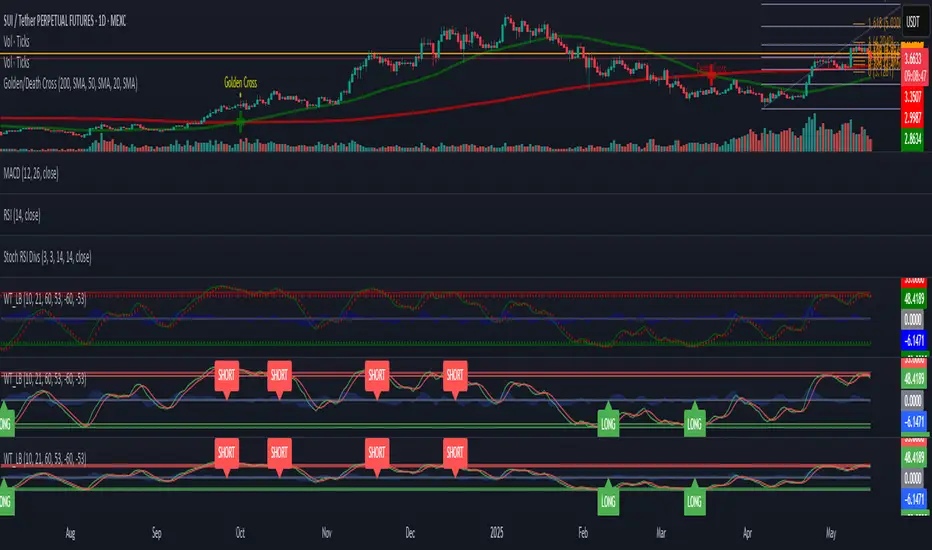
WaveTrend with CrossesWaveTrend with Crosses — Spot Golden & Dead Crosses with Precision!
WaveTrend with Crosses is a customized version of the classic WaveTrend oscillator, enhanced with clean visual signals to help you pinpoint momentum shifts through golden and dead crosses.
✅ Key Features
Momentum analysis based on WaveTrend (WT1 & WT2)
Detects Golden Cross (WT1 crosses above WT2) and
Dead Cross (WT1 crosses below WT2)
Customizable Overbought/Oversold zones (defaults: ±60, ±53)
Visual circle markers on valid crossovers for easy recognition
Built-in alert system to notify you of real-time cross signals
📊 How to Use
Add the indicator to your chart and choose your desired symbol & timeframe.
The blue shaded area shows the divergence between WT1 and WT2 — a visual cue for momentum buildup.
Circle markers:
Red circle: Dead cross — potential bearish momentum
Green circle: Golden cross — potential bullish reversal
Customize the settings to fit your personal trading strategy if needed.
🛠 User Inputs
n1, n2: Channel lengths (default: 10 and 21)
obLevel, osLevel: Overbought/Oversold thresholds (default: ±60 / ±53)
standardValue: Threshold used to validate significant crossovers (default: 60)
🔔 Alert System
Get notified with alerts like "Golden Cross" or "Dead Cross" when key crossovers occur,
helping you react quickly and confidently.
⚠️ Notes
Past performance is not indicative of future results — always backtest and use in conjunction with other tools.
Low timeframes may generate frequent signals; filtering or confirmation is recommended.
💡 Author's Note
Simple and effective — this tool is designed to focus solely on cross-based entries.
Ideal for momentum-based scalping or swing trading strategies.
Feel free to customize and tweak as needed! 😄

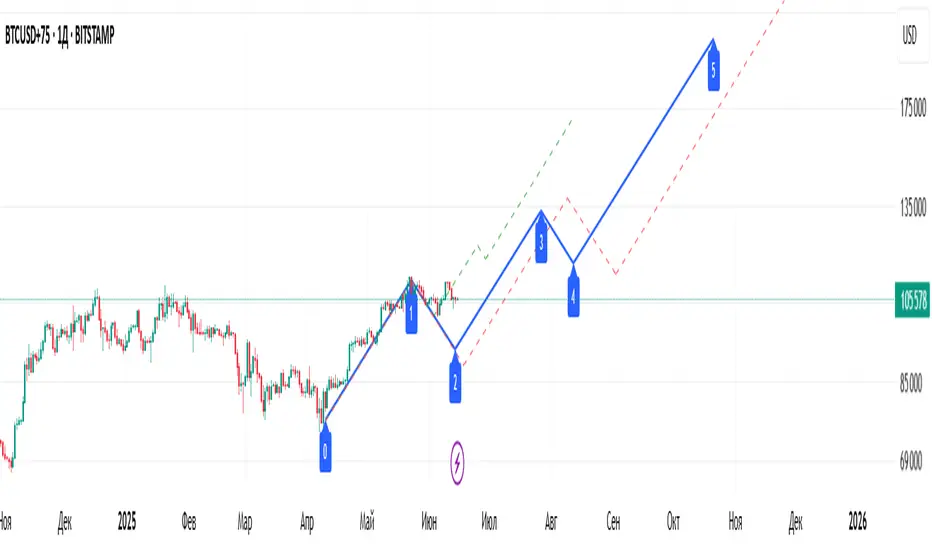
Elliott Wave Universal PRO [Full Ratios]Elliott Wave Universal PRO
Overview
This advanced Elliott Wave indicator helps traders identify and project potential wave structures with Fibonacci ratios. It supports both impulse and corrective patterns with multiple variations, providing visual projections for standard, minimal, and maximal wave extensions.
Key Features
✅ Multiple Wave Patterns
Impulse waves (Classic, Extended, Diagonal, Truncated, etc.)
Corrective waves (Zigzag, Flat, Triangle, Double/Triple Zigzag, etc.)
✅ Customizable Projections
Adjustable start/end points for wave labeling
Standard, minimal, and maximal Fibonacci-based projections
✅ Visual Customization
Color/style settings for different ratio types
Clean labeling for wave structure clarity
✅ Flexible Display
Toggle between impulse/correction modes
Enable/disable ratio projections as needed
How to Use
Set Points: Define the start (0) and first wave (A) using the input settings.
Select Pattern: Choose from impulse or correction templates.
Adjust Display: Customize colors, line styles, and ratio visibility.
⚠ Note: This tool is for educational purposes and should be used alongside other analysis methods. Past performance does not guarantee future results.
Elliott Wave Universal PRO
Обзор
Этот продвинутый индикатор волн Эллиотта помогает трейдерам определять и прогнозировать волновые структуры с использованием соотношений Фибоначчи. Поддерживает импульсные и коррекционные модели с различными вариациями, визуализируя стандартные, минимальные и максимальные проекции волн.
Основные функции
✅ Различные волновые модели
Импульсы (Классические, Удлиненные, Диагонали, Усеченные и др.)
Коррекции (Зигзаги, Плоскости, Треугольники, Двойные/Тройные зигзаги и др.)
✅ Настраиваемые проекции
Ручное задание точек начала (0) и первой волны (A)
Стандартные, минимальные и максимальные проекции на основе Фибоначчи
✅ Гибкость отображения
Настройка цветов и стилей линий
Четкие метки для удобного анализа структуры
✅ Управление отображением
Переключение между импульсами и коррекциями
Включение/отключение типов проекций
Как использовать
Установите точки: Задайте начало (0) и первую волну (A) во входных параметрах.
Выберите шаблон: Укажите тип структуры (импульс/коррекция).
Настройте отображение: Измените цвета, стили линий и видимость проекций.
⚠ Важно: Индикатор предназначен для образовательных целей. Используйте его в сочетании с другими методами анализа.
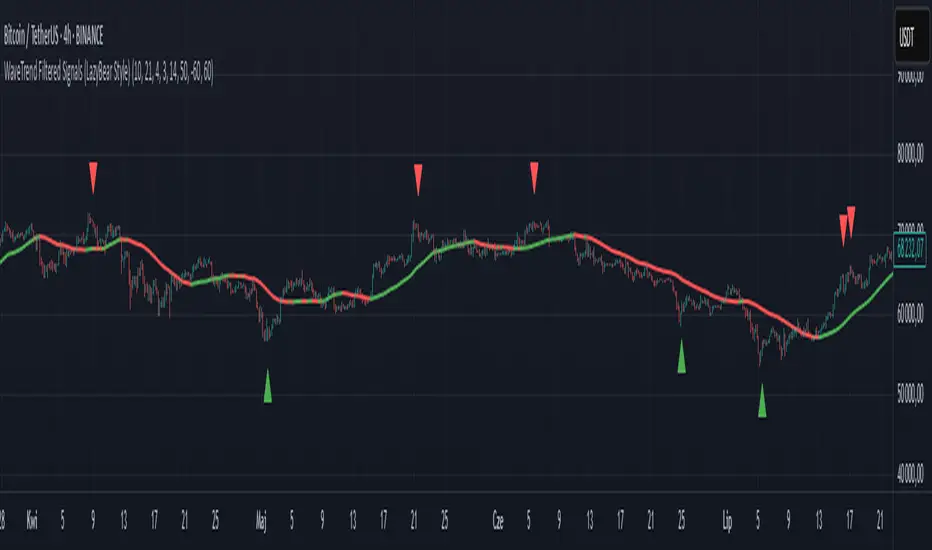
WaveTrend Filtered Signals (LazyBear Style)WaveTrend Filtered Signals (LazyBear Style)
This indicator is based on the popular WaveTrend oscillator (LazyBear) and adds several optional filters to improve signal quality:
✅ Available filters:
WT oversold/overbought zones – enabled by default. Signals are shown only if WT was previously in the specified zone (e.g., < -60 for longs, > 60 for shorts).
SMA trend filter – allows filtering signals in the direction of the moving average trend.
SMA position filter – signals appear only when price is above (for long) or below (for short) the moving average.
Consolidation filter – ignores signals during low-volatility sideways price movement.
💡 All filters are optional and can be enabled or disabled in the settings.
The default setup focuses on a clean approach: WaveTrend + oversold/overbought zones, with other filters left for customization.
WaveTrend [LazyBear] with Long/Short LabelsWaveTrend Oscillator with Entry Signals (LONG/SHORT) – Advanced Edition
This indicator is based on the renowned WaveTrend Oscillator by LazyBear, a favorite among professional traders for spotting trend reversals with precision.
🚀 Features:
Original WaveTrend formula with dual-line structure (WT1 & WT2).
Customizable overbought and oversold zones for visual clarity.
Automatic LONG and SHORT signals plotted directly on the chart:
✅ LONG: When WT1 crosses above WT2 below the oversold zone.
❌ SHORT: When WT1 crosses below WT2 above the overbought zone.
Momentum histogram shows strength of market moves.
Fully optimized for Pine Script v5 and lightweight across all timeframes.
🔍 How to use:
Combine with support/resistance levels or candlestick reversal patterns.
Works best on 15min, 1H, or 4H charts.
Suitable for all markets: crypto, stocks, forex, indices.
📊 Ideal for:
Traders seeking clean, reliable entry signals.
Reversal strategies with technical confluence.
Visual confirmation of WaveTrend crossovers without manual interpretation.
💡 Pro Tip: Combine with EMA or RSI filters to further enhance accuracy.
Hosoda Waves ABCThe Hosoda Waves indicator was devised by Goichi Hosoda, the creator of the Ichimoku system, with the idea that previous highs and lows could determine future price ranges to which the market would react. Hosoda's projections include the NT, N, V, and E waves, derived from calculations based on both upward and downward ABC swings. The calculations for Hosoda's waves are as follows:
NT Wave = C + (C - A)
N Wave = B + (B - A)
V Wave = B + (B - C)
E Wave = C + (B - A)
This indicator visually represents the calculations by Hosoda. Additionally, Hosoda indicated time cycles: 9, 17, 26, 33, 42, 51, 65, 76, etc., which are not integrated into this indicator as they are not considered effective in contemporary times.
Once applied to the chart, the interactive Pine Script tool version 5 will prompt you to identify 3 points of "low-high-low" or "high-low-high," both for upward and downward movements. Once clicked, these price points can be moved. If you change the time frame or market instrument, the indicator must be removed because it remains tied to the prices where it was initially drawn.
Wyckoff Wave Chart
What Is Wyckoff Wave Chart and How Does It Work?
It is the cumulative sum of exchanged (sold/bought) shares or contracts on a given wave (downward or upward) in a given time plotted on the chart.
Wyckoff Wave Chart for TradingView
Wyckoff Wave Chart is the best tool to identify turning points in all markets. Money plays in the market, not set ups. Therefore, in order to earn money, you must play in the same direction as the professionals! It is thanks to the observation of the volume that you can know which side the professionals (Smart Money) are on and trade in accordance with their direction. You can also "look" inside the chart and see on the numbers or graphical histogram who controls the market at a given moment - Buyer or the Seller.
Let's Start From The Beginning!
Wyckoff Wave Chart created by Richard Wyckoff in early 1930' were a breakthrough in technical analysis. In his famous technical analysis course, he told his students to "think like waves". Volume analysis was an integral part of his way of investing. During the period when Wyckoff was active in the financial markets wave volume was calculated manually, we now have a fully automated version for TradingView. Using Wyckoff Cumulative Volume you will be surprised how well it identifies turning points in all markets and on any time frame. This tool is very helpful in predicting trend changes in all markets like forex, crypto, futures and stocks.
In order for the indicator to work well on all charts, it is necessary to set the appropriate step in its settings.
"Step" is the wave setting to be taken into account when counting the volume on a given swing. The standard setting for each round is 30. This is the measure of pips on which the next upward or downward wave is to be counted. However, for individual assets, these settings can be adjusted individually.
Another important setting is the "Volume Divider" - the cumulative volume numbers on a given swing displayed on the chart will be different for different assets. In the case of penny stocks, it can be even millions of listed assets. In order for the chart not to display too long numbers, you can divide it by 1000 / 10000 / 100000. In the case of small intervals such as 1 or 5 minute charts, "O" may appear at the ends of swings. You should then reduce the "Volume Divider" to 1 or 10.
Accumulation example:

Harmonic Sine Waves model plot Hey,
Here is another tool that I created. I could not find anything similar.
This script is creating a sine wave, based on the given length, amplitude, horizontal vertical offset.
After this it plots also nearest harmonics to the base sine wave and draws it on the chart.
At the last step it sums up the value for base sine wave with its harmonics.
This is a great way to experience how 4 basic sine waves, when summed up, are creating more complex chart.
This shows that the 'chaotic' chart can be built on just a few most important factors.
You do not have to "know every single fact" about the asset to make a proper forecast.
You just need those most important.
It is crucial though, to offset the chart in a correct way, so it is in phase with the asset that we work on.
