Combo 2/20 EMA & Accelerator Oscillator (AC) This is combo strategies for get a cumulative signal.
First strategy
This indicator plots 2/20 exponential moving average. For the Mov
Avg X 2/20 Indicator, the EMA bar will be painted when the Alert criteria is met.
Second strategy
The Accelerator Oscillator has been developed by Bill Williams
as the development of the Awesome Oscillator. It represents the
difference between the Awesome Oscillator and the 5-period moving
average, and as such it shows the speed of change of the Awesome
Oscillator, which can be useful to find trend reversals before the
Awesome Oscillator does.
WARNING:
- For purpose educate only
- This script to change bars colors.
Search in scripts for "williams"

Meu Script 44My script 44.
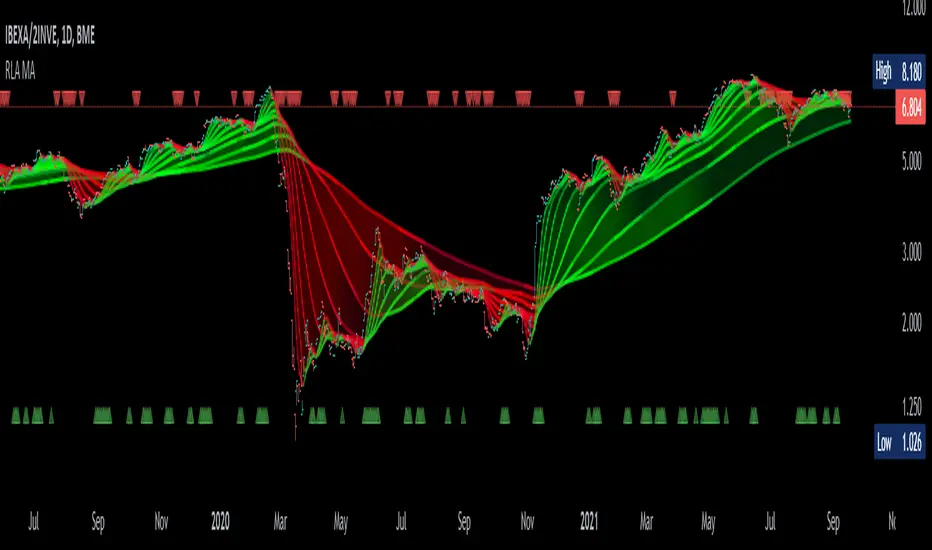
The indicator uses 4 Arnaud Legaux moving averages calibrated by myself. It uses the following periods 17, 72 ,305 and 1292.
It is based on the work of Bo Williams (PhiCube) and the fractal 5-3.
When the moving averages are aligned up 17 > 72 > 305 > 1292 look for a buy. Above the green region or inside the green region.
When the moving averages are aligned down 17 < 72 < 305 < 1292 look for a sell. Under the green region or inside the green region.
If between the MAs wait for the end of the consolidation.
The color show in a diferent manner the moving averages and the regions proper to trade and to avoid.

Trendalix EntriesThis script is made to simplify the analysis of trends. It changes the mas based on whether you're looking at stocks or crypto. As these 2 markets currently move differently, they need a slightly different approach.
Crypto trends:
Can move much faster than stocks. Ideally the price should be bouncing above the williams alligators (about the 20-30 MAs).
Stocks:
These swing more than crypto so you need to get deep into these swing to be buying at the bottom of a move. The MAs are much larger, between the 50ma and 400ma. It's much more important here that the slower MAs are strong, i.e 200ma is above the 400ma, than it is that the faster MAs are okay.
For stocks an entry and stop line is drawn. These are only visible when the market is sufficiently in a pullback.

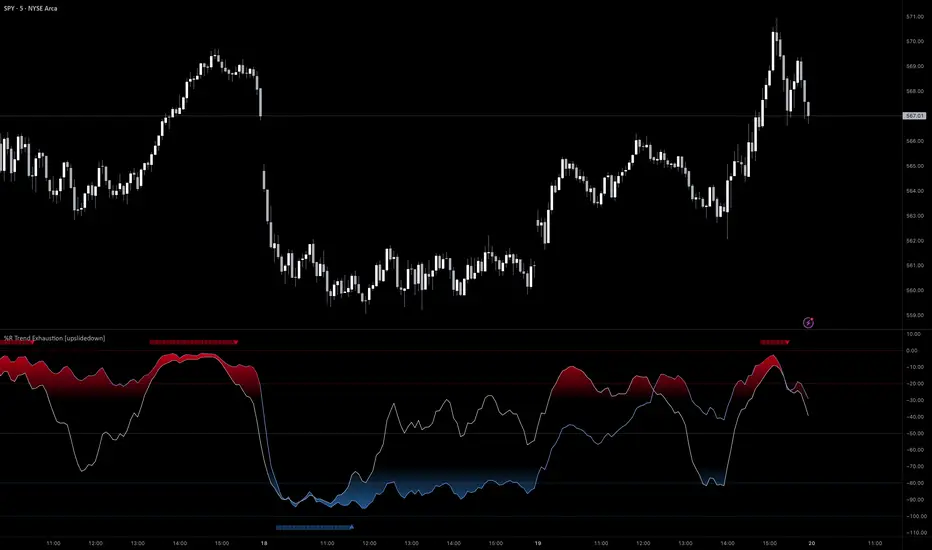
%R Trend Exhaustion [upslidedown]I love Williams %R! This indicator mixes two %R periods... a standard %R with a longer period %R. The longer period of 112 has interesting results for trend following strategies in the crypto market through backtesting.
Alone these are fairly ordinary but together they provide a very interesting trend exhaustion/reversal system while filtering out some noise. I have highlighted key areas of interest with filled boxes. An "area of interest" is when there is confluence between the short and long period %R values along with being overbought or oversold. Once there is a break in the overbought or oversold trend, an arrow will print.
This is one of my odder ideas that appears to have some merit and detects interesting tops or bottoms (or confirms a trend reversal) so I'm publicly publishing for the community to find. If you find this useful please reach out and let me know how you use it as it's fairly unique... and thus different than anything I've ever seen or used.
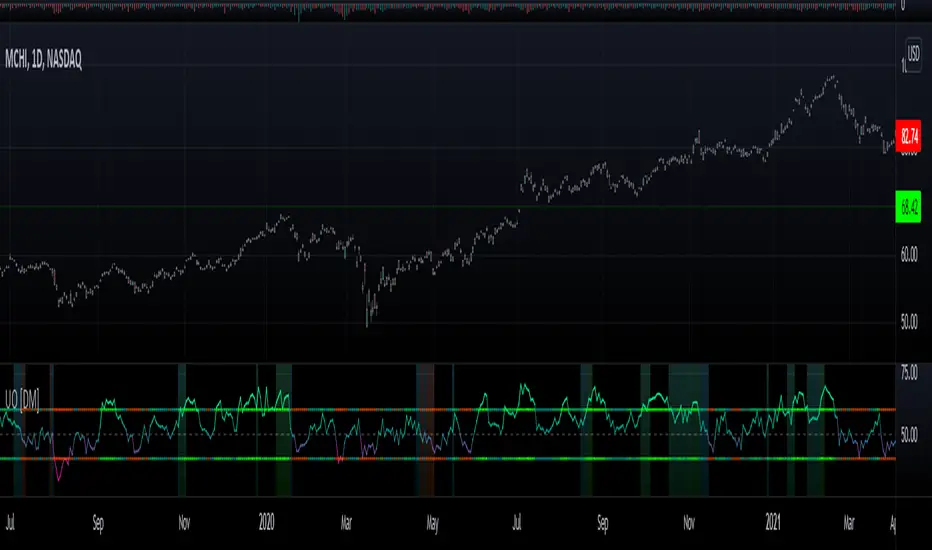
Willians Ultimate Oscillator [DM]Hello colleagues
I share the Williams Ultimate Oscillator
You can select betwen:
1.Average signal of 9 lengths (3 X UO).
2. Three independent signals UO.
You can also customize the oversold and oversold bands.
Some alerts were added.
The gradient colors of the background warn us of a squeeze in the movement of the indicator.
If there is something that can be improved (it is certain that it is) please leave it in comments.
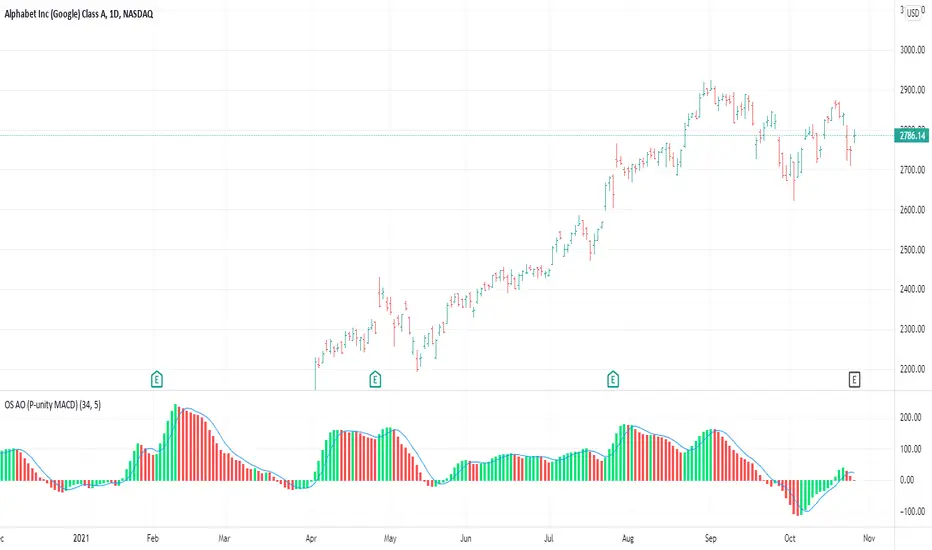
OS AO (P-unity MACD)This is both the Awesome Oscillator (AO) as described in New Trading Dimensions ( NTD , book by Bill Williams ), and the Profitunity MACD described in the first edition of Trading Chaos.
The calculation for both is the same. In this case I added the 5 day SMA which is the blue line. The difference between the blue line and the AO is the AC which is also described in NTD and is usually plotted in a different indicator (AC).
This is the base for the following signals:
Zone Bar
2nd Wise Man
The signals are triggered and shown on the main chart screen through the use of OS Alligator . This indicator (AO) provides further insight in analyzing those signals by reading the AO, its current position and evolution directly.
Argo I (alerts for 3commas single bots)This script lets users create BUY/SELL alerts for 3commas single bots in a simple way, based on a built in set of indicators that can be tweaked to work together or separately through the study settings. Indicators include Bollinger Bands, Williams %R, RSI, EMA, SMA , Market Cipher, Inverse Fisher Transform.
If the user choses to create both BUY and SELL signals from the study settings, the alert created will send both BUY and SELL signals for the selected pair. Note the script will only send alerts for the pair selected in the study settings, not for the current chart (if different).
How to use:
- Add the script to the current chart
- Open the study settings , insert bot details. Pairs MUST be in capital letters or 3commas will not recognize them.
- Still in the study settings, tweak the deal start/close conditions from various indicators until happy. The study will plot the entry / exit points below the current chart (1 = buy, 2 = sell)
- Ideally, test the settings with a backtesting script. The present script is compatible with the Trading Parrot's backtester.
- When happy, right click on the "..." next to the study name, then "Add alert'".
- Under "Condition", on the second line, chose "Any alert () function call". Add the webhook from 3commas, give it a name, and "create".
Happy tweaking!

Compound Moving Average [DM]Greetings Colleagues
We always have a problem with the type of moving average and how it is used, here are the two classics that I like the most "together".
I share a moving average composed of:
3 exponential moving averages
3 weighted moving averages
For the initial calculation, the weight has been distributed using the Williams Ultimate Oscillator ultimate oscillator technique but I have added an input to be able to balance the load

Alma Moving Average Ribbon Reverse Length [DM]Greetings Colleagues
Following some recommendations and ideas I share this moving average, put all of them together
The length calculation is automatic there is only one input.
The length is inverse so it will wrap from the longest reference point, hence using phi
Moving averages will wrap around the price.
I've also added gradient color to plots and fill plots
There is an alert selector in case you are interested in a particular crossing, "remember that the order is reversed".
There is an alert visual plotshapes with offset signal.
Finally, after spending a few hours with the Williams alligator moving averages I found nothing special, but I added the individual offset adjustment for each moving average in case someone comes up with something.
Enjoy”
Some references about alma by "tradingview pinecoders"
What to look for
The Arnaud Legoux Moving Average has three elements to it:
Window: This element is the period. By default, the window is set to 9 periods, but it can be customized to fit any trading style.
Offset: This element is the Gaussian that is applied to the combo line and can be aligned to the current price. It’s default is set to 0.85, but by setting it to 1, you can make it align fully to the current price (similar to how an Exponential Moving Average (EMA) with a setting of 0 is like a Simple Moving Average (SMA)). 0.85 is what is recommended, however, you can customize it like with the window element.
Sigma: This element is a standard deviation that is applied to the combo line in order for it to appear more sharp. The default is set to 6 and it is not recommended to change the setting. The value of 6 is inspired by the Six Sigma process.
www.tradingview.com
Accumulation/Distribution %This script takes the signal from the Accumulation Distribution indicator invented by Larry Williams and normalizes it such that it becomes an oscillator about a zero line as described by John Bollinger in his book Bollinger on Bollinger Bands . The purpose of the indicator is to serve as a volume-based confirmation of signals given by other indicators, typically Bollinger Bands paired with a momentum indicator . In the example shown, Bollinger Bands are paired with Bollinger Bands %B and the Bollinger Bands %B indicator is interpreted similar to the Relative Strength Index ( RSI ) which is a momentum indicator .
The AD% indicator is colorized such that positive readings are green and negative readings are red. The readings become darker when approaching the zero line. The colorization is also displayed on the price chart. The chart type needs to be set to "bars" for price colorization to work properly.
The formula for this indicator is presented in the John Bollinger book as follows:
10-day sum of /10-sum of volume
How to use (my take on a strategy from the book):
1. Look for %B readings that are oversold or overbought (less than 0.00 or greater than 1.00)
2. Check for bearish divergence or bullish convergence of price and %B as shown on the chart
3. Verify divergence or convergence with AD%
4. Note previous trending/crossover behavior of AD% and %B and compare to situation being analyzed
5. A conservative trader may consider buying/selling on a close beyond the 20-day moving average and an AD% zero line crossover (color change)
6. An aggressive trader may consider buying/selling on a color change alone, on a breakdown of %B, or some other signal(s).
Securities behave differently from one another and this strategy doesn't work for all of them. As with any strategy, check past performance to make sure this approach is a good fit. Bandwidth ( volatility ) squeeze is another strategy which seems to work well for this security. For that reason, it was used to demonstrate buy signals, but squeezes aren't always so predictable. AD% may be useful for determining which direction a squeeze will resolve itself, as was the case here. Further information on volatility squeeze trading can be found in the John Bollinger book Bollinger on Bollinger Bands or online.
The default TradingView Accumulation Distribution indicator does not incorporate opening price. The formula used for this indicator does, so there are multiple versions of the A/D formula.
Despite the buy signal indicated, I'm not going long Hecla Mining here and I don't recommend it. I'd need to do further DD before doing so.
Please feel free to ask questions.

Normalized Oscillators Spider Chart [LuxAlgo]This indicator displays a spider chart overlaid on the user’s current chart allowing the visualization of information given by various normalized oscillators. It is possible to customize the spider chart by hiding certain oscillators from within the settings which removes their corresponding spokes from the chart.
Users can control the length settings of each oscillator individually or use a global length setting that applies to every oscillator. An additional meter element is displayed and aims to give the overall sentiment returned by the oscillators. This can also be used to gauge whether the market is trending or ranging.
This is a relatively simple application of a spider chart but can prove to be useful to some users.
1. Settings
RSI: Displays the Relative Strength Index spoke on the spider chart, includes the length setting on the right of the toggle.
%K: Displays the Stochastic Oscillator "%K" spoke on the spider chart, includes the length setting on the right of the toggle.
COR: Displays the Correlation Oscillator spoke on the spider chart, includes the length setting on the right of the toggle.
MFI: Displays the Money Flow Index oscillator spoke on the spider chart, includes the length setting on the right of the toggle.
WPR: Displays the Williams Percent Rank oscillator spoke on the spider chart, includes the length setting on the right of the toggle.
%UP: Displays the percentage of upward variations spoke on the spider chart, includes the length setting on the right of the toggle.
CMO: Displays the Chande Momentum Oscillator spoke on the spider chart, includes the length setting on the right of the toggle.
AOS: Displays the Aroon oscillator spoke on the spider chart, includes the length setting on the right of the toggle.
Global Oscillators Length: Determines whether all oscillators should use the same length settings, determined by the setting on the right of the toggle.
1.1 Style Settings
Spider Chart Length: Determines the horizontal width of the spider chart.
Spider Chart Offset: Offset between the most recent bar and the left extremity of the spider chart.
2. Usage
A spider chart can be a very useful visualization tool when it comes to seeing the individual characteristics of various variables at the same time.
Here, the tool can give a general sentiment on the direction of the trend without adding each indicator to your chart. It is also possible to determine when an oscillator is considered overbought or oversold with this indicator.
The dashed line represents the central value for each oscillator.
Disabling any of the oscillators from the settings will return a spider chart using fewer spokes.
The script also displays a meter that can be used to determine the overall sentiment given by all oscillators. This metric is based on the average value between each oscillator. An overall sentiment closer to 50 would indicate a ranging market.

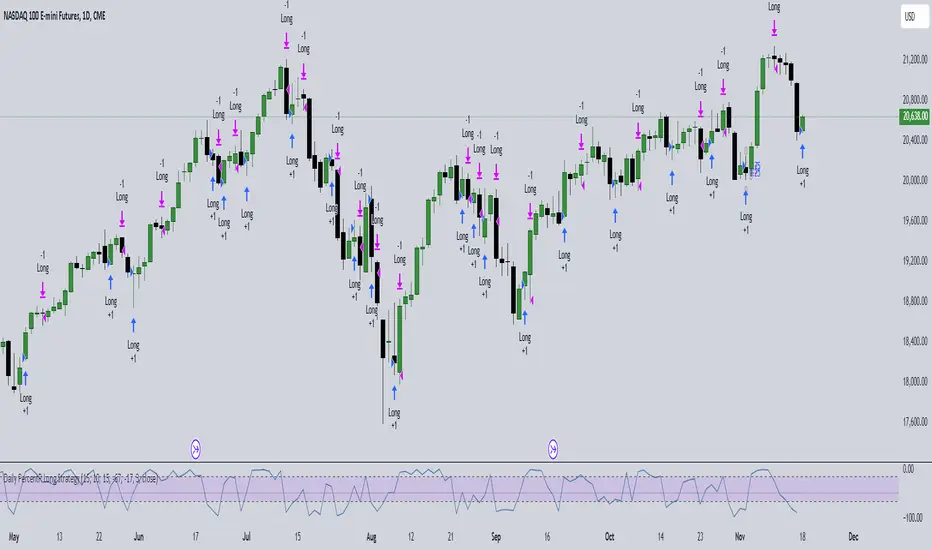
Daily PercentR StrategyThe PercentR strategy from Larry Williams is highly profitable on the daily nasdaq chart
Buy at the open if PercentR Indicator is above –87 and below –20
Exit at the end of the day.
[jav] HeikinAshized OscillatorsThis script allows to HeikinAshize different commonly used centered oscillators.
It plots them like Heikin Ashi candles. In this way, we can eliminate some of the noise and uncertainty that is inherent to applying only one calculation period to the oscillators.
Applying Heikin Ashi to an oscillator might be advantageous compared to applying it directly to the chart, because you are not altering price readings. The obvious advantage is the clear visualization of the trend directions without noise.
INPUTS
The oscillators included are:
Relative Strength Index (RSI)
Stochastic
Stochastic RSI
Fisher transform
Inverse Fisher Transform of RSI (IFTRSI)
Commodity Channel Index (CCI)
Money Flow Index (MFI)
Chande Momentum Oscillator (CMO)
Momentum (MOM)
True Strength Index (TSI)
Williams' Percent Range (WPR).
Apart from the choice of one of these indicators, only two more inputs are required:
the main (median) period and
the % of variability of this period.
RESULTS
The script calculates 4 evenly spaced periods from that data (period and variability), e.g. for a period of 50 and a variability of 30%, the script calculates oscillator values for 4 different periods evenly spaced around 50, (35, 45, 55, 65) and uses these 4 values to draw the Heikin Ashi candle.
The script also plots the usual upper/lower (overbought/oversold) values, as well as the central line.
CREDITS
The interesting concept of applying Heikin Ashi to an oscillator was recently introduced in Tradingview by @JayRogers . Many thanks for the idea.
For Heikin Ashi calculations, the useful script by @allanster was taken as a reference.
Any improvements, modifications or suggestions are welcome.

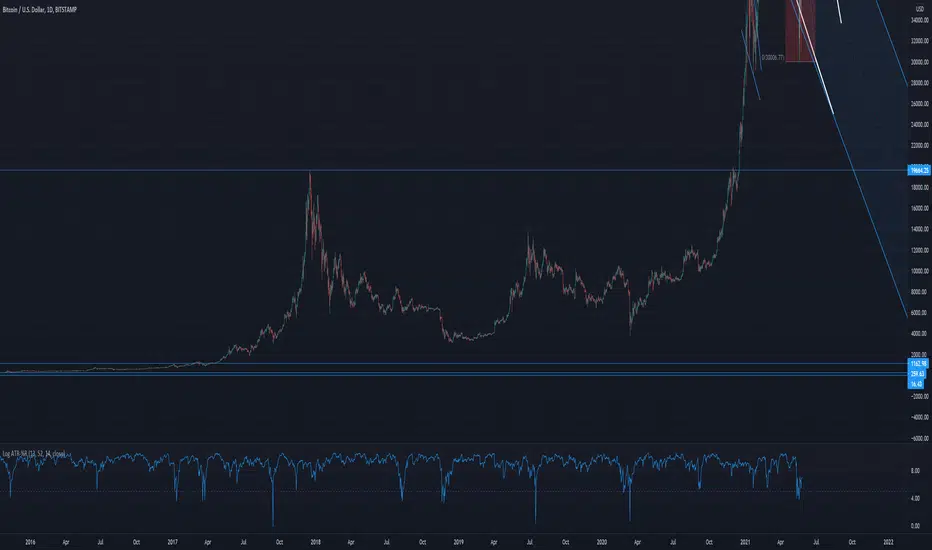
Log ATR-%RThis indicator uses a combines the "Williams %R" and "ATR_Normalized" indicators to find potential price bottoms, as suggested by simultaneous extreme values on both of the aforementioned indicators. This is represented by near zero values one this indicator. A log transform is used to make the dips easier to spot.
ATR-%RThis indicator uses a combines the "Williams %R" and "ATR_Normalized" indicators to find potential price tops and bottoms, as suggested by simultaneous extreme values on both of the aforementioned indicators.

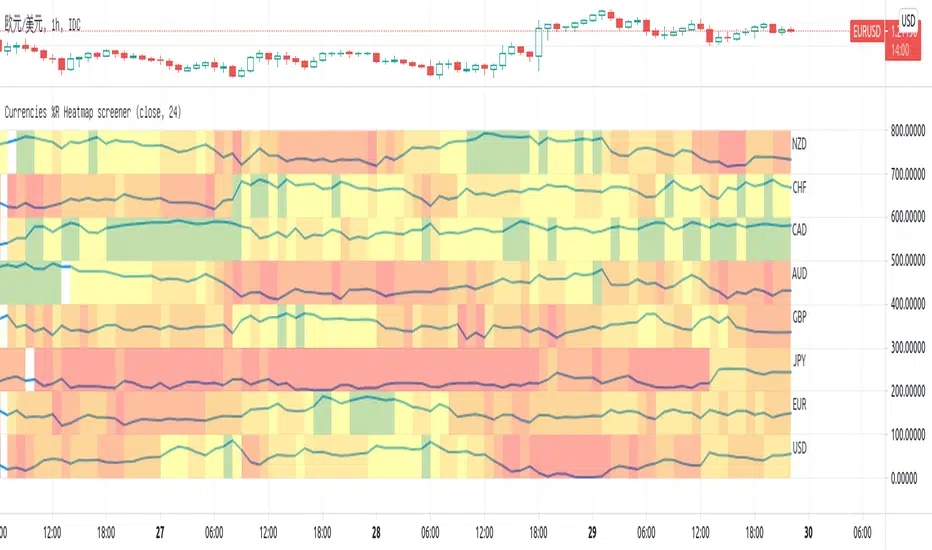
Currencies %R Heatmap screenerThis script is for Forex combinations of the following currencies: USD, EUR, GBP, JPY, CHF, AUD, NZD, CAD
- It uses security function to get 28 currency pairs, so that it may cost a few seconds to paint.
- It calculates %R of currencies and paint with fib color mentioned on my other script Williams %R Color Map
- Normally fib more currency stronger, and fib less the currency weaker. If too big or too small, considering trend change.
I always put on 3 charts with 1h, 5h ,1D to have a quick view.
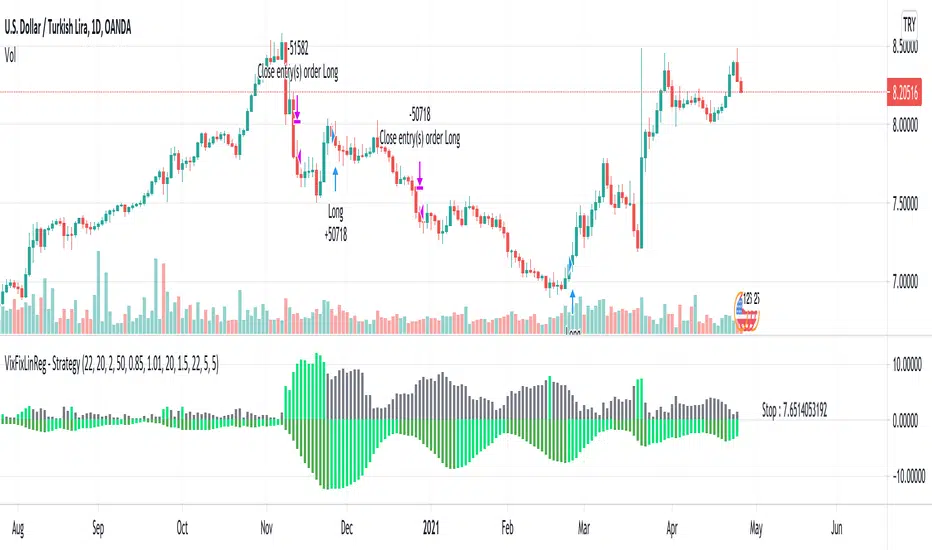
VixFixLinReg-StrategyThis idea came up while discussing about strategies with one of the trading enthusiast from tradingview community.
Strategy basically uses existing script of Vix Fix by Chris Moody:
VixFix is a great indicator for finding the market bottoms. But, sometimes it generates signal too early. But, we can apply linear regression on vix fix to find vix fix top to make timing much better.
Entry condition:
Wait for Vix fix bar to turn lime.
Once vix fix is turned lime, then wait for linear regression (shown below 0) to turn lime from green. This indicates VIX-Fix has started declining.
Go long once above two conditions are satisfied
Exit Condition:
ATR Based Stop
Applied only if linear regression is green - which means VixFix rising.
Note: This is ideal for identifying market bottom. May not yield good results on individual stocks.
OS HiLo TrackingIndicator plots a dynamic horizontal line for tracking the highest high and/or lowest low in your desired time-period.
You can select both the period, and whether an alert is produced when the price crosses the last highest high or lowest low.
When used when other Williams indicators, this can help you set your trailing stop for profit-taking.

coates moving averages (cma)This indicator uses three moving averages:
2 period low simple ma
2 period high simple ma
9 period least squares ma
The trend is determined by the angle of the moving averages, current close relative the the 9 least squares ma (lsm) and the current close relative to the prior two periods high and low.
When there are consecutive closes inside the prior two candles high and low then a range is signaled:
In ranges the buy zone is between the lowest low and the lowest close of the current range. The sell zone is between the highest high and the highest close. The zones are adjusted as long as the new close is within the prior two candles range:
When price closes above the 2 high ma and the 9 lsm then a bull trend is signaled if all moving averages are angled upward (as seen at #4 in the chart above and #1 the chart below ). If the 9 lsm and / or the 2 low ma continue to angle downward, following a close above the 2 high ma and 9 lsm, then a prolonged range or reversal is expected (#2 in the chart below):
During a bull trend the buy zone is between the 2 low ma and the 9 lsm. The profit target is the 2 high ma:
During dip buying opportunities price should resist closing below the 9 lsm. If there is one close below the 9 lsm then it is a canary in the coalmine that tells us to proceed with caution. This will often signal a range, based on the conditions outlined above. To avoid a prolonged range, or reversal, price needs to immediately react in the direction of the prevailing trend:
If the moving averages are angled down and the most recent close is below the 2 low ma and 9 lsm then trend is fully bearish:
During a bear trend the short zone is between the 2 high ma and 9 lsm. The profit target is the 2 low ma:
When the 2 high ma angles down and the 2 low ma angles up while price closes inside both mas then it indicates a cma squeeze:
Volatility is expected in the direction of the breakout following the squeeze. In this situation traps / shakeouts are common. If there is a wick outside the cma, with a close inside, then it indicates a trap / shakeout. If there is a close outside the 2 high / low ma then it signals a breakout.
A trend is considered balanced when the 9 lsm is roughly equidistant from the 2 low and 2 high mas. If the 9 lsm crosses the 2 high or 2 low ma then it signals exhaustion / imbalance.
For a stop loss I use the prior three periods low, for bull trends, and the prior three periods high for bear trends. I would expect other reliable stops, such as the parabolic sar or bill williams fractal, to be effective as well. The default moving averages should be very effective on all timeframes and assets classes, however this indicator was developed for bitcoin with a focus on higher timeframes such as the 4h, daily and weekly.
As with any other technical indicator there will be bad signals. Proceed with caution and never risk more than you are willing to lose.

Combo Backtest 123 Reversal & Money Flow Indicator This is combo strategies for get a cumulative signal.
First strategy
This System was created from the Book "How I Tripled My Money In The
Futures Market" by Ulf Jensen, Page 183. This is reverse type of strategies.
The strategy buys at market, if close price is higher than the previous close
during 2 days and the meaning of 9-days Stochastic Slow Oscillator is lower than 50.
The strategy sells at market, if close price is lower than the previous close price
during 2 days and the meaning of 9-days Stochastic Fast Oscillator is higher than 50.
Second strategy
Indicator plots Money Flow Indicator (Chaikin). This indicator looks
to improve on Larry William's Accumulation Distribution formula that
compared the closing price with the opening price. In the early 1970's,
opening prices for stocks stopped being transmitted by the exchanges.
This made it difficult to calculate Williams' formula. The Chaikin
Oscillator uses the average price of the bar calculated as follows
(High + Low) /2 instead of the Open.
The indicator subtracts a 10 period exponential moving average of the
AccumDist function from a 3 period exponential moving average of the
AccumDist function.
WARNING:
- For purpose educate only
- This script to change bars colors.

TurbulenceThis indicator uses 28 SMA lines from SMA12 to SMA120 with an interval of 4 to reveal the unseen underlying structure that determines the stock price trend. This work is inspired by Benoit Mandelbrot's turbulence movement of the market and Bill Williams' chaos theory.
MA lines are colored blue for bullish trends, red for bearish trends, and gray for no apparent movement.

Vix SpikeThis script calculates spikes Vix tops and bottoms. The Vix Market Bottom is calculated using CM_Williams_Vix_Fix Finds Market Bottoms (Chris Moody). The Vix Market Top is calculated as the inverse of CM Williams’ formula.
The highest Vix Bottom and the highest Vix Top are averaged (over the Highest Vix Lookback period).
Buys are signaled when the Vix Bottom line crosses below the Highest Vix Average.
Sells are signaled when the Vix Top line crosses below Highest Vix Average.
BINANCE:ETHUSDT 5 min
BYBIT:XRPUSD 5 min

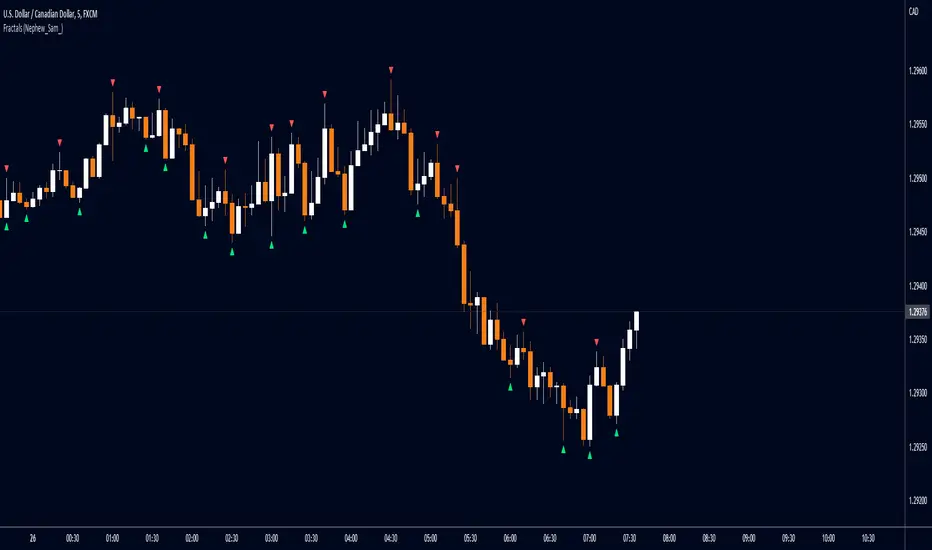
Fractals (Nephew_Sam_)Regular and Williams fractal
1. Plots 3 and 5 bar fractal point
2. Plots significant highs/lows lines
Credits to @RicardoSantos, Code taken from his open source script (V9).