Sylvain Zig-Zag [MyTradingCoder]This Pine Script version of ZigZagHighLow is a faithful port of Sylvain Vervoort's original study, initially implemented in NinjaScript and later added to the thinkorswim standard library. This indicator identifies and connects swing points in price data, offering a clear visualization of market moves that exceed a specified threshold. Additionally, it now includes features for detecting and plotting support and resistance levels, enhancing its utility for technical analysis.
Overview
The Sylvain Zig-Zag study excels at highlighting significant price swings by plotting points where the price change, combined with volatility adjustments via the Average True Range (ATR), exceeds a user-defined percentage. It effectively smooths out minor fluctuations, allowing traders to focus on the primary market trends. This tool is particularly useful in identifying potential turning points, trends in price movements, and key support and resistance levels, making it a valuable addition to your technical analysis arsenal.
How It Works
The Sylvain Zig-Zag indicator works by detecting swing points in the price data and connecting them to form a zigzag pattern. A swing point is identified when the price moves a certain distance, defined by a combination of percentage change and ATR. This distance must be exceeded for a swing point to be plotted.
When the price moves upwards and exceeds the previous high by a specified percentage plus a factor of the ATR, a new high swing point is plotted. Conversely, a low swing point is plotted when the price moves downwards and exceeds the previous low by the same criteria. This ensures that only significant price moves are considered, filtering out minor fluctuations and providing a clear view of the overall market trend.
In addition to plotting zigzag lines, the indicator can now identify and draw support and resistance levels based on the detected swing points. These levels are crucial for identifying potential reversal areas and market structure.
Key Features
Swing Point Detection: Accurately identifies significant price swings by considering both percentage price change and volatility (via Average True Range).
Dynamic Support/Resistance: Automatically generates support and resistance lines based on the identified swing points, providing potential areas of price reversals.
Customizable Parameters: Tailor the indicator's sensitivity to your preferred trading style and market conditions. Adjust parameters like percentage reversal, ATR settings, and absolute/tick reversals.
Visual Clarity: Choose to display the ZigZag line, support/resistance levels, new trend icons, continuation icons, and even customize bar colors for easy visual analysis.
Trading Applications
Trend Identification: Easily visualize the prevailing market trend using the direction of the ZigZag line and support/resistance levels.
Entry/Exit Signals: Potential entry points can be identified when the price interacts with the dynamic support/resistance levels.
Stop-Loss Placement: Use recent swing points as logical places for setting stop-loss orders.
Profit Targets: Project potential price targets based on the distance between previous swing points.
Input Parameters
Several input parameters can be adjusted to customize the behavior of the Sylvain Zig-Zag indicator. These parameters allow traders to fine-tune the detection of swing points and support/resistance levels to better suit their trading strategy and the specific market conditions they are analyzing.
High Source and Low Source:
These inputs define the price points used for detecting high and low swing points, respectively. You can choose between high, low, open, or close prices for these calculations.
Percentage Reversal:
This input sets the minimum percentage change in price required for a swing to be detected. A higher percentage value will result in fewer but more significant swing points, while a lower value will detect more frequent, smaller swings.
Absolute Reversal:
This parameter allows for an additional fixed value to be added to the minimum price change and ATR change. This can be useful for increasing the distance between swing points in volatile markets.
ATR Length:
This input defines the period used for calculating the ATR, which is a measure of market volatility. A longer ATR period will smooth out the ATR calculation, while a shorter period will make it more sensitive to recent price changes.
ATR Multiplier:
This factor is applied to the ATR value to adjust the sensitivity of the swing point detection. A higher multiplier will increase the required price movement for a swing point to be plotted, reducing the number of detected swings.
Tick Reversal:
This input allows for an additional value in ticks to be added to the minimum price change and ATR change, providing further customization in the swing point detection process.
Support and Resistance:
Show S/R: Enable or disable the plotting of support and resistance levels.
Max S/R Levels: Set the maximum number of support and resistance levels to display.
S/R Line Width: Adjust the width of the support and resistance lines.
Visual Settings
The Sylvain Zig-Zag indicator also includes visual settings to enhance the clarity of the plotted swing points and trends. You can customize the color and width of the zigzag line, and enable icons to indicate new trends and continuation patterns. Additionally, the bars can be colored based on the detected trend, aiding in quick visual analysis.
Conclusion
This port of the ZigZagHighLow study from NinjaScript to Pine Script preserves the essence of Sylvain Vervoort’s methodology while adding new features for support and resistance. It provides traders with a powerful tool for technical analysis. The combination of price changes and ATR ensures that you have a robust and adaptable tool for identifying key market movements and structural levels. Customize the settings to match your trading style and gain a clearer picture of market trends, turning points, and support/resistance areas. Enjoy improved market analysis and more informed trading decisions with the Sylvain Zig-Zag indicator.
Search in scripts for "文华财经tick价格"

ICT Silver Bullet | Flux Charts💎 GENERAL OVERVIEW
Introducing our new ICT Silver Bullet Indicator! This indicator is built around the ICT's "Silver Bullet" strategy. The strategy has 5 steps for execution and works best in 1-5 min timeframes. For more information about the process, check the "HOW DOES IT WORK" section.
Features of the new ICT Silver Bullet Indicator :
Implementation of ICT's Silver Bullet Strategy
Customizable Execution Settings
2 NY Sessions & London Session
Customizable Backtesting Dashboard
Alerts for Buy, Sell, TP & SL Signals
📌 HOW DOES IT WORK ?
ICT's Silver Bullet strategy has 5 steps :
1. Mark your market sessions open (This indicator has 3 -> NY 10-11, NY 14-15, LDN 03-04)
2. Mark the swing liquidity points
3. Wait for market to take down one liquidity side
4. Look for a market structure-shift for reversals
5. Wait for a FVG for execution
This indicator follows these steps and inform you step by step by plotting them in your chart. You can switch execution types between FVG and MSS.
🚩UNIQUENESS
This indicator is an all-in-one suit for the ICT's Silver Bullet concept. It's capable of plotting the strategy, giving signals, a backtesting dashboard and alerts feature. It's designed for simplyfing a rather complex strategy, helping you to execute it with clean signals. The backtesting dashboard allows you to see how your settings perform in the current ticker. You can also set up alerts to get informed when the strategy is executable for different tickers.
⚙️SETTINGS
1. General Configuration
Execution Type -> FVG execution type will require a FVG to take an entry, while the MSS setting will take an entry as soon as it detects a market structure-shift.
MSS Swing Length -> The swing length when finding liquidity zones for market structure-shift detection.
Breakout Method -> If "Wick" is selected, a bar wick will be enough to confirm a market structure-shift. If "Close" is selected, the bar must close above / below the liquidity zone to confirm a market structure-shift.
FVG Detection -> "Same Type" means that all 3 bars that formed the FVG should be the same type. (Bullish / Bearish). "All" means that bar types may vary between bullish / bearish.
FVG Detection Sensitivity -> You can turn this setting on and off. If it's off, any 3 consecutive bullish / bearish bars will be calculated as FVGs. If it's on, the size of FVGs will be filtered by the selected sensitivity. Lower settings mean less but larger FVGs.
2. TP / SL
TP / SL Method -> If "Fixed" is selected, you can adjust the TP / SL ratios from the settings below. If "Dynamic" is selected, the TP / SL zones will be auto-determined by the algorithm.
Risk -> The risk you're willing to take if "Dynamic" TP / SL Method is selected. Higher risk usually means a better winrate at the cost of losing more if the strategy fails.
Close Position @ Session End -> If this setting is enabled, the current position (if any) will be closed at the beginning of a new session, regardless if it hit the TP / SL zone. If it's off, the position will be open until it hits a TP / SL zone.

Market Internals & InfoThis script provides various information on Market Internals and other related info. It was a part of the Daily Levels script but that script was getting very large so I decided to separate this piece of it into its own indicator. I plan on adding some additional features in the near future so stay tuned for those!
The script provides customizability to show certain market internals, tickers, and even Market Profile TPO periods.
Here is a summary of each setting:
NASDAQ and NYSE Breadth Ratio
- Ratio between Up Volume and Down Volume for NASDAQ and NYSE markets. This can help inform about the type of volume flowing in and out of these exchanges.
Advance/Decline Line (ADL)
The ADL focuses specifically on the number of advancing and declining stocks within an index, without considering their trading volume.
Here's how the ADL works:
It tracks the daily difference between the number of stocks that are up in price (advancing) and the number of stocks that are down in price (declining) within a particular index.
The ADL is a cumulative measure, meaning each day's difference is added to the previous day's total.
If there are more advancing stocks, the ADL goes up.
If there are more declining stocks, the ADL goes down.
By analyzing the ADL, investors can get a sense of how many stocks are participating in a market move.
Here's what the ADL can tell you:
Confirmation of Trends: When the ADL moves in the same direction as the underlying index (e.g., ADL rising with a rising index), it suggests broad participation in the trend and potentially stronger momentum.
Divergence: If the ADL diverges from the index (e.g., ADL falling while the index is rising), it can be a warning sign. This suggests that fewer stocks are participating in the rally, which could indicate a weakening trend.
Keep in mind:
The ADL is a backward-looking indicator, reflecting past market activity.
It's often used in conjunction with other technical indicators for a more complete picture.
TRIN Arms Index
The TRIN index, also called the Arms Index or Short-Term Trading Index, is a technical analysis tool used in the stock market to gauge market breadth and sentiment. It essentially compares the number of advancing stocks (gaining in price) to declining stocks (losing price) along with their trading volume.
Here's how to interpret the TRIN:
High TRIN (above 1.0): This indicates a weak market where declining stocks and their volume are dominating the market. It can be a sign of a potential downward trend.
Low TRIN (below 1.0): This suggests a strong market where advancing stocks and their volume are in control. It can be a sign of a potential upward trend.
TRIN around 1.0: This represents a more balanced market, where it's difficult to say which direction the market might be headed.
Important points to remember about TRIN:
It's a short-term indicator, primarily used for intraday trading decisions.
It should be used in conjunction with other technical indicators for a more comprehensive market analysis. High or low TRIN readings don't guarantee future price movements.
VIX/VXN
VIX and VXN are both indexes created by the Chicago Board Options Exchange (CBOE) to measure market volatility. They differ based on the underlying index they track:
VIX (Cboe Volatility Index): This is the more well-known index and is considered the "fear gauge" of the stock market. It reflects the market's expectation of volatility in the S&P 500 index over the next 30 days.
VXN (Cboe Nasdaq Volatility Index): This is a counterpart to the VIX, but instead gauges volatility expectations for the Nasdaq 100 index over the coming 30 days. The tech-heavy Nasdaq can sometimes diverge from the broader market represented by the S&P 500, hence the need for a separate volatility measure.
Both VIX and VXN are calculated based on the implied volatilities of options contracts listed on their respective indexes. Here's a general interpretation:
High VIX/VXN: Indicates a high level of fear or uncertainty in the market, suggesting investors expect significant price fluctuations in the near future.
Low VIX/VXN: Suggests a more complacent market with lower expectations of volatility.
Important points to remember about VIX and VXN:
They are forward-looking indicators, reflecting market sentiment about future volatility, not necessarily current market conditions.
High VIX/VXN readings don't guarantee a market crash, and low readings don't guarantee smooth sailing.
These indexes are often used by investors to make decisions about portfolio allocation and hedging strategies.
Inside/Outside Day
This provides a quick indication of it we are still trading inside or outside of yesterdays range and will show "Inside Day" or "Outside Day" based upon todays range vs. yesterday's range.
Custom Ticker Choices
Ability to add up to 5 other tickers that can be tracked within the table
Show Market Profile TPO
This only shows on timeframes less than 30m. It will show both the current TPO period and the remaining time within that period.
Table Customization
Provided drop downs to change the text size and also the location of the table.

Footprint liteFootprint Lite enables you to monitor volume distribution for the current ticker, offering resolutions as 1 second, segmented by specified price levels with visual representations. Additionally, you have the flexibility to customize the displayed Imbalance price level and the number of consecutive Imbalance level lines.
Here are the input options:
Group Display:
This section allows you to adjust how Footprints are displayed.
"Count show bars": Directly adjusts the display to show the last 'n' bars.
"Display all available bars": Shows all available bars.
Group Row size:
Adjusts the parameters for generating Footprints based on price step size.
"Ticks Per Row": Directly sets the price step, calculated by multiplying the entered value by syminfo.mintick.
"Auto": Enables automatic mode for selecting the "Ticks Per Row" value.
"Max row": Relevant for auto mode, it sets the acceptable number of rows within a bar. The automatic "Ticks Per Row" calculation is based on the first available bar and applied to subsequent bars.
Group Imbalance:
Customizes the display of price levels represented by Imbalance and emphasizes consecutive lines.
"Imbalance Percent": A coefficient expressed as a percentage to determine the Imbalance of price levels, comparing the buy price diagonally to the previous sell price.
"Stacked levels": Sets the minimum number of consecutive Imbalance levels required to draw extended lines.
Alerts:
You can set alerts for various events:
"New imbalance line sell": Alerts on the appearance of a new imbalance line for selling.
"New imbalance line buy": Alerts on the appearance of a new imbalance line for buying.
"Stop past imbalance line sell": Alerts when the previous imbalance line for selling stops, indicating it has reached the range from low to high of the current bar.
"Stop past imbalance line buy": Alerts when the previous imbalance line for buying stops, indicating it is within the range from low to high of the current bar.
"New imbalance buy": Alerts on the appearance of a new or change in the current imbalance level for buying.
"New imbalance sell": Alerts on the appearance of a new or change in the current imbalance level for selling.

Market Performance TableThe Market Performance Table displays the performance of multiple tickers (up to 5) in a table format. The tickers can be customized by selecting them through the indicator settings.
The indicator calculates various metrics for each ticker, including the 1-day change percentage, whether the price is above the 50, 20, and 10-day simple moving averages (SMA), as well as the relative strength compared to the 10/20 SMA and 20/50 SMA crossovers. It also calculates the price deviation from the 50-day SMA.
The table is displayed on the chart and can be positioned in different locations.
Credits for the idea to @Alex_PrimeTrading ;)

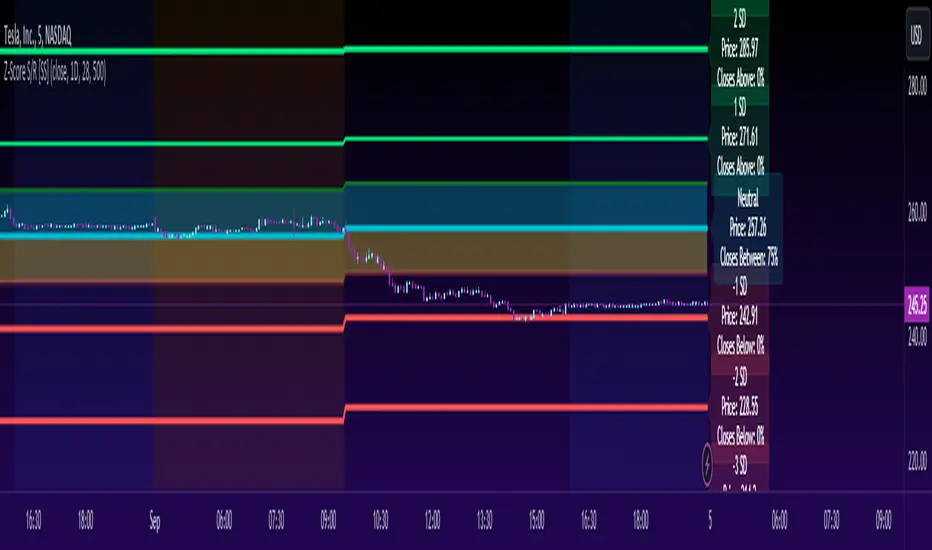
Z-Score Support & Resistance [SS}Hello everyone,
This is the Z-Score Support and Resistance (S/R) indicator.
How it works:
The trouble with most indicators and strategies that rely on distributions is that they are constantly moving targets.
To combat this, what I have done is anchored the assessment of the normal distribution to the period open price and dropped the data from the current day.
This provides us with a static assessment of the current distribution and static target levels.
It then plots out an assessment of what would be neutral (0 Standard Deviations) all the way up to +3 Standard Deviations and all the way down to -3 Standard Deviations.
It can plot out this assessment on any timeframe, from the minutes to the months to the years, simply select which desired timeframe you want in the settings menu (default is 9 which seems to work well for most generic tickers and indicies).
The indicator will also count the number of times a ticker has closed within each designated period. To do this, please make sure that you have the assessment timeframe opened on the chart. So if you want to look at the instances on the daily timeframe, ensure you have the daily timeframe opened. If you want to look on the monthly, ensure you have the monthly opened, etc. (See below):
How to Use:
To use the indicator, its pretty simple.
Simply select the desired timeframe you want to use as S/R and use it!
You can adjust the period lookback from the defaulted 9 period based on:
a) The degree of normality in the dataset (you can use a kurtosis indicator to help you ascertain this); or
b) The back-test results of closes within a desired range.
For the later, you can see an example below:
This is TSLA with a 9 period lookback:
We can see that 50% of closes are happening within 0.5 and -0.5 standard deviations. If we extend this to a 15 period lookback:
Now over 60% of closes are happening in this area.
Why does this matter? Well, because now we know our prime short and long entries (see below):
The green arrows represent prime long setups and the red prime short setups.
This is because we know, 61% of the time the ticker will close between 0.5 and -0.5 standard deviations, so we can trade the ticker back to this area.
Further instructions:
Because it is somewhat of a complex indicator, I have done a tutorial video that I will link below here:
And that is the indicator my friends! Hopefully you enjoy :-).
As always, leave your comments and suggestions / Questions below!
Safe trades!
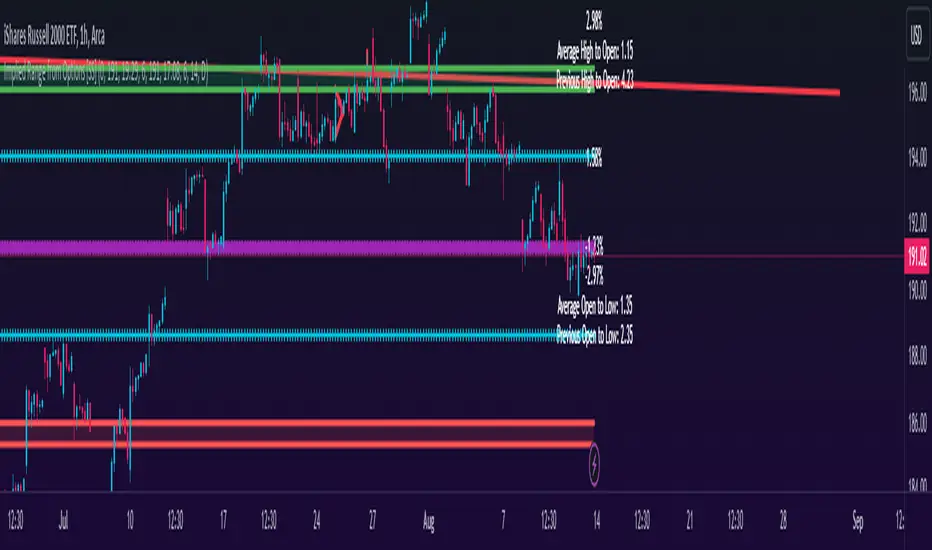
Implied Range from Options [SS]I have been promising to post this for a while, but I just needed to make sure that a) there were no similar indicators already available and b) make it a bit more user friendly.
So here it is, a basic indicator that will display the implied range from options.
In addition to displaying the implied range from options, it will provide some secondary information to help add context to the implied range. Those are shown in the chart below:
The indicator will list various precents at each point to the upside and to the downside. This is the percent move required, based on the current close price, to obtain any point in the implied move range.
In addition, the indicator will display the average move from open to high and open to low over a user defined period (default to 14 candle period) as well as the previous open to high and open to low move from the previous day.
This is to give you context of:
a) How much of a % increase or decrease is required to reach the implied ranges; and
b) How does the implied range compare to the ticker's average moves.
An increased implied range that exceeds the ticker's average move can alert you that the market is pricing in an above average move. This can be helpful and alert you to potential news releases or other fundamental things that have the potential to move the market.
How to Use the indicator:
So unfortunately, this indicator requires a bit of manual input. I was going to do an auto IV calculcation using Black-Scholes Model but just to be more rigorous in accuracy, I decided to, for now, leave it at a manual input. So when you launch the settings menu, this is what you will see:
You can collect all of this required information from your broker. Inversely, you can collect it online for free from various services such as Barchart or COBE's exchange website. The easiest way is to just pull it from your broker though.
Make sure, if you are doing weekly options to see the weekly range, you set the timeframe to 1 week. The timeframe function will calculate the average move over the desired timeframe length. So if you are doing a 0 dte for the next day, you want to see the intra-day range and will select the 1 day timeframe. It will then present to you the range averages and information on the daily timeframe for you to compare to the implied options range.
Same for the weekly, monthly, yearly, etc.
Additional options:
The indicator provides the midline average and midway points, to add static targets if you are trading the implied range.
These can be toggled on or off in the settings menu:
As well, as you can see, you can also toggle off the range labels.
There is also an offset option. This allows you to extend the range into the future:
Simply select how many candles you would like to plot the range in advance.
Closing remarks
That is the indicator. Its very simple, but it is handy. I was never one to pay attention to option pricing data, but I have been plotting it out daily and weekly these past few weeks and it does add a bit of context in terms of what the market is thinking. So I do recommend actually adding it to your repertoire of analyses going into the weeks and months, and really just paying attention to how the average ranges compare to what the market is pricing in.
One quick suggestion, select the strike price that aligns with the closing price of the ticker. This gives you a better representation of the range.
Safe trades everyone and leave your comments, questions and suggestions below!
A_Taders_Edge_LIBRARYLibrary "A_Taders_Edge_LIBRARY"
RCI(_rciLength, _close, _interval, _outerMostRangeOfOscillator)
- You will see me using this a lot. DEFINITELY my favorite oscillator to utilize for SO many different things from timing entries/exits to determining trends.
Parameters:
_rciLength (int)
_close (float)
_interval (int)
_outerMostRangeOfOscillator (int)
Returns: - Outputs a single RCI value that will between (-)_outerMostRangeOfOscillator to (+)_outerMostRangeOfOscillator
InvalidTID(_close, _showInvalidAssets, _securityTickerid, _invalidArray)
- This is to add a table on the right of your chart that prints all the TickerID's that were either not formulated correctly in the scripts input or that is not a valid symbol and should be changed.
Parameters:
_close (float)
_showInvalidAssets (simple bool)
_securityTickerid (string)
_invalidArray (string )
Returns: - Does NOT return a value but rather the table with the invalid TickerID's from the scripts input that need to be changed.
LabelLocation(_firstLocation)
- This is ONLY for when you are wanting to print ALERT LABELS with the assets name for when an alert trigger occurs for that asset. There are a total of 40 assets that can be used in each copy of the script. You don't want labels from different assets printing on top of each other because you will not be able to read the asset name that the label is for. Ex. If you put your _firstLocation in the input settings as 1 and have 40 assets on this copy of the scanner then the first asset in the list is assigned to the location value 1 on the scale, and the 2nd in the list is assigned to location value 2...and so on. If your first location is set to 81 then the 1st asset is 81 and 2nd is 82 and so on.
Parameters:
_firstLocation (simple int)
Returns: - regardless of if you have the maximum amount of assets being screened (40 max), this export function will output 40 locations… So there needs to be 40 variables assigned to the tuple in this export function. What I mean by that is there needs to be 40 variables between the ' '. If you only have 20 assets in your scripts input settings, then only the first 20 variables within the ' ' Will be assigned to a value location and the other 20 will be assigned 'NA'.
SeparateTickerids(_string)
- You must form this single tickerID input string exactly as laid out in the water (a little gray circle at the end of the setting, that you hover your cursor over to read the details of). IF the string is formed correctly then it will break up. All of the tip rate is within the string into a total of 40 separate strings which will be all of the tickerIDs that the script is using in your MO scanner.
Parameters:
_string (simple string)
Returns: - this will output, 40 different security assets within the tuple output (ie. 40 variable within the ' ') regardless of if you were including 40 assets, to be screened in the MO Screener or not. if you have less than 40 assets, then once the variables are assigned to all of the tickerIDs, the rest of the variables will be assigned "NA".
TickeridForLabelsAndSecurity(_includeExchange, _ticker)
- this export function is used to output 2 tickerID strings. One is formulated to properly work in the request.security() function while the other is how it will appear on the asset name labels depending on how you form your assets string in the MO scanners input settings. Review the tooltip next to the setting, to learn how to form the string so that the asset name labels will appear how you want in the labels at the end of the line plots & the alert labels that would be triggered if the MO Scanner is set up to include Alert Trigger Labels.
Parameters:
_includeExchange (simple bool)
_ticker (simple string)
Returns: - this export function is used to output 2 tickerID strings. One is formulated to properly work in the request.security() function while the other is how it will appear on the asset name labels depending on how you form your assets string in the MO scanners input settings. Review the tooltip next to the setting, to learn how to form the string so that the asset name labels will appear how you want in the labels at the end of the line plots & the alert labels that would be triggered if the MO Scanner is set up to include Alert Trigger Labels.
PercentChange(_startingValue, _endingValue)
- this is a quick export function to calculate how much % change has occurred between the _startingValue and the _endingValue that you input into the export function.
Parameters:
_startingValue (float)
_endingValue (float)
Returns: - it will output a single percentage value between 0-100 with trailing numbers behind a decimal. If you want, only a certain amount of numbers behind the decimal, this export function needs to be put within a formatting function to do so. Explained in the MO Scanner INTRO VIDEO.
PrintedBarCount(_time, _barCntLength, _bcPmin)
- This export function will outfit the percentage of printed bars (that occurred within _barCntLength amount of time) out of the MAX amount of bars that potentially COULD HAVE been printed. Iexplanation in the MO Scanner INTRO VIDEO.
Parameters:
_time (int)
_barCntLength (int)
_bcPmin (int)
Returns: - Gives 2 outputs. The first is the total % of Printed Bars within the user set time period and second is true/false according to if the Printed BarCount % is above the _bcPmin threshold that you input into this export function.

Trend Correlation HeatmapHello everyone!
I am excited to release my trend correlation heatmap, or trend heatmap for short.
Per usual, I think its important to explain the theory before we get into the use of the indicator, so let's get into the theory!
The theory:
So what is a correlation?
Correlation is the relationship one variable has to another. Correlations are the basis of everything I do as a quantitative trader. From the correlation between the same variables (i.e. autocorrelation), the correlation between other variables (i.e. VIX and SPY, SPY High and SPY Low, DXY and ES1! close, etc.) and, as well, the correlation between price and time (time series correlation).
This may sound very familiar to you, especially if you are a user, observer or follower of my ideas and/or indicators. Ninety-five percent of my indicators are a function of one of those three things. Whether it be a time series based indicator (i.e.my time series indicator), whether it be autocorrelation (my autoregressive cloud indicator or my autocorrelation oscillator) or whether it be regressive in nature (i.e. my SPY Volume weighted close, or even my expected move which uses averages in lieu of regressive approaches but is foundational in regression principles. Or even my VIX oscillator which relies on the premise of correlations between tickers.) So correlation is extremely important to me and while its true I am more of a regression trader than anything, I would argue that I am more of a correlation trader, because correlations are the backbone of how I develop math models of stocks.
What I am trying to stress here is the importance of correlations. They really truly are foundational to any type of quantitative analysis for stocks. And as such, understanding the current relationship a stock has to time is pivotal for any meaningful analysis to be conducted.
So what is correlation to time and what does it tell us?
Correlation to time, otherwise known and commonly referred to as "Time Series", is the relationship a ticker's price has to the passing of time. It is displayed in the traditional Pearson Correlation Coefficient or R value and can be any value from -1 (strong negative relationship, i.e. a strong downtrend) to + 1 (i.e. a strong positive relationship, i.e. a strong uptrend). The higher or lower the value the stronger the up or downtrend is.
As such, correlation to time tells us two very important things. These are:
a) The direction of the stock; and
b) The strength of the trend.
Let's take a look at an example:
Above we have a chart of QQQ. We can see a trendline that seems to fit well. The questions we ask as traders are:
1. What is the likelihood QQQ breaks down from this trendline?
2. What is the likelihood QQQ continues up?
3. What is the likelihood QQQ does a false breakdown?
There are numerous mathematical approaches we can take to answer these questions. For example, 1 and 2 can be answered by use of a Cumulative Distribution Density analysis (CDDA) or even a linear or loglinear regression analysis and 3 can be answered, more or less, with a linear regression analysis and standard error ascertainment, or even just a general comparison using a data science approach (such as cosine similarity or Manhattan distance).
But, the reality is, all 3 of these questions can be visualized, at least in some way, by simply looking at the correlation to time. Let's look at this chart again, this time with the correlation heatmap applied:
If we look at the indicator we can see some pivotal things. These are:
1. We have 4, very strong uptrends that span both higher AND lower timeframes. We have a strong uptrend of 0.96 on the 5 minute, 50 candle period. We have a strong uptrend at the 300 candle lookback period on the 1 minute, we have a strong uptrend on the 100 day lookback on the daily timeframe period and we have a strong uptrend on the 5 minute on the 500 candle lookback period.
2. By comparison, we have 3 downtrends, all of which have correlations less than the 4 uptrends. All of the downtrends have a correlation above -0.8 (which we would want lower than -0.8 to be very strong), and all of the uptrends are greater than + 0.80.
3. We can also see that the uptrends are not confined to the smaller timeframes. We have multiple uptrends on multiple timeframes and both short term (50 to 100 candles) and long term (up to 500 candles).
4. The overall trend is strengthening to the upside manifested by a positive Max Change and a Positive Min change (to be discussed later more in-depth).
With this, we can see that QQQ is actually very strong and likely will continue at least some upside. If we let this play out:
We continued up, had one test and then bounced.
Now, I want to specify, this indicator is not a panacea for all trading. And in relation to the 3 questions posed, they are best answered, at least quantitatively, not only by correlation but also by the aforementioned methods (CDDA, etc.) but correlation will help you get a feel for the strength or weakness present with a stock.
What are some tangible applications of the indicator?
For me, this indicator is used in many ways. Let me outline some ways I generally apply this indicator in my day and swing trading:
1. Gauging the strength of the stock: The indictor tells you the most prevalent behavior of the stock. Are there more downtrends than uptrends present? Are the downtrends present on the larger timeframes vs uptrends on the shorter indicating a possible bullish reversal? or vice versa? Are the trends strengthening or weakening? All of these things can be visualized with the indicator.
2. Setting parameters for other indicators: If you trade EMAs or SMAs, you may have a "one size fits all" approach. However, its actually better to adjust your EMA or SMA length to the actual trend itself. Take a look at this:
This is QQQ on the 1 hour with the 200 EMA with 200 standard deviation bands added. If we look at the heatmap, we can see, yes indeed 200 has a fairly strong uptrend correlation of 0.70. But the strongest hourly uptrend is actually at 400 candles, with a correlation of 0.91. So what happens if we change the EMA length and standard deviation to 400? This:
The exact areas are circled and colour coded. You can see, the 400 offers more of a better reference point of supports and resistances as well as a better overall trend fit. And this is why I never advocate for getting married to a specific EMA. If you are an EMA 200 lover or 21 or 51, know that these are not always the best depending on the trend and situation.
Components of the indicator:
Ah okay, now for the boring stuff. Let's go over the functionality of the indicator. I tried to keep it simple, so it is pretty straight forward. If we open the menu here are our options:
We have the ability to toggle whichever timeframes we want. We also have the ability to toggle on or off the legend that displays the colour codes and the Max and Min highest change.
Max and Min highest change: The max and min highest change simply display the change in correlation over the previous 14 candles. An increasing Max change means that the Max trend is strengthening. If we see an increasing Max change and an increasing Min change (the Min correlation is moving up), this means the stock is bullish. Why? Because the min (i.e. ideally a big negative number) is going up closer to the positives. Therefore, the downtrend is weakening.
If we see both the Max and Min declining (red), that means the uptrend is weakening and downtrend is strengthening. Here are some examples:
Final Thoughts:
And that is the indicator and the theory behind the indicator.
In a nutshell, to summarize, the indicator simply tracks the correlation of a ticker to time on multiple timeframes. This will allow you to make judgements about strength, sentiment and also help you adjust which tools and timeframes you are using to perform your analyses.
As well, to make the indicator more user friendly, I tried to make the colours distinctively different. I was going to do different shades but it was a little difficult to visualize. As such, I have included a toggle-able legend with a breakdown of the colour codes!
That's it my friends, I hope you find it useful!
Safe trades and leave your questions, comments and feedback below!

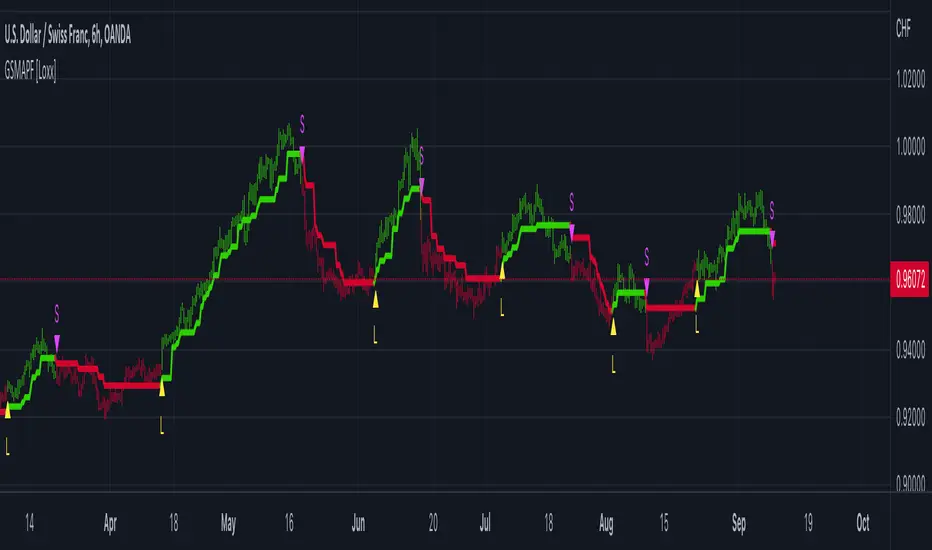
AlphaTrend - ScreenerScreener version of AlphaTrend indicator:
BUY / LONG when AlphaTrend line crosses above its 2 bars offsetted line, and there would be a green filling between them
SELL / SHORT when AlphaTrend line crosses below its 2 bars offsetted line, and filling would be red then.
Default values:
Coefficient: 1, which is the factor of the trailing ATR value
Common Period: 14, which is the length of ATR MFI and RSI
AlphaTrend default uses MFI in the calculation, and MFI (Money Flow Index) needs the volume data of the chart.
If your chart doesn't have the volume data, please select the "Change Calculation" option to use RSI instead of MFI.
Screener Panel:
You can explore 20 different and user-defined tickers, which can be changed from the SETTINGS (shares, crypto, commodities...) on this screener version.
The screener panel shows up right after the bars on the right side of the chart.
Tickers seen in green are the ones that are in an uptrend, according to AlphaTrend.
The ones that appear in red are those in the SELL signal, in a downtrend.
The numbers in front of each Ticker indicate how many bars passed after the last BUY or SELL signal of AlphaTrend.
For example, according to the indicator, when BTCUSDT appears in (3) and in GREEN, Bitcoin switched to BUY signal 3 bars ago.

Candle Combo ScreenerThe Candle Combo Screener allows you to see candlestick combinations for up to 5 different tickers at the same time . If one of the candle combination is detected the corresponding cell will be highlighted to alert you.
Candle Combinations Detected
Bullish Kicker
Bullish & Bearish Oops Reversals
Open Equals High / Low
Inside Day
Select any 5 tickers. Colors and table settings are fully customizable to fit your style.
Bullish Kicker
The opening price of the current candle gaps up above the body of the prior day's candle AND the prior day's candle close was less than the open.
Oops Reversals
Bullish: Price opens below the prior day’s low and closes above.
Bearish: Price opens above the prior day's high and closes below.
Open Equals High / Low
The current candles opening price is equal to either the high or low of the day.
Inside Day
The current candles high and low are contained within the prior day's high and low.

Three-Day Rolling PivotThe three-day rolling pivot is another pivot concept,
which may be used by intermediate positions, for several days or even weeks.
It can be utilized in many ways, such as to determine an entry point or trailing stop.
As the name suggests, this pivot is based on the last three days.
I learned this concept of the book "The logical Trader" by Mark Fisher.
Kudos go to him!
My version of the Three-Day Rolling Pivot uses actual data!
And all similar scripts I have found so far calculate future data and don't take into account the original data.
I hope this script will help some people to do some better decisions.
And I am pleased to get some advice to make this script even better!
Future data vs original data
Pine Script v5 Reference Manual:
Merge strategy for the requested data position... This merge strategy can lead to undesirable effect of getting data from "future" on calculation on history. This is unacceptable in backtesting strategies, but can be useful in indicators.
e2e4 on Stack Overflow said:
Pine v1-v2's security() function is using the lookahead parameter by default, which could be modified in v3-v5...
stackoverflow.com
I haven't found a script which put this into account jet.
I leave this option available for people that wanna more speculated data. But it's disabled by default.
Long/Short Example
You can enter Long when the market cross over the upper line (default color is green) and you should put your trailing stop 1-5 ticks below the lower line (default color is red).
The opposite when Shorting, then the market has to cross down the lower line and your trailing stop should be 1-5 ticks above the upper line.
How does this script work:
First it fetches the highest high of ...
yesterday,
the day before yesterday,
and the day before that.
After that the script looks for the highest high of all three.
Next it does the same for previous lowest low.
Last but not least, it fetches the closing price of the last day.
After that it adds all three prices together and divide them by three.
This result in a three day pivot price.
Then it adds the highest high and lowest low of the three last days and divide it by two.
This gives us the second number we need to calculate the differential.
The differential is the gap between the three day pivot price and the second number.
Sometimes the second number is bigger than the three day pivot price so I took that into account too. Other wise the colors plotted would be on the wrong site.
Finally, the script is rounding the numbers to the nearest minimum tick of that security.

Market TrendThis indicator show how is the trend of 40 stock in SET Index Thailand ordered by market capitalization.
RSI, Moving Average and MACD is used to calculate vale of each stocks.
The trend will be assigned and cumulative as 1 represent uptrend while -1 represents downtrend.
For example RSI
If RSI > RSI moving average, it will be uptrend and return 1.
If RSI < RSI moving average, it will be downtrend and return-1.
The calculation will return positive and negative of total 40 stocks (or other tickers).
If positive is greater than negative, it mean that the market is uptrend and vise versa.
Here some examples
RSI
Moving Average
MACD
You can change to other tickers.
Enjoy..

CVD - Cumulative Volume Delta (Chart)█ OVERVIEW
This indicator displays cumulative volume delta (CVD) as an on-chart oscillator. It uses intrabar analysis to obtain more precise volume delta information compared to methods that only use the chart's timeframe.
The core concepts in this script come from our first CVD indicator , which displays CVD values as plot candles in a separate indicator pane. In this script, CVD values are scaled according to price ranges and represented on the main chart pane.
█ CONCEPTS
Bar polarity
Bar polarity refers to the position of the close price relative to the open price. In other words, bar polarity is the direction of price change.
Intrabars
Intrabars are chart bars at a lower timeframe than the chart's. Each 1H chart bar of a 24x7 market will, for example, usually contain 60 bars at the lower timeframe of 1min, provided there was market activity during each minute of the hour. Mining information from intrabars can be useful in that it offers traders visibility on the activity inside a chart bar.
Lower timeframes (LTFs)
A lower timeframe is a timeframe that is smaller than the chart's timeframe. This script utilizes a LTF to analyze intrabars, or price changes within a chart bar. The lower the LTF, the more intrabars are analyzed, but the less chart bars can display information due to the limited number of intrabars that can be analyzed.
Volume delta
Volume delta is a measure that separates volume into "up" and "down" parts, then takes the difference to estimate the net demand for the asset. This approach gives traders a more detailed insight when analyzing volume and market sentiment. There are several methods for determining whether an asset's volume belongs in the "up" or "down" category. Some indicators, such as On Balance Volume and the Klinger Oscillator , use the change in price between bars to assign volume values to the appropriate category. Others, such as Chaikin Money Flow , make assumptions based on open, high, low, and close prices. The most accurate method involves using tick data to determine whether each transaction occurred at the bid or ask price and assigning the volume value to the appropriate category accordingly. However, this method requires a large amount of data on historical bars, which can limit the historical depth of charts and the number of symbols for which tick data is available.
In the context where historical tick data is not yet available on TradingView, intrabar analysis is the most precise technique to calculate volume delta on historical bars on our charts. This indicator uses intrabar analysis to achieve a compromise between simplicity and accuracy in calculating volume delta on historical bars. Our Volume Profile indicators use it as well. Other volume delta indicators in our Community Scripts , such as the Realtime 5D Profile , use real-time chart updates to achieve more precise volume delta calculations. However, these indicators aren't suitable for analyzing historical bars since they only work for real-time analysis.
This is the logic we use to assign intrabar volume to the "up" or "down" category:
• If the intrabar's open and close values are different, their relative position is used.
• If the intrabar's open and close values are the same, the difference between the intrabar's close and the previous intrabar's close is used.
• As a last resort, when there is no movement during an intrabar and it closes at the same price as the previous intrabar, the last known polarity is used.
Once all intrabars comprising a chart bar are analyzed, we calculate the net difference between "up" and "down" intrabar volume to produce the volume delta for the chart bar.
█ FEATURES
CVD resets
The "cumulative" part of the indicator's name stems from the fact that calculations accumulate during a period of time. By periodically resetting the volume delta accumulation, we can analyze the progression of volume delta across manageable chunks, which is often more useful than looking at volume delta accumulated from the beginning of a chart's history.
You can configure the reset period using the "CVD Resets" input, which offers the following selections:
• None : Calculations do not reset.
• On a fixed higher timeframe : Calculations reset on the higher timeframe you select in the "Fixed higher timeframe" field.
• At a fixed time that you specify.
• At the beginning of the regular session .
• On trend changes : Calculations reset on the direction change of either the Aroon indicator, Parabolic SAR , or Supertrend .
• On a stepped higher timeframe : Calculations reset on a higher timeframe automatically stepped using the chart's timeframe and following these rules:
Chart TF HTF
< 1min 1H
< 3H 1D
<= 12H 1W
< 1W 1M
>= 1W 1Y
Specifying intrabar precision
Ten options are included in the script to control the number of intrabars used per chart bar for calculations. The greater the number of intrabars per chart bar, the fewer chart bars can be analyzed.
The first five options allow users to specify the approximate amount of chart bars to be covered:
• Least Precise (Most chart bars) : Covers all chart bars by dividing the current timeframe by four.
This ensures the highest level of intrabar precision while achieving complete coverage for the dataset.
• Less Precise (Some chart bars) & More Precise (Less chart bars) : These options calculate a stepped LTF in relation to the current chart's timeframe.
• Very precise (2min intrabars) : Uses the second highest quantity of intrabars possible with the 2min LTF.
• Most precise (1min intrabars) : Uses the maximum quantity of intrabars possible with the 1min LTF.
The stepped lower timeframe for "Less Precise" and "More Precise" options is calculated from the current chart's timeframe as follows:
Chart Timeframe Lower Timeframe
Less Precise More Precise
< 1hr 1min 1min
< 1D 15min 1min
< 1W 2hr 30min
> 1W 1D 60min
The last five options allow users to specify an approximate fixed number of intrabars to analyze per chart bar. The available choices are 12, 24, 50, 100, and 250. The script will calculate the LTF which most closely approximates the specified number of intrabars per chart bar. Keep in mind that due to factors such as the length of a ticker's sessions and rounding of the LTF, it is not always possible to produce the exact number specified. However, the script will do its best to get as close to the value as possible.
As there is a limit to the number of intrabars that can be analyzed by a script, a tradeoff occurs between the number of intrabars analyzed per chart bar and the chart bars for which calculations are possible.
Display
This script displays raw or cumulative volume delta values on the chart as either line or histogram oscillator zones scaled according to the price chart, allowing traders to visualize volume activity on each bar or cumulatively over time. The indicator's background shows where CVD resets occur, demarcating the beginning of new zones. The vertical axis of each oscillator zone is scaled relative to the one with the highest price range, and the oscillator values are scaled relative to the highest volume delta. A vertical offset is applied to each oscillator zone so that the highest oscillator value aligns with the lowest price. This method ensures an accurate, intuitive visual comparison of volume activity within zones, as the scale is consistent across the chart, and oscillator values sit below prices. The vertical scale of oscillator zones can be adjusted using the "Zone Height" input in the script settings.
This script displays labels at the highest and lowest oscillator values in each zone, which can be enabled using the "Hi/Lo Labels" input in the "Visuals" section of the script settings. Additionally, the oscillator's value on a chart bar is displayed as a tooltip when a user hovers over the bar, which can be enabled using the "Value Tooltips" input.
Divergences occur when the polarity of volume delta does not match that of the chart bar. The script displays divergences as bar colors and background colors that can be enabled using the "Color bars on divergences" and "Color background on divergences" inputs.
An information box in the lower-left corner of the indicator displays the HTF used for resets, the LTF used for intrabars, the average quantity of intrabars per chart bar, and the number of chart bars for which there is LTF data. This is enabled using the "Show information box" input in the "Visuals" section of the script settings.
FOR Pine Script™ CODERS
• This script utilizes `ltf()` and `ltfStats()` from the lower_tf library.
The `ltf()` function determines the appropriate lower timeframe from the selected calculation mode and chart timeframe, and returns it in a format that can be used with request.security_lower_tf() .
The `ltfStats()` function, on the other hand, is used to compute and display statistical information about the lower timeframe in an information box.
• The script utilizes display.data_window and display.status_line to restrict the display of certain plots.
These new built-ins allow coders to fine-tune where a script’s plot values are displayed.
• The newly added session.isfirstbar_regular built-in allows for resetting the CVD segments at the start of the regular session.
• The VisibleChart library developed by our resident PineCoders team leverages the chart.left_visible_bar_time and chart.right_visible_bar_time variables to optimize the performance of this script.
These variables identify the opening time of the leftmost and rightmost visible bars on the chart, allowing the script to recalculate and draw objects only within the range of visible bars as the user scrolls.
This functionality also enables the scaling of the oscillator zones.
These variables are just a couple of the many new built-ins available in the chart.* namespace.
For more information, check out this blog post or look them up by typing "chart." in the Pine Script™ Reference Manual .
• Our ta library has undergone significant updates recently, including the incorporation of the `aroon()` indicator used as a method for resetting CVD segments within this script.
Revisit the library to see more of the newly added content!
Look first. Then leap.

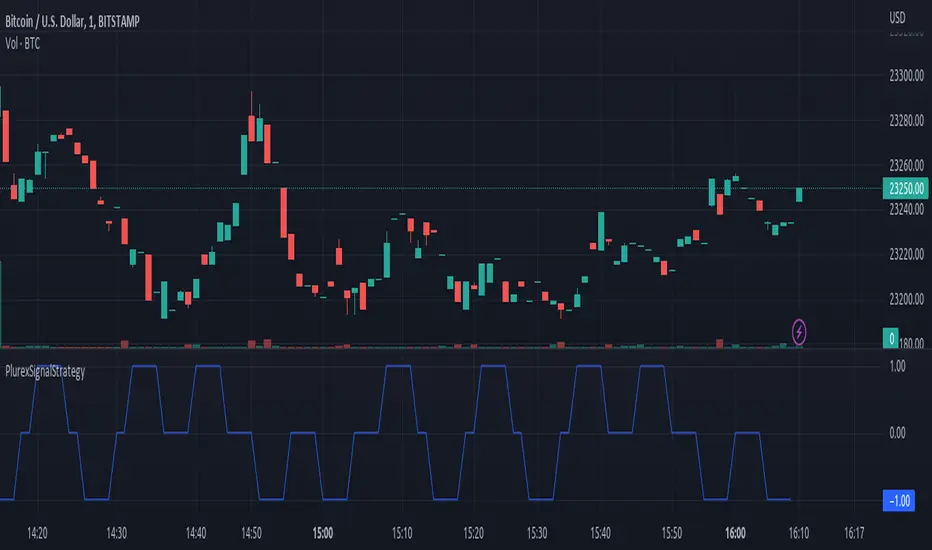
PlurexSignalStrategyLibrary "PlurexSignalStrategy"
Provides functions that wrap the built in TradingView strategy functions so you can seemlessly integrate with Plurex Signal automation.
NOTE: Be sure to:
- set your strategy default_qty_value to the default entry percentage of your signal
- set your strategy default_qty_type to strategy.percent_of_equity
- set your strategy pyramiding to some value greater than 1 or something appropriate to your strategy in order to have multiple entries.
long(secret, budgetPercentage, priceLimit, marketOverride)
Open a new long entry. Wraps strategy function and sends plurex message as an alert.
Parameters:
secret : The secret for your Signal on plurex
budgetPercentage : Optional, The percentage of budget to use in the entry.
priceLimit : Optional, The worst price to accept for the entry.
marketOverride : Optional, defaults to the syminfo for the ticker. Use the `plurexMarket` function to build your own.
longAndFixedStopLoss(secret, stop, budgetPercentage, priceLimit, marketOverride)
Open a new long entry. Wraps strategy function and sends plurex message as an alert. Also sets a gobal stop loss for full open position
Parameters:
secret : The secret for your Signal on plurex
stop : The trigger price for the stop loss. See strategy.exit documentation
budgetPercentage : Optional, The percentage of budget to use in the entry.
priceLimit : Optional, The worst price to accept for the entry.
marketOverride : Optional, defaults to the syminfo for the ticker. Use the `plurexMarket` function to build your own.
longAndTrailingStopLoss(secret, trail_offset, trail_price, trail_points, budgetPercentage, priceLimit, marketOverride)
Open a new long entry. Wraps strategy function and sends plurex message as an alert. Also sets a gobal trailing stop loss for full open position. You must set one of trail_price or trail_points.
Parameters:
secret : The secret for your Signal on plurex
trail_offset : See strategy.exit documentation
trail_price : See strategy.exit documentation
trail_points : See strategy.exit documentation
budgetPercentage : Optional, The percentage of budget to use in the entry.
priceLimit : Optional, The worst price to accept for the entry.
marketOverride : Optional, defaults to the syminfo for the ticker. Use the `plurexMarket` function to build your own.
short(secret, budgetPercentage, priceLimit, marketOverride)
Open a new short entry. Wraps strategy function and sends plurex message as an alert.
Parameters:
secret : The secret for your Signal on plurex
budgetPercentage : Optional, The percentage of budget to use in the entry.
priceLimit : Optional, The worst price to accept for the entry.
marketOverride : Optional, defaults to the syminfo for the ticker. Use the `plurexMarket` function to build your own.
shortAndFixedStopLoss(secret, stop, budgetPercentage, priceLimit, marketOverride)
Open a new short entry. Wraps strategy function and sends plurex message as an alert. Also sets a gobal stop loss for full open position
Parameters:
secret : The secret for your Signal on plurex
stop : The trigger price for the stop loss. See strategy.exit documentation
budgetPercentage : Optional, The percentage of budget to use in the entry.
priceLimit : Optional, The worst price to accept for the entry.
marketOverride : Optional, defaults to the syminfo for the ticker. Use the `plurexMarket` function to build your own.
shortAndTrailingStopLoss(secret, trail_offset, trail_price, trail_points, budgetPercentage, priceLimit, marketOverride)
Open a new short entry. Wraps strategy function and sends plurex message as an alert. Also sets a gobal trailing stop loss for full open position. You must set one of trail_price or trail_points.
Parameters:
secret : The secret for your Signal on plurex
trail_offset : See strategy.exit documentation
trail_price : See strategy.exit documentation
trail_points : See strategy.exit documentation
budgetPercentage : Optional, The percentage of budget to use in the entry.
priceLimit : Optional, The worst price to accept for the entry.
marketOverride : Optional, defaults to the syminfo for the ticker. Use the `plurexMarket` function to build your own.
closeAll(secret, marketOverride)
Close all positions. Wraps strategy function and sends plurex message as an alert.
Parameters:
secret : The secret for your Signal on plurex
marketOverride : Optional, defaults to the syminfo for the ticker. Use the `plurexMarket` function to build your own.
closeLongs(secret, marketOverride)
close all longs. Wraps strategy function and sends plurex message as an alert.
Parameters:
secret : The secret for your Signal on plurex
marketOverride : Optional, defaults to the syminfo for the ticker. Use the `plurexMarket` function to build your own.
closeShorts(secret, marketOverride)
close all shorts. Wraps strategy function and sends plurex message as an alert.
Parameters:
secret : The secret for your Signal on plurex
marketOverride : Optional, defaults to the syminfo for the ticker. Use the `plurexMarket` function to build your own.
closeLastLong(secret, marketOverride)
Close last long entry. Wraps strategy function and sends plurex message as an alert.
Parameters:
secret : The secret for your Signal on plurex
marketOverride : Optional, defaults to the syminfo for the ticker. Use the `plurexMarket` function to build your own.
closeLastShort(secret, marketOverride)
Close last short entry. Wraps strategy function and sends plurex message as an alert.
Parameters:
secret : The secret for your Signal on plurex
marketOverride : Optional, defaults to the syminfo for the ticker. Use the `plurexMarket` function to build your own.
closeFirstLong(secret, marketOverride)
Close first long entry. Wraps strategy function and sends plurex message as an alert.
Parameters:
secret : The secret for your Signal on plurex
marketOverride : Optional, defaults to the syminfo for the ticker. Use the `plurexMarket` function to build your own.
closeFirstShort(secret, marketOverride)
Close first short entry. Wraps strategy function and sends plurex message as an alert.
Parameters:
secret : The secret for your Signal on plurex
marketOverride : Optional, defaults to the syminfo for the ticker. Use the `plurexMarket` function to build your own.
PlurexSignalCoreLibrary "PlurexSignalCore"
General purpose functions and helpers for use in more specific Plurex Signal alerting scripts and libraries
plurexMarket()
Build a Plurex market string from a base and quote asset symbol.
Returns: A market string that can be used in Plurex Signal messages.
tickerToPlurexMarket()
Builds Plurex market string from the syminfo
Returns: A market string that can be used in Plurex Signal messages.
simpleMessage(secret, action, marketOverride)
Builds Plurex Signal Message json to be sent to a Signal webhook
Parameters:
secret : The secret for your Signal on plurex
action : The action of the message. One of .
marketOverride : Optional, defaults to the syminfo for the ticker. Use the `plurexMarket` function to build your own.
Returns: A json string message that can be used in alerts to send messages to Plurex.
entryMessage(secret, isLong, budgetPercentage, priceLimit, marketOverride)
Builds Plurex Signal Entry Message json to be sent to a Signal webhook with optional parameters for budget and price limits.
Parameters:
secret : The secret for your Signal on plurex
isLong : The action of the message. true for LONG, false for SHORT.
budgetPercentage : Optional, The percentage of budget to use in the entry.
priceLimit : Optional, The worst price to accept for the entry.
marketOverride : Optional, defaults to the syminfo for the ticker. Use the `plurexMarket` function to build your own.
Returns: A json string message that can be used in alerts to send messages to Plurex.
long(secret, budgetPercentage, priceLimit, marketOverride)
Builds Plurex Signal LONG Message json to be sent to a Signal webhook with optional parameters for budget and price limits.
Parameters:
secret : The secret for your Signal on plurex
budgetPercentage : Optional, The percentage of budget to use in the entry.
priceLimit : Optional, The worst price to accept for the entry.
marketOverride : Optional, defaults to the syminfo for the ticker. Use the `plurexMarket` function to build your own.
Returns: A json string message that can be used in alerts to send messages to Plurex.
short(secret, budgetPercentage, priceLimit, marketOverride)
Builds Plurex Signal SHORT Message json to be sent to a Signal webhook with optional parameters for budget and price limits.
Parameters:
secret : The secret for your Signal on plurex
budgetPercentage : Optional, The percentage of budget to use in the entry.
priceLimit : Optional, The worst price to accept for the entry.
marketOverride : Optional, defaults to the syminfo for the ticker. Use the `plurexMarket` function to build your own.
Returns: A json string message that can be used in alerts to send messages to Plurex.
closeAll(secret, marketOverride)
Builds Plurex Signal CLOSE_ALL Message json to be sent to a Signal webhook.
Parameters:
secret : The secret for your Signal on plurex
marketOverride : Optional, defaults to the syminfo for the ticker. Use the `plurexMarket` function to build your own.
Returns: A json string message that can be used in alerts to send messages to Plurex.
closeShorts(secret, marketOverride)
Builds Plurex Signal CLOSE_SHORTS Message json to be sent to a Signal webhook.
Parameters:
secret : The secret for your Signal on plurex
marketOverride : Optional, defaults to the syminfo for the ticker. Use the `plurexMarket` function to build your own.
Returns: A json string message that can be used in alerts to send messages to Plurex.
closeLongs(secret, marketOverride)
Builds Plurex Signal CLOSE_LONGS Message json to be sent to a Signal webhook.
Parameters:
secret : The secret for your Signal on plurex
marketOverride : Optional, defaults to the syminfo for the ticker. Use the `plurexMarket` function to build your own.
Returns: A json string message that can be used in alerts to send messages to Plurex.
closeFirstLong(secret, marketOverride)
Builds Plurex Signal CLOSE_FIRST_LONG Message json to be sent to a Signal webhook.
Parameters:
secret : The secret for your Signal on plurex
marketOverride : Optional, defaults to the syminfo for the ticker. Use the `plurexMarket` function to build your own.
Returns: A json string message that can be used in alerts to send messages to Plurex.
closeLastLong(secret, marketOverride)
Builds Plurex Signal CLOSE_LAST_LONG Message json to be sent to a Signal webhook.
Parameters:
secret : The secret for your Signal on plurex
marketOverride : Optional, defaults to the syminfo for the ticker. Use the `plurexMarket` function to build your own.
Returns: A json string message that can be used in alerts to send messages to Plurex.
closeFirstShort(secret, marketOverride)
Builds Plurex Signal CLOSE_FIRST_SHORT Message json to be sent to a Signal webhook.
Parameters:
secret : The secret for your Signal on plurex
marketOverride : Optional, defaults to the syminfo for the ticker. Use the `plurexMarket` function to build your own.
Returns: A json string message that can be used in alerts to send messages to Plurex.
closeLastShort(secret, marketOverride)
Builds Plurex Signal CLOSE_LAST_SHORT Message json to be sent to a Signal webhook.
Parameters:
secret : The secret for your Signal on plurex
marketOverride : Optional, defaults to the syminfo for the ticker. Use the `plurexMarket` function to build your own.
Returns: A json string message that can be used in alerts to send messages to Plurex.
Spread ChartThis script lets you chart a spread of a maximum of 3 tickers (one of them being the ticker in the main chart).
Y axis is the currency amount of the spread, that is calculated by this formula:
Y = PnL = quantity * price * handleValue
Y is calculated for each ticker specified, and the sum of Ys obtained is plotted.
this way it is possible to view the PnL of the spread directly.
It is necessary to specify the handle value (point value) in the script inputs (not for the main chart ticker).
A table summarizes the spread configuration, containing all inputs.

PlurexSignalLibrary "PlurexSignal"
Provides functions that wrap the built in TradingView strategy functions so you can seemlessly integrate with Plurex Signal automation.
NOTE: Be sure to set your strategy close_entries_rule="ANY" and pyramiding=20 or some other amount appropriate to your strategy in order to have multiple entries.
plurexMarket()
Build a Plurex market string from a base and quote asset symbol.
Returns: A market string that can be used in Plurex Signal messages.
tickerToPlurexMarket()
Builds Plurex market string from the syminfo
Returns: A market string that can be used in Plurex Signal messages.
simpleMessage(secret, action, marketOverride)
Builds Plurex Signal Message json to be sent to a Signal webhook
Parameters:
secret : The secret for your Signal on plurex
action : The action of the message. One of .
marketOverride : Optional, defaults to the syminfo for the ticker. Use the `plurexMarket` function to build your own.
Returns: A json string message that can be used in alerts to send messages to Plurex.
long(secret, marketOverride, qty)
Open a new long entry. Wraps strategy function and sends plurex message as an alert.
Parameters:
secret : The secret for your Signal on plurex
marketOverride : Optional, defaults to the syminfo for the ticker. Use the `plurexMarket` function to build your own.
qty : Corresponds to strategy.entry qty
short(secret, marketOverride, qty)
Open a new short entry. Wraps strategy function and sends plurex message as an alert.
Parameters:
secret : The secret for your Signal on plurex
marketOverride : Optional, defaults to the syminfo for the ticker. Use the `plurexMarket` function to build your own.
qty : Corresponds to strategy.entry qty
closeAll(secret, marketOverride)
Close all positions. Wraps strategy function and sends plurex message as an alert.
Parameters:
secret : The secret for your Signal on plurex
marketOverride : Optional, defaults to the syminfo for the ticker. Use the `plurexMarket` function to build your own.
closeLongs(secret, marketOverride)
Close all longs. Wraps strategy function and sends plurex message as an alert.
Parameters:
secret : The secret for your Signal on plurex
marketOverride : Optional, defaults to the syminfo for the ticker. Use the `plurexMarket` function to build your own.
closeShorts(secret, marketOverride)
Close all shorts. Wraps strategy function and sends plurex message as an alert.
Parameters:
secret : The secret for your Signal on plurex
marketOverride : Optional, defaults to the syminfo for the ticker. Use the `plurexMarket` function to build your own.
closeLastLong(secret, marketOverride)
Close last long entry. Wraps strategy function and sends plurex message as an alert.
Parameters:
secret : The secret for your Signal on plurex
marketOverride : Optional, defaults to the syminfo for the ticker. Use the `plurexMarket` function to build your own.
closeFirstLong(secret, marketOverride)
Close first long entry. Wraps strategy function and sends plurex message as an alert.
Parameters:
secret : The secret for your Signal on plurex
marketOverride : Optional, defaults to the syminfo for the ticker. Use the `plurexMarket` function to build your own.
closeLastShort(secret, marketOverride)
Close last short entry. Wraps strategy function and sends plurex message as an alert.
Parameters:
secret : The secret for your Signal on plurex
marketOverride : Optional, defaults to the syminfo for the ticker. Use the `plurexMarket` function to build your own.
closeFirstShort(secret, marketOverride)
Close first short entry. Wraps strategy function and sends plurex message as an alert.
Parameters:
secret : The secret for your Signal on plurex
marketOverride : Optional, defaults to the syminfo for the ticker. Use the `plurexMarket` function to build your own.

Generalized Step Moving Average w/ Pips Filter [Loxx]Generalized Step Moving Average w/ Pips Filter is a stepping function on source input to derive a moving average. This general form the stepping can also be applied to any other input such as EMA, SMA, HMA, WMA, etc.. This moving average employ a filtering system based on the following:
Core filter, both min and max value: pips * (multiplier) or the (average of momentum) * (multiplier).
Post processing filter: pips * (multiplier)
These filtering options require trend to shift by the above values before changing direction thereby reducing noise and yielding a better defined trend.
Things to note
This indicator requires fine tuning to make it work on all tickers. If you place this on a chart and it shows all green or red candles, then you must adjust the indicator to coincide with the pip movement of that ticker.
This indicator can be used on any timeframe.
Included
Bar coloring
Signals
Alerts
Loxx's Expanded Source Types
RaenonX - Manual PnL TrackerChange the "ticker" field in the settings to the ticker to track (for example, "SQQQ") before use.
Manually track the PnL of a single ticker.
The current PnL will be shown at the right bottom of the chart.

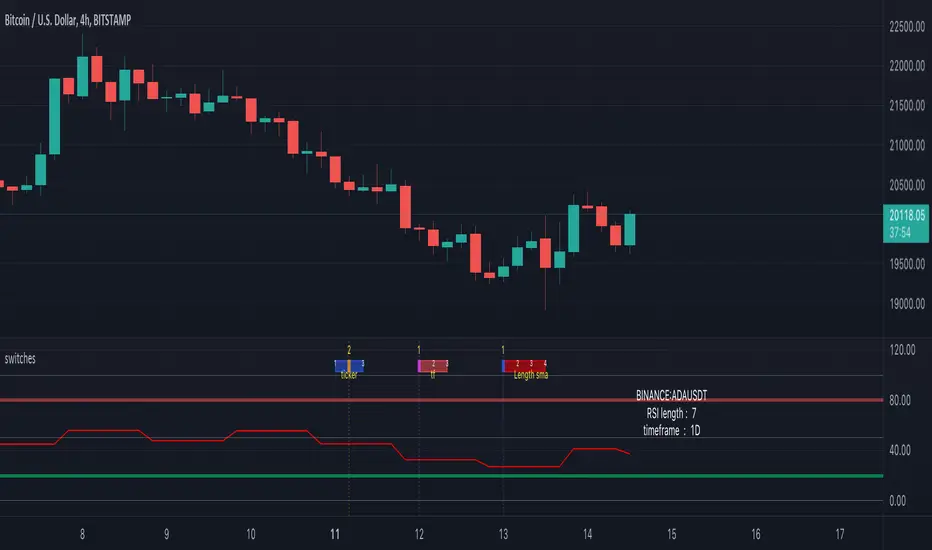
switches [experimental / tools]This scripts shows a tool which enables switching between settings without opening the settings
In this case you can switch between a RSI of 3 different tickers, 3 different higher timeframes, and 4 different lengths.
How does it work?
The position of a 'time line' is compared with the position of a box.
Changing the position of the line changes the settings.
The settings need to be set upfront though,
if you want to switch between length 7, 10, 14, 21 they need to be set first.
Example:
One wants to switch between RSI of SOLUSDT, ADAUSDT and FILUSDT
First set your tickers
-> Settings -> Set 1 -> Ticker
Then tap/click and move the line
And there you go!
The same with Timeframe and Length
Important:
It is not possible to automatically set the boxes/line at current time,
so these (settings -> date at Box, Line) need to be set in the beginning
Cheers!
TASC 2022.6 Ehlers' Loops - SectorsInspired by the latest TASC article, the crocker graph is expanded to show 5 tickers.
for commodity also draws a side box with current tickers candles so it can be used as standalone.

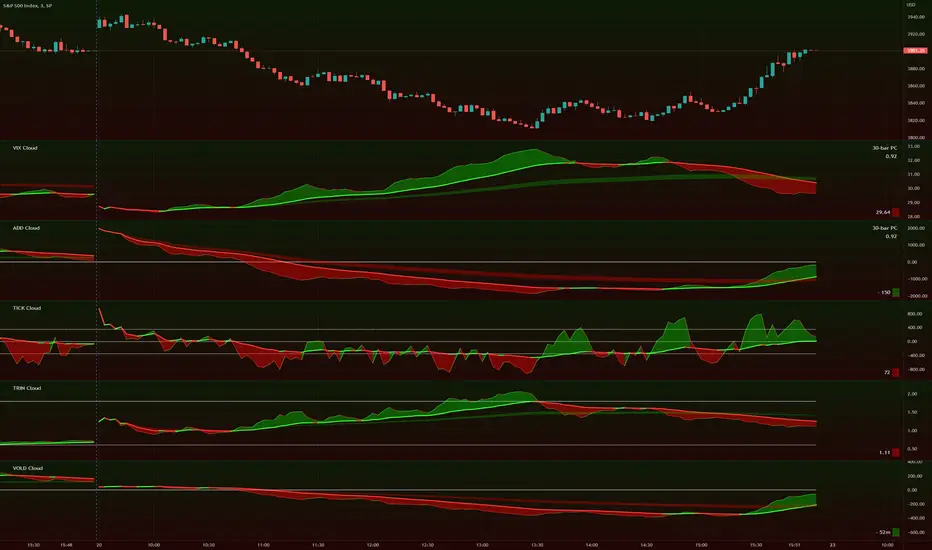
TIG's Market Internals Clouds Indicator v2.0=================================
== GENERAL INTRODUCTION
=================================
If you find market internals inform your intraday trading decisions (SPX, ES futures, SPY or more generally) this may be helpful.
Currently available internals are:
- ADD
- TICK
- TRIN
- VIX
- VOLD
Also, you can display your favorite alternative market internal (or BTC, if you want?!) by entering the relevant ticker in the 'Custom' field
=================================
== NOTES
=================================
The default EMA lengths seem to work reasonably well for 1, 2, 3-minute timeframes (except for TICK - you may wish to apply a bit more smoothing to TICK to reduce the noise)
Of course; you can add this indicator to your chart multiple times, and display a different internal each time.
The default Text Color is set as a mid-grey, which is readable in both TV color schemes. I prefer dark mode, and so I change the text color to white. You can't see the scheme setting from within a script, unfortunately, so this can't be automated.
=================================
== EXPERIMENTAL FEATURE
=================================
As a free bonus, the indicator can display the 30-bar (default) Pearson Correlation Coefficient between the internal, and price action (based on the super-fast EMA, to give a bit of smoothing). This may give a clue as to whether or not the market is aligned with what the internal is doing, or if the market (today) is not correlated with the particular internal.
Very roughly speaking:
- 0.50 means that 50% of the price action can be explained by reference to the internal. This is about the same level of correlation between VIX and Actual Move
- 0.80 suggests pretty strong correlation
I don't know why (yet) but sometimes this works, and sometimes it doesn't display a sensible figure.
=================================
== QUESTIONS AND FEEDBACK
=================================
If you have any general questions about market internals, Google is your friend.
If you have any specific queries, bug reports, feature requests or general feedback about this indicator please leave a comment below, and I'll get back to you ASAP!