Simple and Exponential MAAllow moving averages to be displayed without needing to use up multiple charting indicators individually (20, 50, 100, 200, 300 lengths for both EMA and SMA)
Search in scripts for "沪深300指数最高点"

Real Time Volume checkerThis indicator was designed to work in real time, and needs the "calculate on every tick" turned on. It verifies if the volume from the current candle is increasing more or less than the average.
Example using 5 min. candles:
1 minute is 20% of the time for the candle. So, if the volume is at 20% or below of the vol.average, the market is stable(price not moving much). If at 1 minute(20% of time) volume is say, at 37%, a big move is happening.
The color of the candle shows the movement direction. A gray means the volume was not important, below average.
The historical candles show how much volume infuenced the price for the corresponding candle.
The current candle is working REAL TIME.
The blue line shows how much time has passed for the candle to complete. All candles are 100% complete(yeah, duh), except for the last one, the line touches zero at start of candle, and slowly fills up to1(1=100%)until the candle ends.
INPUTS:
vol MA size: sets the lenght of the volume average. set to your heard desires
candle Period: set to the number of seconds in the period you chose. 5min = 300, 1h = 3600 and so on. Must be correct, or the results turn into crap
Limit: the value below which the candle is a "non-important" candle. 1 = 100% of average
NOTE: in the very first seconds, the indicator goes crazy. it's expected, due to computed values very close to zero used in the math. after some seconds it stabilizes :)

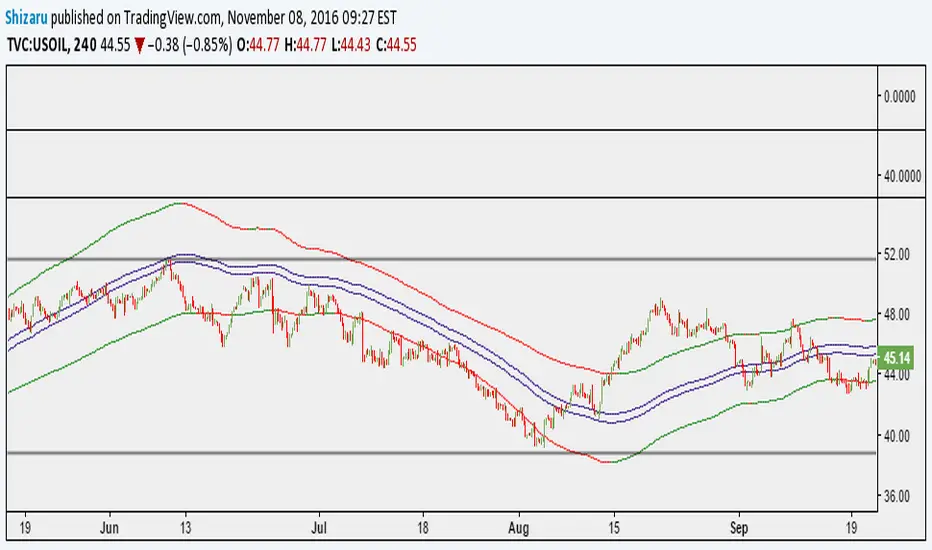
Linear Regression ChannelThe original script was posted on ProRealCode by user Nicolas.
Another channel indicator made of standard deviation of a 2 centered linear regression of the 300 last periods of high and low price values (by default).
Vdub FX SniperVX v1Vdub FX SniperVX v1
Notes on chart
Please note the Trend directional Buy sell signals generated are configure to be super fast on candle opening. The down side to this is signals may switch direction mid stream.
ITM candlesticks signals generated went 6/300 Losses on a 1 min chart.
the blue line indicates reversal zones. Buy / sell targets are at the next projected line Change TF settings to suit
Sniper series
