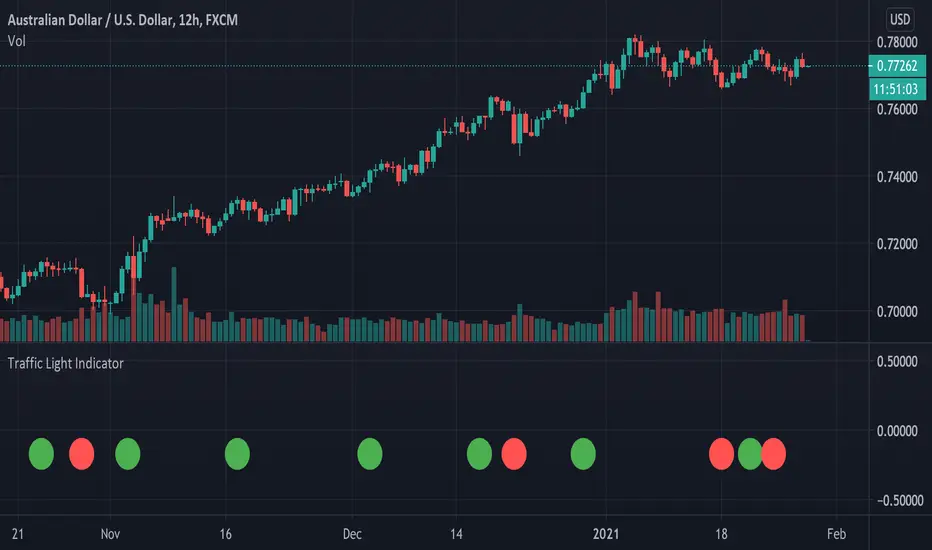
Traffic Light IndicatorThe traffic light indicator is designed to be as simple as possible to avoid the steep learning curve that comes with many other indicators.
- A Green Circle indicated the price is likely to go up.
- A Red Circle indicates to price is likely to go down.
- A Yellow Circle means there's some indecision and you should consider tightening stops or taking profits if you're already in a trade.
The circles are derived from the combination of a dozen or so indicators with the goal to simplify trading and declutter the charts.
It doesn't need to paired with another indicator but having some simple moving averages and keeping an eye on the volume might help you identify possible take profit areas.
Simple

Global Indices Weekly Investment StrategyThis strategy aims to provide the optimal times to buy/sell assets on a long term basis. From my testing it works best on a weekly or monthly time frame. The default values are currently set to work best on Global Indices such as the S&P 500. It is very simple in its core, it uses price historical price action to estimate where in a market cycle the asset is. Then combined with a basic Moving-Average-like baseline and long term trend oscillator to gauge direction, it attempts to find the best time to buy/sell an asset to reduce capital draw-down and maximise future profits.
Returns here are based on an account balance and trade sizes of £100,000 with no compounding. Does not take into account exchange fees - 0% commission.
Please let me know if you have found any optimal settings for a given market using this strategy; such as all commodities. Or if you have any suggestions on how the strategy could be improved in general.

[Vold] Multiple Moving AveragesThis script contains 15 highly customizable moving averages, the following options are currently available:
1. Activate Moving Average: Activate or deactivate moving average.
2. Use Resolution: Activate or deactivate resolution configuration.
3. Resolution: The resolution of the moving average (default: 4H).
3. Length: The length of periods of the moving average (default: 9).
4. Source: The source of the moving average (default: price close).
5. Type: The type of the moving average (Simple, Exponential, Weighted, Hull), (default: Simple).
6. Offset: The offset of the moving average (default: 0).

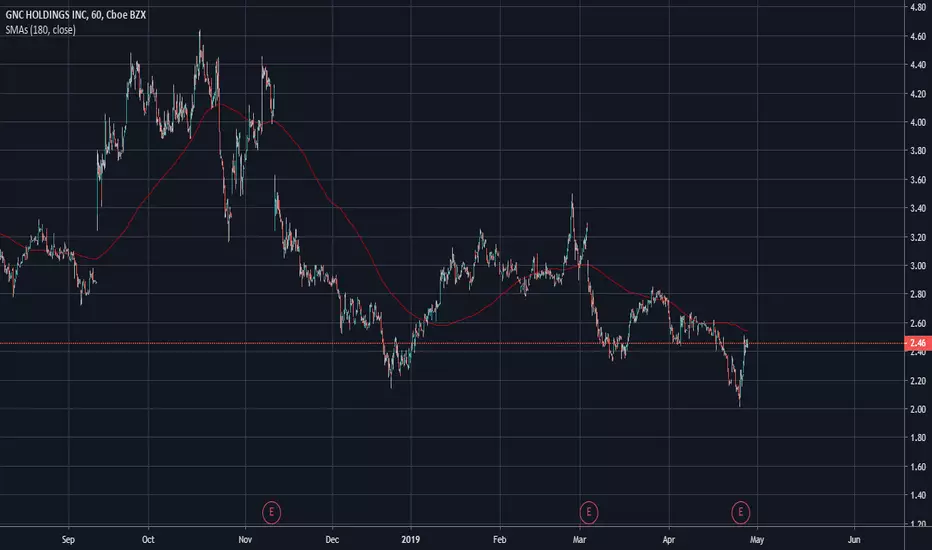
SMA 21/30/50/100/200 with Cross by DragonByteCombines several key simple moving averages into one slot without going overboard. Includes cross indicators between the 50/100 and the 50/200 day SMA's.

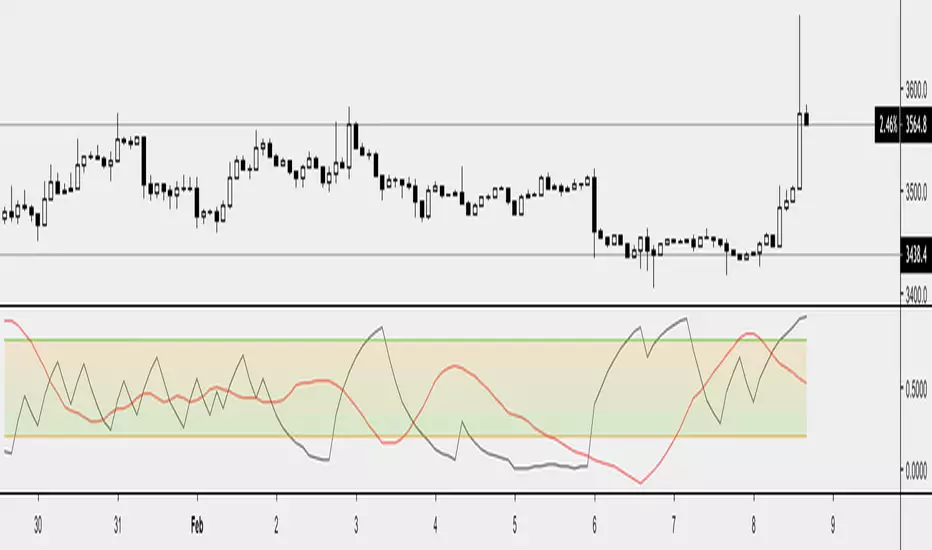
Function : Know Sure Thing ! (KST)Firstly : Know Sure Thing, or KST , is a momentum oscillator developed by Martin Pring to make rate-of-change readings easier for traders to interpret. In a 1992 Stocks and Commodities article, Mr. Pring referred to the indicator as "Summed Rate of Change ( KST )," but the KST term stuck with technical analysts. The indicator is relatively common among technical analysts preferring momentum oscillators to make decisions.
References : Investopedia (www.investopedia.com )
Let's start :
Simply :
KST : Above point 0 means long position (positive zone), below point 0 (negative zone) means short position.
I liked this indicator more than RSI because we can evaluate the breaking points of the channels we draw on the indicator according to the regions.
Plus area (positive area), breaking the channel upwards may indicate a very strong rise, and minus area (negative area) the channel downwards may indicate a very strong fall.
As a person who is very keen to identify major trends in advance, I like the KST indicator to approach the target quickly and simply. I also find it very successful in terms of divergences.
CAUTION : This indicator has been written before many times on TV. I have no effort on it. I saved loads only for variable periods. But I have enough experience to say that you are successful in trends with KST . Nevertheless, do not use it alone, as other promoters may benefit.
For example , I divided the standard periods into 4 as in the script. With a correct adaptive period, it has the potential to contribute greatly to accurate moves! You can use with mutable variable periods. Abundant trend lines can be drawn on the indicator and divergences between price and indicator can be sought. Best regards!

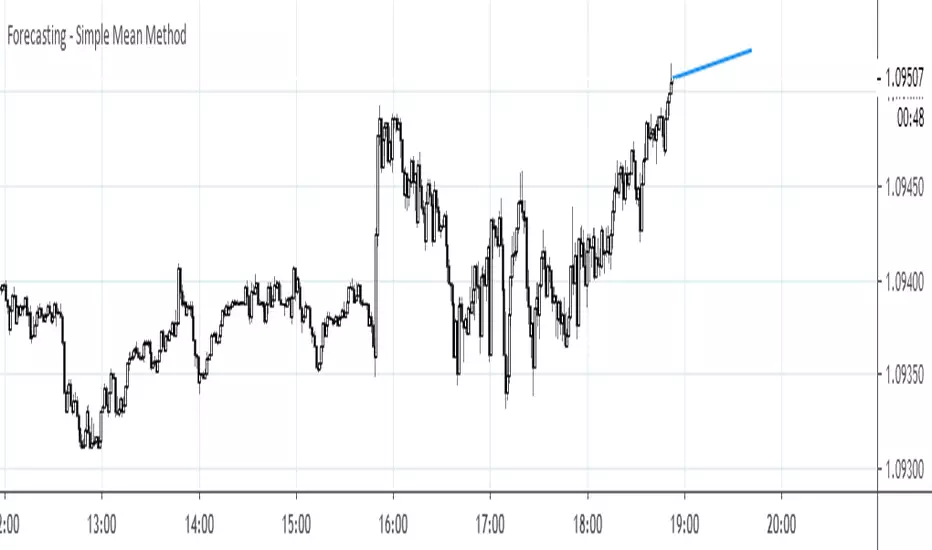
Forecasting - Simple Mean MethodThis is a continuation of my series on forecasting techniques. The idea behind the Simple Mean method is to somehow extend historical mean to the future. In this case a forecast equals to last value plus average change.
SMA X RSI - by @CryptoMrDavis -Another script that might be useful for your trading setup.
It use RSI and two SMA's.
Happy trading
+++ use this tool on your own risk. i'm not responsible for your loses +++
Show some ❤
____________________________________________________________________________
BTC: 1GVRDK3HHr9CKM5SF2CGpCNXFuavB3L4j9
ETH: 0x7b825fa752b9926D3E8397cDb1d9E5473D074646
XMR: 41zL2SQS7zyZmwXKng2TeUWsMi5vMmkgSdDCjULUTvM6ichwm1E2ZDEYGt56zk9ghoM9bekhjycSwa8amtTcB2JiUet5jtg
NEO: AXja5xPDhczfm2ujHyBfpkQAAnMsXsazmb
ZEC: zcZzFkRx95cp7MtuW8wLhC5zz5RYF9QkT2uPPmhZZHc6ppXepHGgCSeAS1rtD6WFdqsM5p1gZm2gfirnrnviucsdP4aCpqU
XLM: GAXUQJSW55C7MAC4GI26NZUGIKSHFDVFRFKZCXPLMPY4HCADSDT55XK6
WAVES: 3PCMkNpMHxSraTCkwV1ENcBKa9sXbVCGjQX
BCH: qz57n04ud6mn42u00aymqkku8tfh0lk4jv9c28mjvv
____________________________________________________________________________
++++ cryptotradingresource.com ++++
____________________________________________________________________________

Kozlod - Simple BB Strategy - XRPBTC - 1 minutePretty good performance of simple BB on XRPBTC 1minute chart.
No SL or PT used.
And remember:
Past performance does not guarantee future results.


Rogers & Satchell Volatility EstimationFirst off, a huge thank you to the following people:
theheirophant: www.tradingview.com
alexgrover: www.tradingview.com
NGBaltic: www.tradingview.com
The Rogers & Satchell function is a volatility estimator that outperforms other estimators when the underlying follows a geometric Brownian motion with a drift (historical data mean returns different from zero). As a result, it provides a better volatility estimation when the underlying is trending. However, the Rogers & Satchell estimator does not account for jumps in price (gaps). It assumes no opening jump. The function uses the open, close, high, and low price series in its calculation and it has only one parameter, which is the period to use to estimate the volatility.
This script allows you to transform the volatility reading. The intention of this is to be able to compare volatility across different assets and timeframes. Having a relative reading of volatility also allows you to better gauge volatility within the context of current market conditions.
For the signal lie I chose a repulsion moving average to remove choppy crossovers of the estimator and the signal. This may have been a mistake, so in the near-future I might update so that the MA can be selected. Let me know if you have any opinions either way.
Want to Learn?
If you'd like the opportunity to learn Pine but you have difficulty finding resources to guide you, take a look at this rudimentary list: docs.google.com
The list will be updated in the future as more people share the resources that have helped, or continue to help, them. Follow me on Twitter to keep up-to-date with the growing list of resources.
Suggestions or Questions?
Don't even kinda hesitate to forward them to me. My (metaphorical) door is always open.
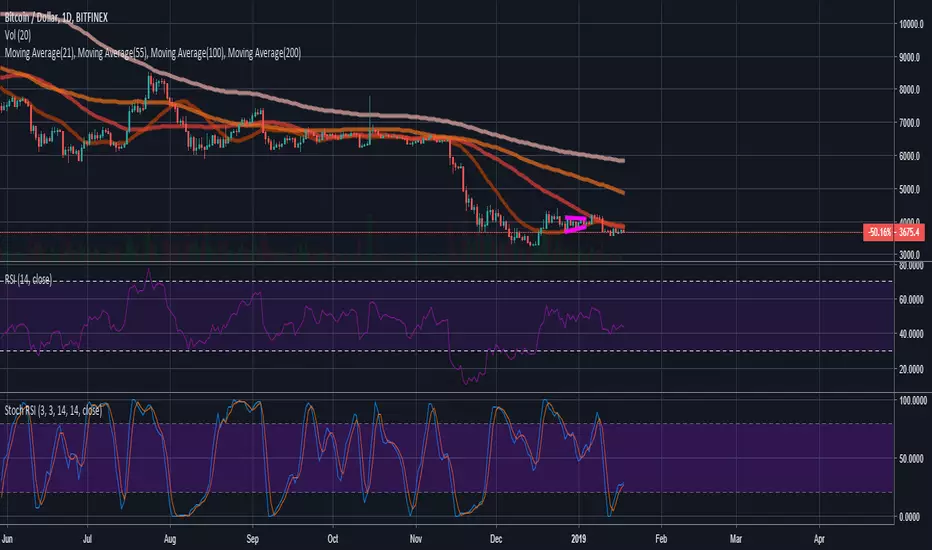
Arkads VisionArkad's Vision is a visual tool used to accurately identify what trend the coin / stock is in. Using Moving average and RSI, it can accurately identify Bullish trends, Bearish Trends, and consolidation.
Bullish Trend = Buy the lows
Bearish Trend = Sell the Highs
Consolidation = Stay out / Be Patient.
The paid version of this script, Arkad's Foresight includes Top and Bottom indicators to trade / swing trade with ease. The paid version is .1BTC or 2ETH. Check it out on my twitter
@CryptoArkad
/// BTC --- 1PSWjCpPXQ3uHjdVUJWR5y2Q6aCa3X8Jog
/// XRP --- rEb8TK3gBgk5auZkwc6sHnwrGVJH8DuaLh TAG 107248818
/// TRX --- TEjoZ3qnGxqZBLAfn7z9iAkhjV79MV3F5h
/// ETH --- 0xf5fb4c8e9ff6bf3f0df1648ab4a355b199611c91

Multiple MACD RSI simple strategySimple strategy script I've had for a while but looks like I never published.
Although it is one of my most simple it seems to have the best profitability. It is pretty rough though. the Stoch RSI has only a little weight to the trade trigger. I'll refine it more over time or you can by all means. Basically the Stoch RSI current K line has to be OVER 40 to trigger a SELL. It has no effect on buy side.
The triggers are roughly as follows:
Year - since so many assets have gone 2x, 3x, 10x+ since 2013 having a strategy that earns a 500% return from 2013 to now isn't that good if buy-and-holding would have got you 800%. This eliminates some of that noise and makes it a little easier to quickly gauge success. So buy/sell trigger need a value of greater or equal to 2018 (default)
MACD 1 - First MACD (short) needs to indicate greater than 0 to buy or less than 0 to sell.
MACD 2 - Same as MACD1 but for second MACD set (long)
Uptrend - Latest close + high divided by last periods close + high needs to be grater than 1. So if latest is 34.30 close and 34.60 high and previous interval is 34.80 close and 34.82 high, that is 0.99 and will not trigger a buy trade.
Downtrend - Same thing but close + low and less than 1.
This script/strategy is pretty rough but if there is interest I'll polish it more since it is a pretty solid but simple strategy for most assets.

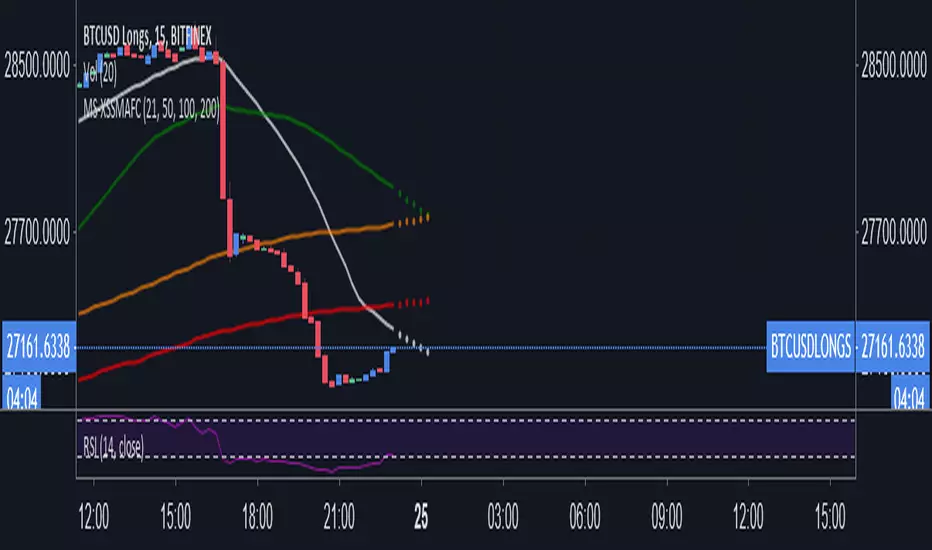
Meister Shredder - Simple Moving Averages x4 ForecastIncludes the 21, 50, 100 and 200 SMA and 6 bar forecast
MTF Deviation - Mtrl_ScientistHi everyone,
There are a lot of possible ways to look at markets and find valid patterns.
This time, I've looked at how shorter time frames deviate from the overall price consensus.
What you're seeing here is a range-bound difference of the lowest time frame from the overall price consensus (baseline), represented as blue line.
When lower time frames agree with the baseline, the difference becomes 0.
Logically, this difference cannot deviate too much from the baseline, and to quantify that, I've added fib-levels based on a deviation percentage that depends on price volatility and can be adjusted in the settings.
How it works:
First of all, you need to switch to the 1min time frame to get access to the lowest time frame data.
Look at how the blue line follows the support/resistance fib levels.
Oversold conditions are usually given by entering the lowest red band, whereas overbought conditions are given by entering the upper red band.
However, there are also extreme cases, where the blue line exceeds the set fib levels. In that case, price will reverse with very high likelihood.
Alternatively you can also ping-pong between two fib levels for frequent small trades.
Note that this indicator doesn't use any security functions to access time frame data. Instead, I found a different way to avoid repainting.
At the moment I'm just playing around with this to see how I can improve it. Feedback is very welcome!

Keep It Simple, Stupid!This is a strategy that utilizes crossovers as entries and exits. You have quite a bit of freedom to choose the type of MA used, along with the source and length. You are also able adjust the backtest range. I will update with changes if any are needed, as well as a description of the update.

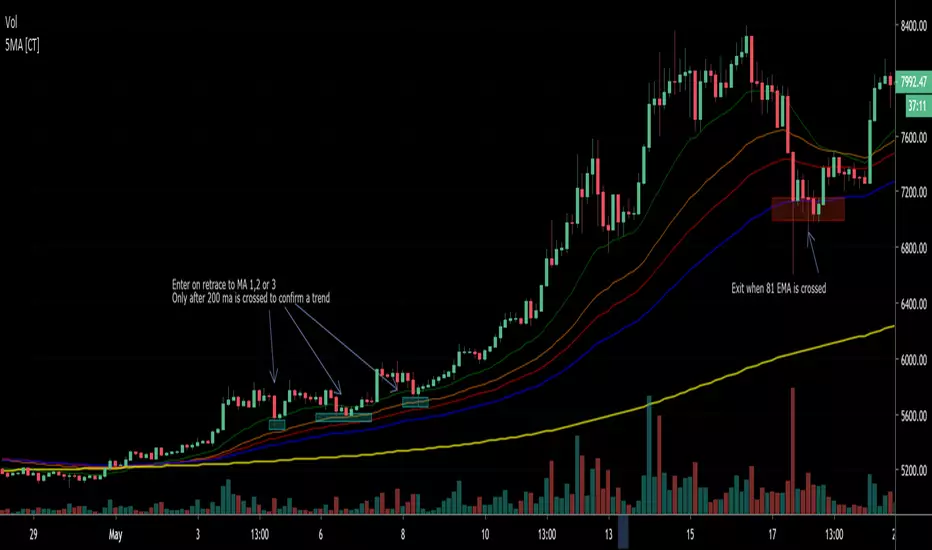
5 Moving Average (Simple / Exponential)Defaults to 1 SMA with 4 EMA bands. 200 SMA is intended to show the trend; 20,40 and 55 EMA show entries; 81 EMA is used as stop/take profit. Defaults are inspired by 'Eric Choe' but you can switch between EMA and SMA as per your own preference. Philakone uses all 5 as EMA 8, 13, 21, 55, 200
15minMAThis script lets you plot a simple or exponential moving average from a specific time frame that you can select. For example, if you always want the Daily 50MA on your chart, regardless of what resolution your chart is on, this will do it. It's also color coded to show if it's rising or falling.
