SIMPLE MOVING AVG 10,20,50,100,200 with RESOLUTIONThis indicator is the best than all other sma indicators.Because in just one click you can change all the resolution /time frames for all the sma .
Multitime frame analysis can be done in just one click. just change the resolution to
15 min/30 min/1hr- if you intraday trader
1D- LONG TERM INVESTORS.
Multi-timeframe analysis (MTF) is a process in which traders can view the same ticker/indicator using a higher time frame than the chart’s, for example, displaying a daily moving average on a one-hour chart in just two clicks.
How to Use this to Buy Stocks ?
The technical indicator known as the Death cross occurs when the 50-day SMA crosses below the 200-day SMA => Bearish Signal.
An opposite indicator, known as the Golden cross, occurs when the 50-day SMA crosses above the 200-day SMA => Bullish Signal.
Crossovers are one of the main moving average strategies.
1st Strategy is the first type is a price crossover, which is when the price crosses above the sma => Buy signal
when the price crosses below the sma => Sell signal
2nd Strategy is to apply two moving averages to a chart: one longer and one shorter.
When the shorter-term MA (100) crosses above the longer-term MA (200), it's a buy signal, indicates trend is shifting up.
This is known as a "Golden cross."
Meanwhile, when the shorter-term MA (100) crosses below the longer-term MA (200), it's a sell signal, indicates trend is shifting down.
This is known as a "Dead/death cross."
The time frame or length you choose for a moving average, also called the "look back period," can play a big role in how effective it is.
An MA with a short time frame will react much quicker to price changes than an MA with a long look back period. In the figure below, the 20-day moving average more closely tracks the actual price than the 100-day moving average does.
A 20-day MA = more beneficial to a shorter-term trader, since it follows the price more closely.
A 100-day MA = more beneficial to a longer-term trader.
Moving averages work quite well in strong trending conditions but poorly in choppy or ranging conditions.
use this indicator along with Price action theory and not alone.
Moving average crossovers are a popular strategy for both entries and exits. MAs can also highlight areas of potential support or resistance
Happy Trading
Sma

Median Absolute Deviation Filtered SMA & BBMedian Absolute Deviation (MAD) is a robust measurement of variability and more resilient against outliers and small samples.
This experiment uses MAD as a means of filtering outliers from an SMA calculation. First we construct the equivalent of a Bollinger Band, but based on the median as the basis and a multiple( k ) of MAD as the outlier cutoff.
k can be set a number of ways. As a simple multiple (3 - very conservative / 2.5 - moderately conservative / 2 - poorly conservative). Alternatively MAD can be used as an estimator of standard deviation by using a multiple of 1.4826 (SD1 - 1.4826 / SD2 - 2.9652 / SD3 - 4.4478).
Once we have a cutoff range an SMA is calculated with the outliers filtered out. Additionally a Bollinger band can be output using the filtered SMA as the basis and a multiple of the MAD instead of SD for the bands.

Percentage Of Rising MA'sReturn the percentage of rising moving averages with periods in a custom range from min to max , with the possibility of using different types of moving averages.
Settings
Minimum MA Length Value : minimum period of the moving average.
Maximum MA Length Value : maximum period of the moving average.
Smooth : determine the period of an EMA using the indicator as input, 1 (no smoothing) by default.
Src : source input for the moving averages.
Type : type of the moving averages to be analyzed, available options are "SMA", "WMA" and "TMA", by default "SMA".
Usages
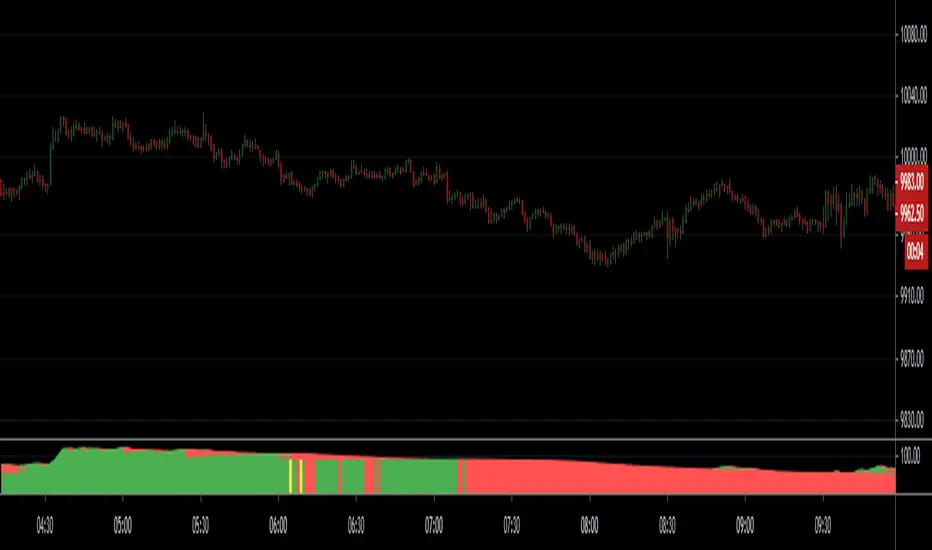
The indicator can return information about the main direction of a trend as well as its overall strength. A value of the indicator above 50 implies that more than 50% of the moving averages from period min to max are rising, this would suggest an uptrend, while a value inferior to 50 would suggest a down-trend.
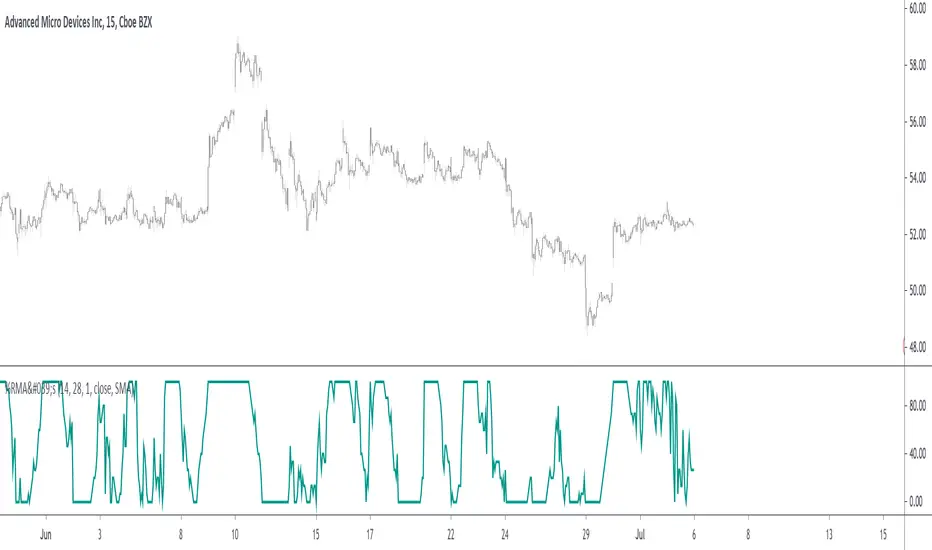
On the chart, a ribbon consisting of simple moving averages from period 14 to 19, with a color indicating their direction, below the indicator with min = 14 and max = 19
The strength of a trend can be determined by how close the indicator is to 0 or 100, a value of 100 would imply that 100% percent of the moving averages are rising, this indicates a strong up-trend, while a value of 0 would suggest a strong down-trend.
Using different types of moving averages can allow to have more reactive or on the contrary, less noisy results.
Here the type of moving average used by both the ribbon and the indicator is the WMA, the WMA is more reactive than the SMA at the cost of providing less amount of filtering. On the other hand, using a triangular moving average (TMA) provide more filtering at the cost of being less reactive.
Finally, irregularities in the indicator output can be removed by using the smooth setting.
Above smooth = 50.
Details
The indicator is based upon a for loop, this implies that both the sma, wma or change functions are not directly usable, fortunately for us, it is possible to get the first difference of both the SMA, WMA and TMA without relying on a loop by using simple calculations.
The first difference of an SMA of period p is simply a momentum oscillator of period p divided by p , there are two ways to explain why this is the case, first, simple math can prove this, the first difference of an SMA is given by:
(x + x + ... + x )/p - (x + x + ... + x )/p
The repeating terms cancel each other out, as such, we end up with
(x - x )/p
which is simply a momentum oscillator divided by p , since this division doesn't change the sign of the output we can leave it out. We can also use impulses responses to prove this, the impulse response of a simple moving average is rectangular, taking the first difference of this impulse response will give the impulse response of a momentum oscillator, with the only difference being that the non-zero values of the result will be equal to 1/p instead of 1.
The same thing applies to the WMA
above the impulse response of the first difference of a WMA, we can see it is extremely similar to the one of a high pass SMA, only 1 bar longer, as such we can have the first difference of a WMA quite easily. The TMA is simply a 2 pass SMA (the SMA of an SMA), as such the solution is also simple.

SMA's AverageReturn the average of simple moving averages with periods starting from min to max that is:
avg(sma(src,min),sma(src,min+1),...,sma(src,max))
The user can choose three types of weightings for the average, "simple", "linear", and "least squares".
Settings
Min : minimum period of the sma
Max : maximum period of the man, must be higher than "Min"
Src : input data of the indicator
Type : type of weighting, available options are "Simple", "Linear" or "Least Squares", by default "Simple"
Usage
The moving average can be used like any other classical moving average. The different types of weightings change the behavior of the moving average, the simple weighting will weight all the moving averages equally, a linear weighting will use the weighting function of a WMA, as such moving averages with lower periods will receive higher weights, this decrease the lag of the moving average. Finally, the least-squares weighting uses the weighting function of a least-squares moving average, this allows to drastically reduce the lag of the moving average.
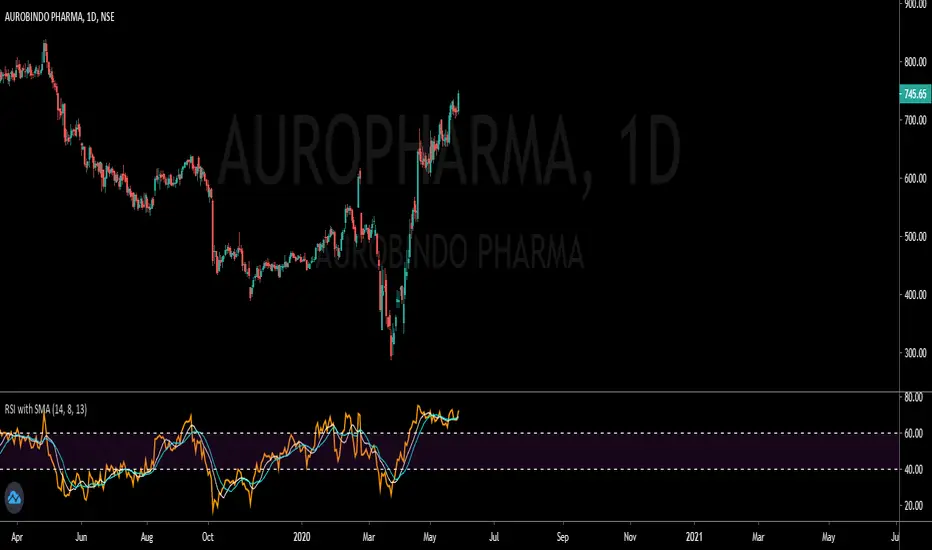
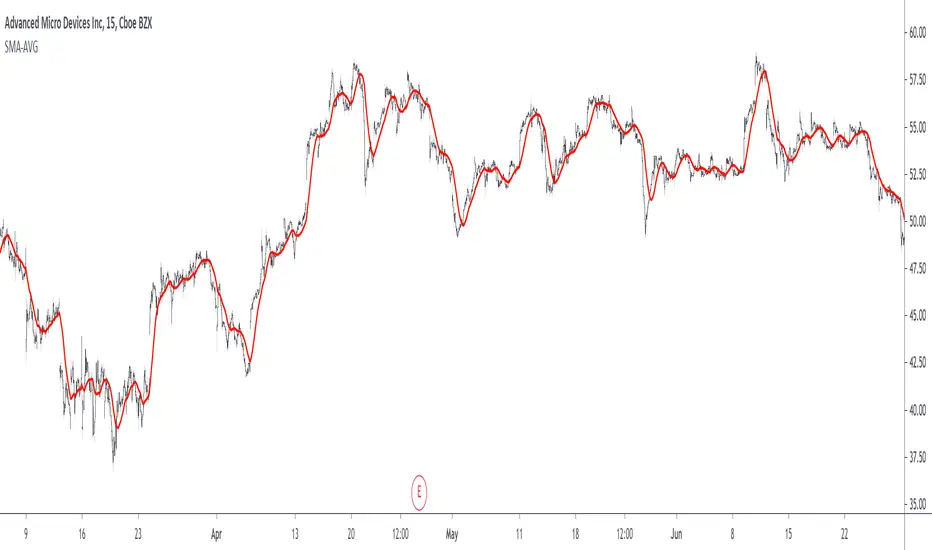
in red the moving average using simple weighting, in blue linear weighting, and in orange least squares weighting, with all using min = 14 and max = 28.
In red the moving average with min = 50 and max = 200, in blue a LSMA of period 200, notice how the moving average has less overshoots.
Details
Computing the average of various simple moving averages is simple, remember that a simple moving average can be computed using a cumulative sum:
Sma = change(cum(src),length)/length
we can't compute various "sma" functions with changing length argument within a for loop, but we can still differentiate within it, as such the cumulative sum method is super efficient and convenient.
The impulse response of this moving average is rectangular for the first "min" values, then the impulse is tailed, with the weighting method defining the shape of the tail.
in red the simple weighting method, in blue the linear method, and in orange the least-squares method.
Our moving average is an FIR moving average, as such the output lag is a linear characteristic of the moving average, which imply that:
Lag = Avg(lag(Sma(min)),lag(Sma(min+1))...,lag(max))
where lag is the lag of the moving average, in the case of a simple weighting we have:
Lag = Avg((min-1)/2,(min+1-1)/2,...,(max-1)/2) = Avg((min-1)/2,(max-1)/2)
a linear weighting gives a lag of:
Lag = Avg((min-1)/3,(min+1-1)/3,...,(max-1)/3) = Avg((min-1)/3,(max-1)/3)
Summary
A script computing the average of various moving averages has been presented, this MA might not be super useful to the everyday analyst but it stills have some great potential. Thx for reading.
This indicator is dedicated to my sister Lea, happy birthday kokoro
多重平均线(Multi Moving Average)This is a Multi Moving Average indicator which redesign and translate for Chinese.
这是一个多重平均线(Multi Moving Average)指标。
本脚本的目的在于帮助使用中文的人了解该指标,特别是其用法。同时将该指标代码添加完整的中文注释,方便使用中文的人学习Pine语言。
平均线是最常用的技术分析方法之一。
本指标的特色
相对于官方提供的平均线,本版本平均线指标有两点特色:
1 可以在图表上一次显示多条(最多6条)移动平均线;
2 支持包括SMA、EMA、WMA、HMA、VWMA、RMA等多种平均线,可以根据自己的需求选择相应的平均线。
*注释
SMA:简单移动平均线
EMA:指数加权移动平均线
WMA:加权移动平均线
HMA:船体移动平均线
VWMA:成交量加权移动平均线
RMA:RSI指标中使用的移动平均线,也叫指数加权移动平均线
指标可调节参数
该指标有六个可设置的参数
1 MA1:默认为5;
2 MA2:默认为13;
3 MA3:默认为20;
4 MA4:默认为40;
5 MA5:默认为80;
6 MA6:默认为160。
本指标还有两项可选设置项
1 价格源:价格源默认使用收盘价,但是你还可以选择使用开盘价、最高价、最低价等其他的价格计算方式;
2 选择使用的MA类型;

Ichimoku ++ public v0.9Description:
The intention of this script is to build/provide a kind of work station / work bench for analysing markets and especially Bitcoin . Another goal is to get maximum market information while maintaining a good chart overview. A chart overloaded with indicators is useless because it obscures the view of the chart as the most important indicator. The chart should be clear and market structure should be easy to see. In addition, some indicator signals can be activated to better assess the quality of signals from the past. The chart environment or the chart context is important for the quality of a signal.
The intention of this script is not to teach someone how to trade or how to use these Indicators but to provide a tool to analyse markets better and to help to draw conclusions of market behaviour in a higher quality.
A general advise:
Use the included indicators and signals in a confluent way to get stoploss, buy and sell entry points. SR clusters can be identified for use in conjunction with fractals as entry and exit pints. My other scripts can also help. Prefer 4 hours, daily and a longer time frame. There is no "Holy Grail" :).
If someone is new to trading you should learn about the indicators first. Definitely learn about Ichimoku Cloud Indicator.
Integrated indicators are:
Ichimoku Cloud and signals
Parabolic SAR and signal
ATR stop
Bollinger Bands
EMA / SMA and background color as signal
Williams Fractals and signal
Puell Multiple signal

NSDT Trend TrackerInstead of having Moving Averages on your chart, this indicator keeps them bundled at the bottom, out of the way, and displays them in an easy-to-read format that allows you to identify the trend at a glance from across the room. All components are editable.
Ultimate Moving Averages (SMA & EMA)Welcome to the Ultimate Moving Average indicator.
Never again spend time looking for EMA / SMA indicators when you can have them all in this single indicator.
Options include :
Daily Chart: Classic Golden / Death Cross - 50/D and 200/D SMA
Daily Chart: 3-day Golden / Death Cross - 150/D and 600/D SMA
Daily Chart: 140/D SMA
Daily Chart: 700/D SMA
Daily Chart: 1458/D SMA
Daily Chart: Golden Ratio Multiplier
Any Chart: Scalping
9 SMA
10 SMA
20 SMA
21 SMA
30 SMA
34 SMA
50 SMA
80 SMA
100 SMA
200 SMA
8 EMA
10 EMA
13 EMA
20 EMA
21 EMA
26 EMA
30 EMA
34 EMA
50 EMA
55 EMA
80 EMA
89 EMA
100 EMA
200 EMA

Computing The Linear Regression Using The WMA And SMAPlot a linear regression channel through the last length closing prices, with the possibility to use another source as input. The line is fit by using linear combinations between the WMA and SMA thus providing both an interesting and efficient method. The results are the same as the one provided by the built-in linear regression, only the computation differ.
Settings
length : Number of inputs to be used.
src : Source input of the indicator.
mult : Multiplication factor for the RMSE, determine the distance between the upper and lower level.
Usage
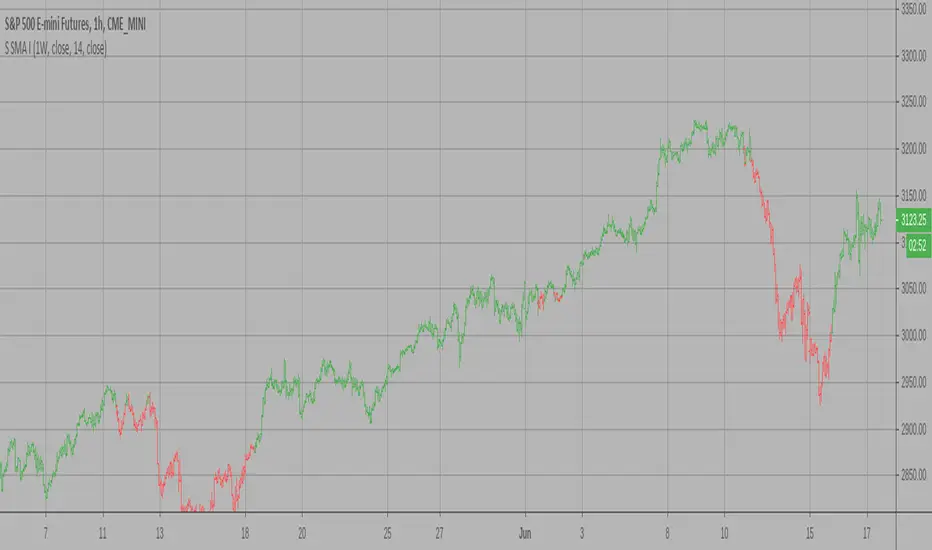
In technical analysis a linear regression can provide an estimate of the underlying trend in the price, this result can be extrapolated to have an estimate of the future evolution of the trend, while the upper and lower level can be used as support and resistance levels.
The slope of the fitted line indicates both the direction and strength of the trend, with a positive slope indicating an up-trending market while a negative slope indicates a down-trending market, a steeper line indicates a stronger trend.
We can see that the trend of the S&P500 in this chart is approximately linear, the upper and lower levels were previously tested and might return accurate support and resistance points in the future.
By using a linear regression we are making the following assumptions:
The trend is linear or approximately linear.
The cycle component has an approximately constant amplitude (this allows the upper and lower level to be more effective)
The underlying trend will have the same evolution in the future
In the case where the growth of a trend is non-linear, we can use a logarithmic scale to have a linear representation of the trend.
Details
In a simple linear regression, we want to the slope and intercept parameters that minimize the sum of squared residuals between the data points and the fitted line
intercept + x*slope
Both the intercept and slope have a simple solution, you can find both in the calculations of the lsma, in fact, the last point of the lsma with period length is equal to the last point of a linear regression fitted through the same length data points. We have seen many times that the lsma is an FIR filter with a series of coefficients representing a linearly decaying function with the last coefficients having a negative value, as such we can calculate the lsma more easily by using a linear combination between a WMA and SMA: 3WMA - 2SMA , this linear combination gives us the last point of our linear regression, denoted point B .
Now we need the first point of our linear regression, by using the calculations of the lsma we get this point by using:
intercept + (x-length+1)*slope
If we get the impulse response of such lsma we get
In blue the impulse response of a standard lsma, in red the impulse response of the lsma using the previous calculation, we can see that both are the same with the exception that the red one appears as being time inverted, the first coefficients are negative values and as such we also have a linear operation involving the WMA and SMA but with inverted terms and different coefficients, therefore the first point of our linear regression, denoted point A , is given by 4SMA - 3WMA , we then only need to join these two points thanks to "line.new".
The levels are simply equal to the fitted line plus/minus the root mean squared error between the fitted line and the data points, right now we only have two points, we need to find all the points of the fitted line, as such we first need to find the slope, which can be calculated by diving the vertical distance between B and A (the rise) with the horizontal distance between B and A (the run), that is
(A - B)/(length-1)
Once done we can find each point of our line by using
B + slope*i
where i is the position of the point starting from B, i=0 give B since B + slope*0 = B , then we continue for every i , we then only need to sum the squared distance between each closing prices at position i and the point found at that same position, we divide by length-1 and take the square root of the result in order to have the RMSE.
In Summary
The following post as shown that it was possible to compute a linear regression by using a linear combination between the WMA and SMA, since both had extremely efficient computations (see link at the end of the post) we could have a calculation for the linear regression where the number of operations is independent of length .
This post took me eons to make because it's related to the lsma, and I am rarely short on words when it comes to anything related to the lsma. Thx to LucF for the feedback and everything.

Simple SMA Indicator from StreamAdded strategy logic.
Part 2:
www.tradingview.com
Part 1:
www.tradingview.com
WARNING:
- For purpose educate only
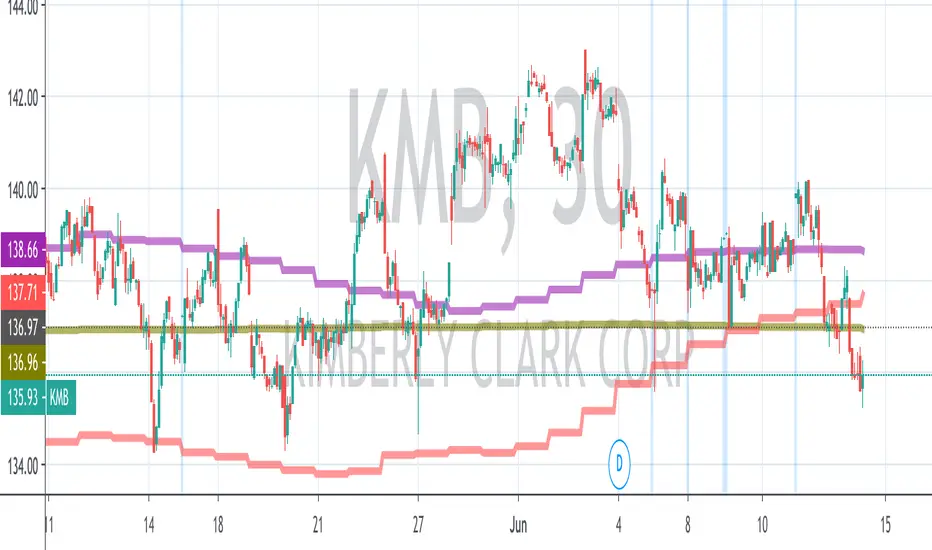
万有引力(均线支撑阻挡Moving Average Support and Resisitance)系统This is a Moving Average indicator base on R/S which design for Chinese.
这是一个基于均线作为移动支撑阻挡的用法而设计的指标。
本脚本的目的在于帮助使用中文的人了解该指标,特别是其用法。同时将该指标代码添加完整的中文注释,方便使用中文的人学习Pine语言。
均线移动支撑阻挡的用法是葛南维八大买卖法则的基础。
本指标的特色
本指标利用均线的支撑阻挡效应来捕捉一段长期趋势的第二段行情。
*万有引力:即均值回归理论。认为价格始终在重复着远离其均值,再回到其均值;
*洛希极限:以均线为中心,以其0.2标准差构建其上下轨道,形成一个容错通道;
指标可调节参数
该指标有三个可设置的参数
1 短周期均线参数:默认为20;
2 长周期均线乘数:默认为80;
3 标准差参数:0.2
本指标还有两项可选设置项
1 价格源:价格源默认使用收盘价,但是你还可以选择使用开盘价、最高价、最低价等其他的价格计算方式;
2 是否显示强趋势的开关;
3 是否显示中趋势的开关;
指标用法
买入信号: 当指标出现上涨A或上涨B时,即为买入信号。其中上涨A为强趋势信号,上涨B为中趋势信号。
卖出信号: 当指标出现下跌A或下跌B时,即为卖出信号。其中下跌A为强趋势信号,下跌B为中趋势信号。
本指标支持配置买卖点的预警。
指标优势
1 适用于不同的时间周期和不同的交易品种;
2 对趋势有很好的识别效应。
指标局限性
本指标主要在于捕捉趋势的第二段,若当前趋势较弱时,第二段极有可能不成立。

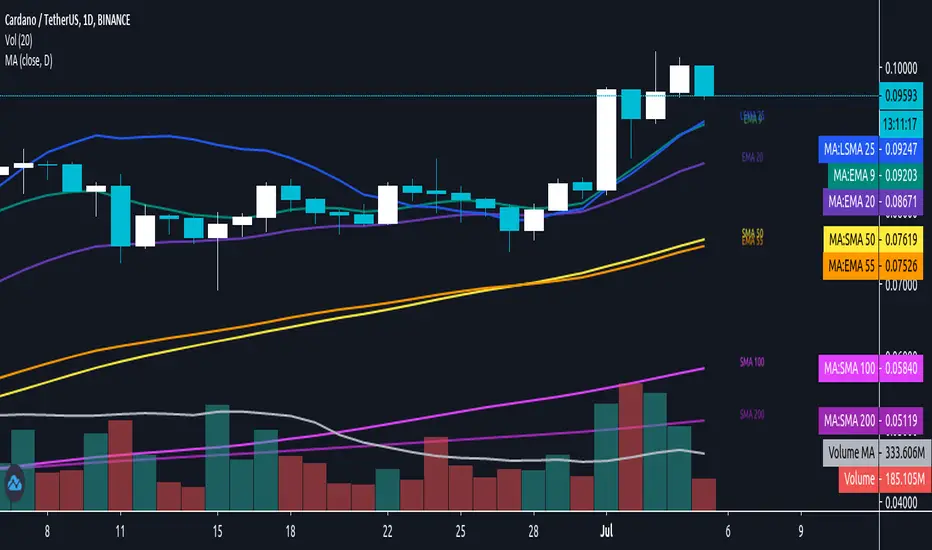
Daily/MTF Moving Averages (EMA20, EMA55, SMA50, SMA100, SMA200)Script to plot common daily/alternative timeframe moving averages on when viewing securities at other resolutions.
There's lots of different MA scripts out there, but I couldn't find one that just represented the standard support/resistance indicators that were typical for my markets. So, this is the DIY. :)
Combo Strategy 123 Reversal & EMA & MA Crossover This is combo strategies for get a cumulative signal.
First strategy
This System was created from the Book "How I Tripled My Money In The
Futures Market" by Ulf Jensen, Page 183. This is reverse type of strategies.
The strategy buys at market, if close price is higher than the previous close
during 2 days and the meaning of 9-days Stochastic Slow Oscillator is lower than 50.
The strategy sells at market, if close price is lower than the previous close price
during 2 days and the meaning of 9-days Stochastic Fast Oscillator is higher than 50.
Second strategy
The Moving Average Crossover trading strategy is possibly the most popular
trading strategy in the world of trading. First of them were written in the
middle of XX century, when commodities trading strategies became popular.
This strategy is a good example of so-called traditional strategies.
Traditional strategies are always long or short. That means they are never
out of the market. The concept of having a strategy that is always long or
short may be scary, particularly in today’s market where you don’t know what
is going to happen as far as risk on any one market. But a lot of traders
believe that the concept is still valid, especially for those of traders who
do their own research or their own discretionary trading.
This version uses crossover of moving average and its exponential moving average.
WARNING:
- For purpose educate only
- This script to change bars colors.

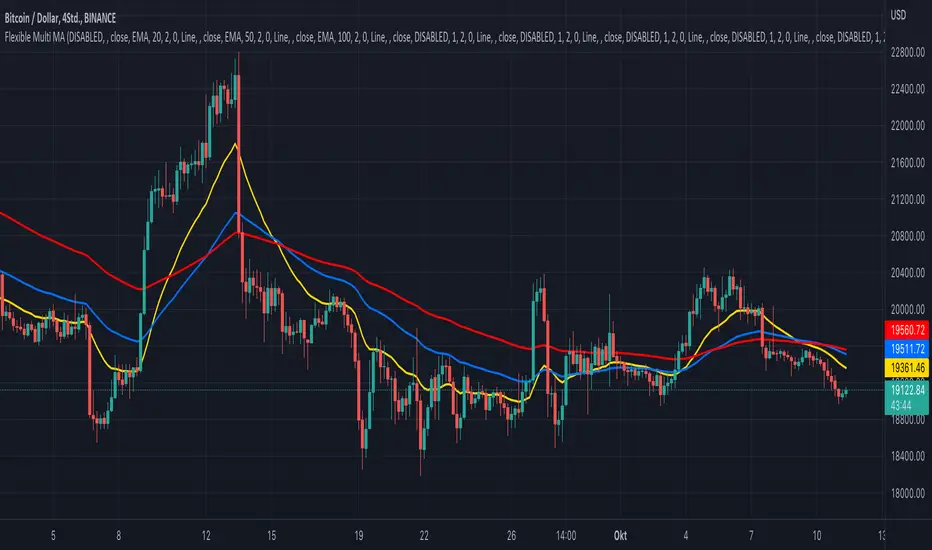
KINSKI Flexible Multi MA (EMA, SMA, RMA, WMA, VWMA, KAMA, HMA)This Multi Moving Average (MA) indicator is more flexible than any other indicator of this type offered so far. You can define up to 10 different Moving Average (MA) lines based on different calculation variants.
The following MA types can be configured.
- EMA: Exponentially Moving Average
- SMA: Small Moving Average
- RMA: Rolling Moving Average
- WMA: Weighted Moving Average
- VWMA: Volume Weighted Moving Average
- KAMA: Kaufman's Adaptive Moving Average
- HMA: Hull Moving Average
Which settings can be made?
- Selection for calculation formula ("Calculation Source"). The default value is "close".
- for each MA line the "Length" and the "Type" can be defined
- furthermore you can make layout adjustments via the "Style" menu
Daily Moving Averages on Intraday ChartShows the Daily Simple Moving Averages on the Intraday Chart
This will include the 200 day SMA, 50 day SMA and 20 day SMA automatically on the intraday chart.
Daily SMA time periods can be adjusted in the settings.
Based on the following script:
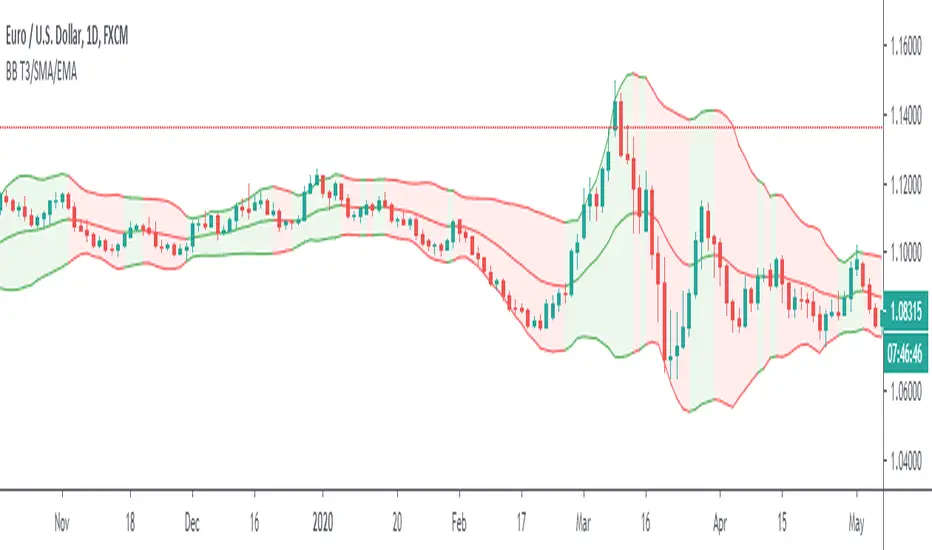
Bollinger Bands T3/SMA/EMAThis is Bollinger Bands script with an option to choose three different moving averages. The simple moving average is the original settings used by Mr Bollinger. Exponential is a popular choice as it adds more value to the recent price movements. T3 is a lot faster at adapting to the recent price. Compared to exponential, it gives even more value to the recent prices and furthermore, it is smoother. I use it to polish my True Range scripts.
Another upgrade is the ability to have a different colour of the channel when the baseline moves up or down.
Back to calculation? Is it better to use T3 with Bollinger? My opinion is that it depends on the trader. Both of them give you slightly different information and it is essential to look at the historical behaviour and answer for yourself. Will I use T3 calculation? Well, I built this script to find out if I want to.
Have a great trade!
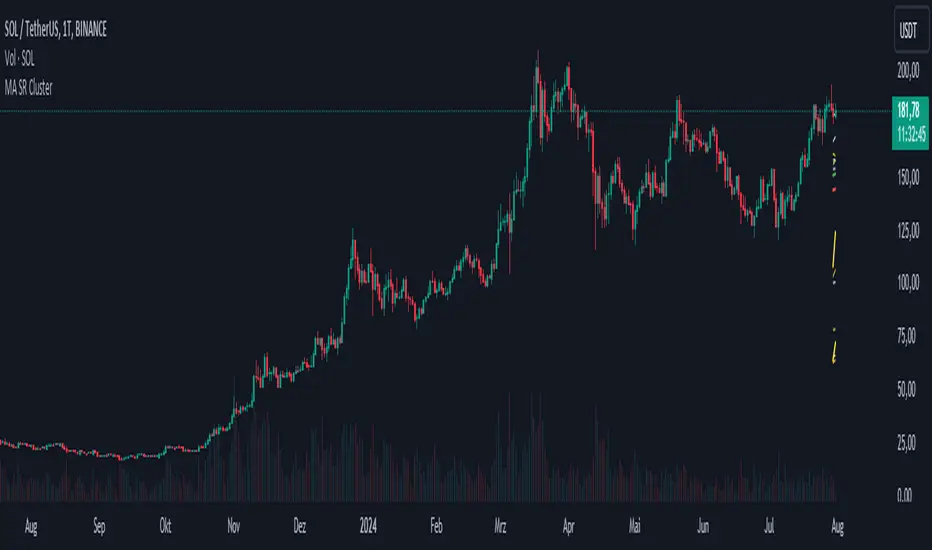
SMA/EMA SR mtf Clusters v0.9SMA and EMA endings to identify support and resistance with a good chart overview.
Unfortunately the scaling of TradingView in intraday charts is not good.

MA * Fibo levels (canal)Some updates to the scrypt "MA * Fibo levels (auto)"
In the previous scrypt we drew lines using either highs or lows of the candles due to the positiveness or negativeness of given percentages.
But, after some research it seems easier to use CANALS to buy or sell rather than LINES. So these canals are the intervals between SMA(highs) and SMA(lows) multiplied by FIBO coefficients. However, lines can be also used as stop-losses if the price goes out of the canal, and wait until the price reaches the other canal.
Good luck in trading!
If the scrypt was useful let me know!
Any feedbacks and ideas are welcomed!

Hello VWAP "Beta"This is my 1st indicator, and my attention is to plot the VWAP "Volume-weighted average price" using the SMA "Simple Moving Average" over time... IE over the last 50,100,200 bars and just the VWAP... All of them in just one line... I have made it when I have been using the BTC/US chart, but it should work for stocks/forex or any other chart that you want to use...
I am not completely sure about this indicator and I do want to add more to this, that is how come I am posting to the community to show what I have done and people can use it and if they are open to it give me feedback or tips to make it better...
Happy trading...

MA-KIRILDIM-SANAThis is a lower block indicator. It helps us to follow the moving average crosses in the lower section in a single indicator without adding any moving averages in the main window.
When MA1 breaks MA2 up, the background color turns green or otherwise, the background becomes red. If you want, you can follow the lines of moving averages in here.
Three averages can be used in the system.
- SMA(Simple Moving Average)
- EMA(Exponential Moving Average)
- WMA(Weighted Moving Average)
Thanks