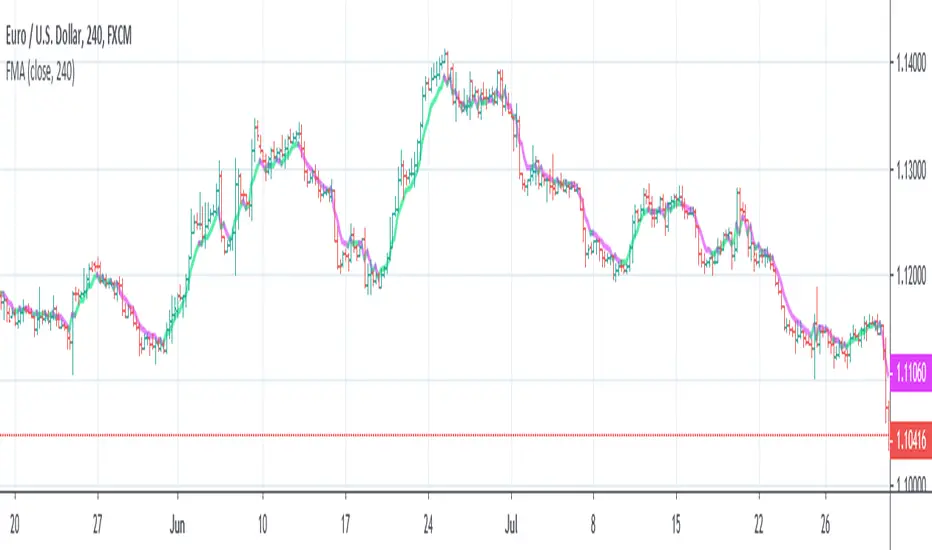
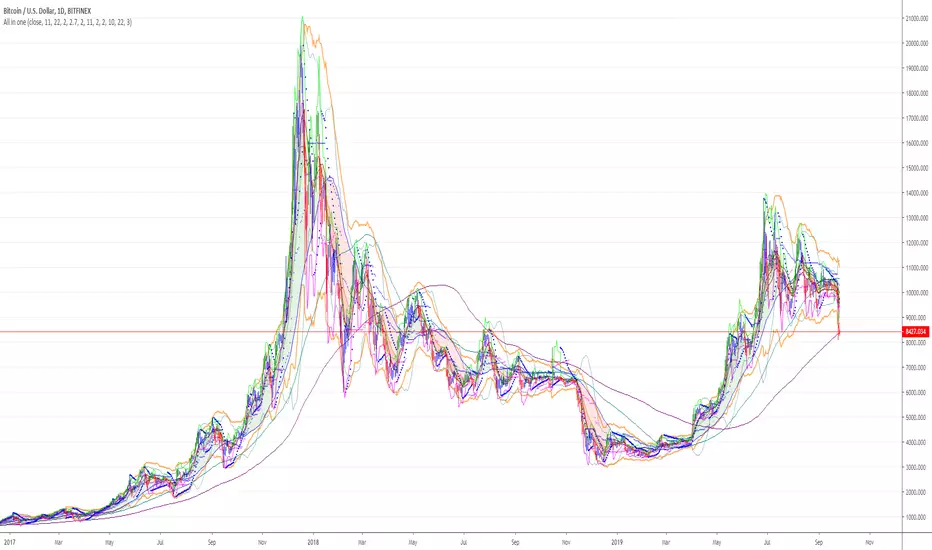
FibMAThis study visually demonstrates Fibonacci moving averages.
The darker the color, the stronger the signal is for either buying or selling.
Buys/Sells only take place when each moving average is above/below the its adjactent fibonacci sequence, i.e 5<8<13<21<34<55<89<144 for buying..
Alerts are provided as BUY ASSET and SELL ASSET.
Multiple moving averages are also provided.
Sma

FMA - Fibonacci Moving Average [NXT2017]HI BIG PLAYERS,
I present you a new moving average indicator that relates the values to the lenght of Fibonacci sequence.
Kind regards
NXT2017
MasterMAThis study demonstrates 15 different common moving averages.
SMA, Double SMA, Triple SMA
EMA, Double EMA, Triple EMA
WMA, Double WMA, Triple WMA
VWMA, Double VWMA, Triple VWMA
Hull, Double Hull, Triple Hull
Buy/Sell alerts are given for crossover/under conditions.
Triangles at the bottom, pointing up are buy signals. Triangles at the top, pointing down, are sell signals

Reliability[UO]This is an SMA based indicator. It gives a sense of long term behavior of the asset to make a reliable trade setup
How reliable is your asset to trade without gambling? Is there a reliable trend?
Is this price dip an opportunity to buy?
Is this price spike an opportunity to sell? Or would you avoid buying now and rather wait a bit for prices to fall down to a more reasonable level?
You can recognize all of those points on this indicator. The best to do is to look at the prices and patterns on the indicator to learn about those points.

RSI with Moving Averages[UO]This RSI indicator is one of my favorite indicators. This powerful indicator is implemented by Phi-Deltalytics. I modified the drawing so that it is easier (at least for me) to see the signals and trends (it would not matter if you're doing algorithmic trading).
Trends and signals. For detailed instructions and tutorial see Phi-Deltalytics page

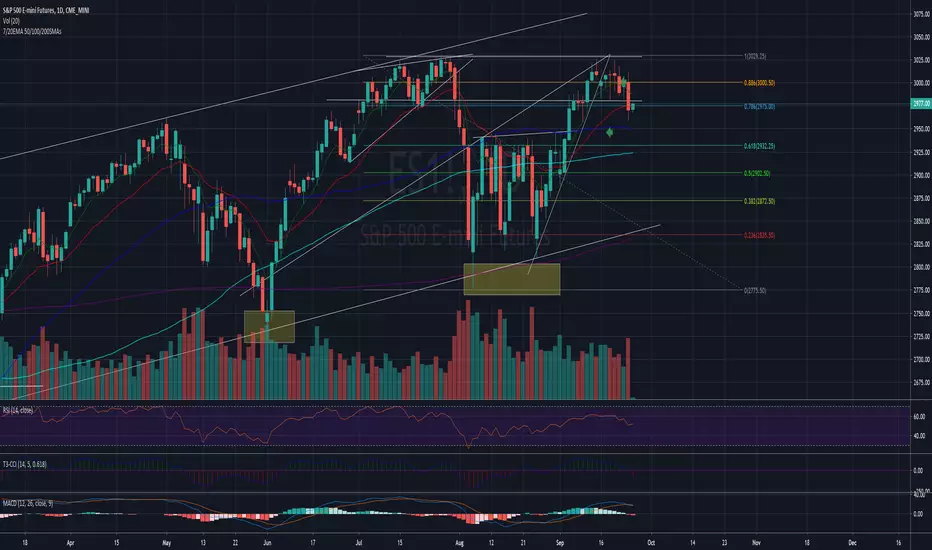
Golden Ratio Fibonacci Multipliers Top Detector [UO]Fibonacci levels that show the critical top and bottom levels. There is no way to miss the top and bottom. And a top detector.
Also the most important SMA lines (SMA 50, 200), EMA21. Those are the most frequently used lines by traders.
This indicator is based on the work of www.tradingview.com
His work set me thinking. Could I also see the bottom using Fibonacci numbers? Yes, of course.
My favorite timeframes with this indicator are 6H, 1D, 3D.
Intensively used for BTC and BNB. And useful for any other coin.

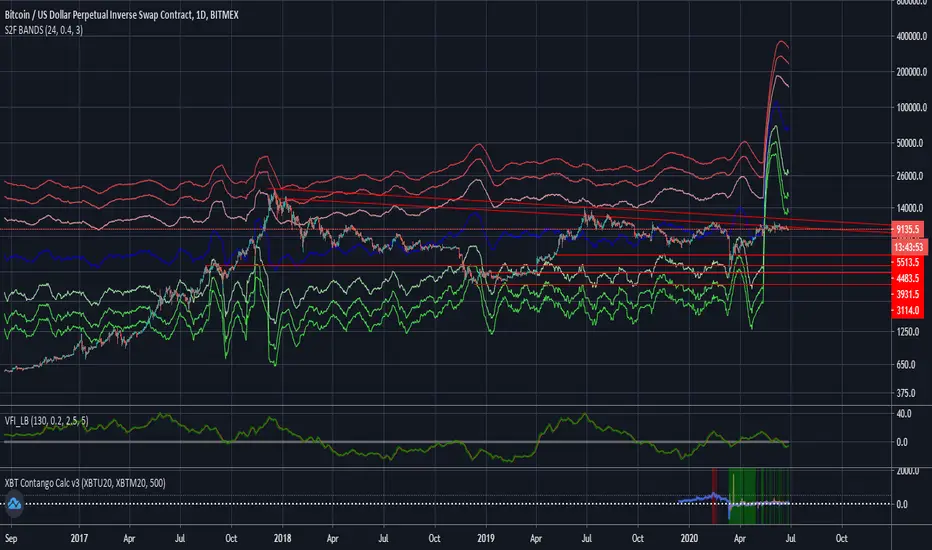
Stock to Flow Model with Standard Deviation BandsThis Study takes the Stock to Flow Model for Bitcoin as presented by 100trillionUSD and smoothes it using an SMA. Then it calculates the close's standard deviation from it and displays the 2-Sigma Bands.
The stock to flow model seems to be one of the best predictions of Bitcoins price.
The standard deviation bands are supposed to show situations in which Bitcoin is significantly over- or under-bought.
Rolling Moving Average, SMA/EMA, for IPO stocksThe script replicates the standard EMA/SMA used by tradingview, but also adds an estimate for the first X periods, where X is the length of the moving average. This allows for an estimate of support resistance in IPO stocks, when fewer date is available

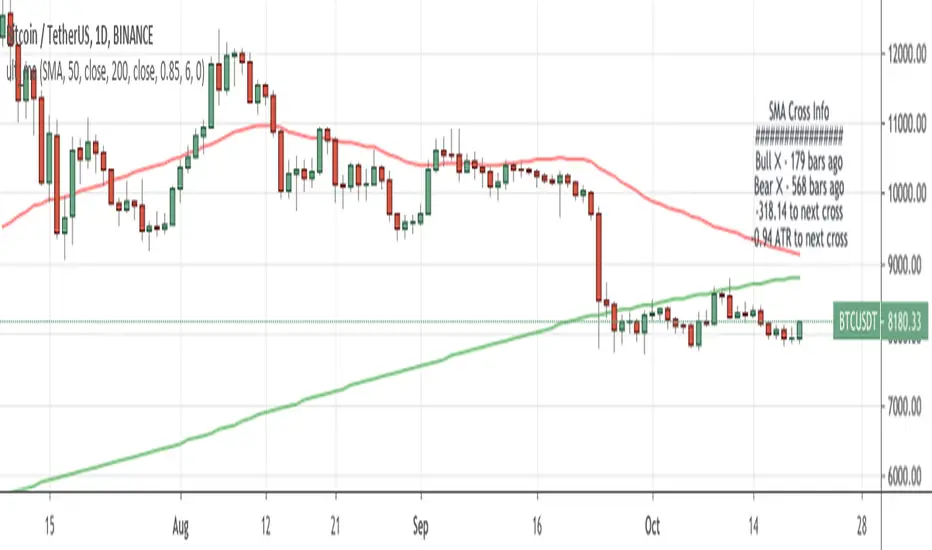
Ultimate MA Cross IndicatorContinue to experiment with new labels functionality in TradingView. Created ma cross script with 9 different types of MA wit additional information box. In that box, I included the bars passed from the previous bull/bear cross.
Also you cand find there live distance between moving averages in price and ATRs , so you track how close are you from the next close.
Do you think this concept is useful? What information do you want to see in this kind of boxes?
These ma types are included in this indicator:
Simple Moving Average ( SMA )
Exponential Moving Average ( EMA )
Weighted Moving Average ( WMA )
Arnaud Legoux Moving Average ( ALMA )
Hull Moving Average ( HMA )
Volume-weighted Moving Average ( VWMA )
Least Square Moving Average ( LSMA )
Smoothed Moving Average ( SMMA )
Double Exponential Moving Average ( DEMA )
8 EMA & 5 SMA ComboA combination of 8 EMA & 5 SMA to use with more advanced MA strategies and de-cluttering of indicator list.
To identify lines, Color combination should be somewhat warmer/lighter to cooler/darker colors.
EMA have a thicker line than the SMA. Color pairs have lighter/darker in cases where there are slight variations (when using one over another).

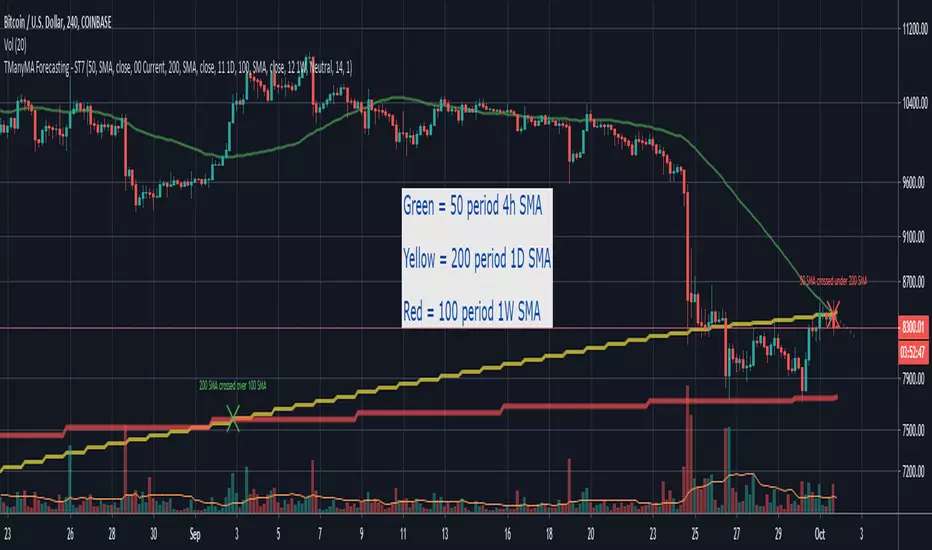
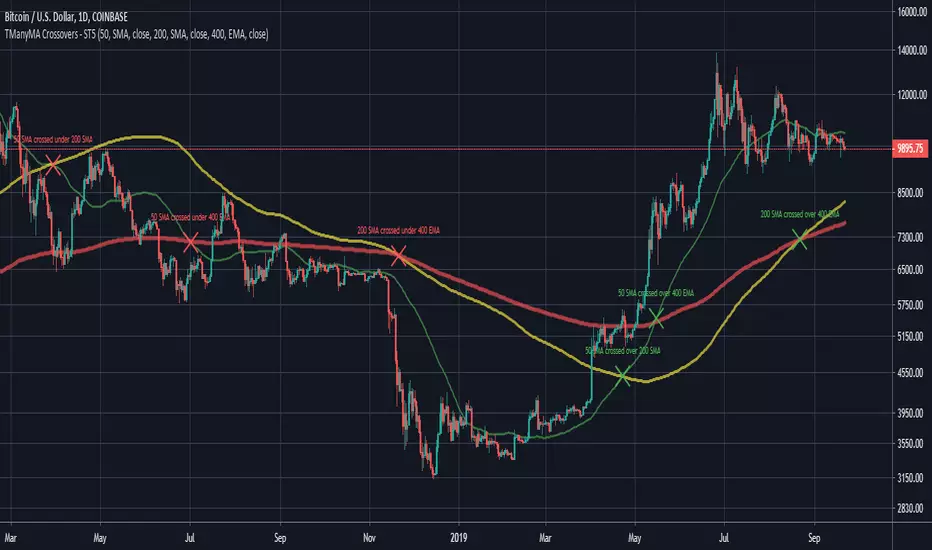
Scripting Tutorial 7 - Triple Many Moving Averages ResolutionsThis script is for a triple moving average indicator where the user can select from different types of moving averages, price sources, lookback periods and resolutions.
Features:
- 3 Moving Averages with variable MA types, periods, price sources, resolutions and the ability to disable each individually
- Crossovers are plotted on the chart with detailed information regarding the crossover (Ex: 50 SMA crossed over 200 SMA )
- Forecasting available for all three MAs. MA values are forecasted 5 values out and plotted as if a continuation to the MA.
- Forecast bias also applies to all forecasting. Bias means we can forecast based on an anticipated bullish, bearish or neutral direction in the market.
- To understand bias, please read the source code, or if you can't read the code just send me a message on here or Twitter. Twitter should be linked to my profile.
This script is meant as an educational script with well-formatted styling, and references for specific functions.
Multiple SMAs + X-Bar High/LowWhen starting my daily analysis, I typically open a daily chart and check where the price is compared to several SMAs, as well as check the high/low of today and the 10-day high/low. This indicator was designed to save chart space as well as make finding the highs and lows more efficient. Everything is adjustable, so you don't have to stick with my 10-bar rule.

別府 Multiple Moving AveragesThis is yet another script that implements multiple moving averages into one indicator. It also identifies SMA golden crosses and candles where price goes above or below the 200 SMA. It also has a few EMAs and SMAs with configurable periods in case you want to try something out and need a weird EMA or SMA. The default EMAs and SMAs use 50, 100, and 200 periods.


ENVELOPE BOLLINGER KELTN IMPULSE EMA SMA SAFEZONE SAR CHANDELIERALL THIS ALL IN ONE!
there are many options to check or uncheck to show only the tool that you need at that particular moment.
ENJOY!
ENVELOPE BOLLINGER KELTNER IMPULSE EMA SMA SAFEZONE SAR CHANDELIER
DT21 Moving Averages
I know a lot of people use the free version of TradingView, So I made a script to combine 5 Moving averages as 1 indicator for my followers
Scripting Tutorial 6 - Triple Many Moving Averages ForecastingThis script is for a triple moving average indicator where the user can select from different types of moving averages, price sources and lookback periods.
Features:
- 3 Moving Averages with variable MA types, periods, price sources and ability to disable each individually
- Crossovers are plotted on the chart with detailed information regarding the crossover (Ex: 50 SMA crossed over 200 SMA )
- Forecasting available for all three MAs. MA values are forecasted 5 values out and plotted as if a continuation to the MA.
- Forecast bias also applies to all forecasting. Bias means we can forecast based on an anticipated bullish, bearish or neutral direction in the market.
- To understand bias, please read the source code, or if you can't read the code just send me a message on here or Twitter. Twitter should be linked on my profile.
This script is meant as an educational script with well-formatted styling, and references for specific functions.

Volume-supported Fractal SRModified version of SynapticEX's Volume-supported Fractal S/R with EMA instead of SMA, pinescript 4 port, and EMA20/EMA50 defaults for support and resistance.
EMA20 = red/green
EMA50 = orange/yellow

MTF Bollinger Bands - ModifiedModified version of tansancrypto's MTF Bollinger to Pinescript 4 and removed limiters on BB1/BB2 max Sigma values.
Original Script:

Scripting Tutorial 5 - Triple Many Moving Averages CrossoversThis script is for a triple moving average indicator where the user can select from different types of moving averages and periods. This script improves upon tutorial 3 by adding source selection for MAs and another option for an MA that is not built-in, the HMA . It is meant as an educational script with well formatted styling, and references for specific functions.
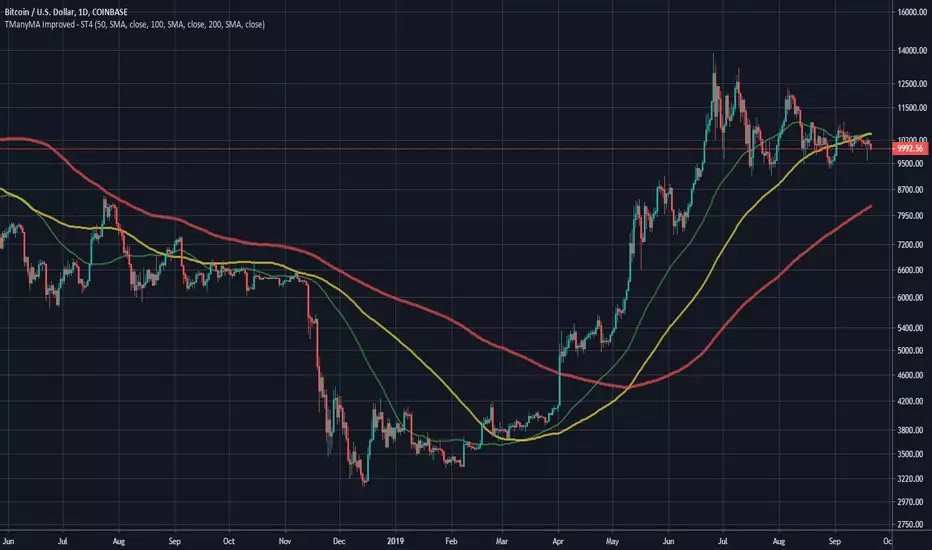
Scripting Tutorial 4 - Triple Many Moving Averages ImprovedThis script is for a triple moving average indicator where the user can select from different types of moving averages and periods. This script improves upon tutorial 3 by adding source selection for MAs and another option for an MA that is not built-in, the HMA. It is meant as an educational script with well formatted styling, and references for specific functions.
Scripting Tutorial 3 - Triple Many Moving AveragesThis script is for a triple moving average indicator where the user can select from different types of moving averages. It is meant as an educational script with well formatted styling, and references for specific functions.

Scripting Tutorial 1 - Simple Moving AverageThis script is for a simple moving average indicator. It is meant as an educational script with well formatted styling, and references for specific functions.
