Live Mini Terminal 6 : Major U.S Indices Change DataThis script displays relative data changes occurring in the adjustable period and/or adaptive automatic period in US Major Indices.
It was inspired by the data terminals used by commercial traders.
Period selection can be adjusted in the menu.
This script uses the adaptive period algorithm used by Autonomous LSTM and Relativity scripts.
Or you can set the period manually from the menu.
For more information about adaptive period this script uses:
This script works only for 1 day (1D) and 1 week (1W) time frames.
The most efficient time frame is 1 week (1W) because of different time-zones .
Features
Value changes on a percentage basis (%)
Recently, due to increasing interest, the NQNACE index has been added.
Index descriptions are printed on the information panel.
Sentiment NYSE ARCA and AMEX indices added.
INSTRUMENTS
SP1! : S&P 500 Futures Index
DJI : Dow Jones Industrial Average Index
NDX : Nasdaq 100 Index
RUT : Russell 2000 Index
NYA : NYSE Composite Index
OSX : PHLX Oil Service Sector Index
HGX : PHLX Housing Sector Index
UTY : PHLX Utility Sector Index
SOX : PHLX Semiconductor Sector Index
SPSIBI : S&P Biotechnology Select Industry Index
XNG : NYSE ARCA Natural Gas Index
SPGSCI : S&P Goldman Sachs Commodity Index
XAU : PHLX Gold and Silver Sector Index
SPSIOP : S&P Oil and Gas Exploration and Production Select Industry Index
GDM : NYSE ARCA Gold Miners Index
DRG : NYSE ARCA Pharmaceutical Index
TOB : NYSE ARCA Tobacco Index
DFI : NYSE ARCA Defense Index
NWX : NYSE ARCA Networking Index
XCI : NYSE ARCA Computer Technology
XOI : AMEX Oil Index
XAL : AMEX Airline Index
NQNACE : Nasdaq Yewno North America Cannabis Economy Index
USAGE
The script can be used as an indicator by putting it under the chart as shown above.
It is necessary to enlarge to see clearly.
Since it is not often looked at,such use is the best method for healthy interpretation.
Regards.
Sp500index

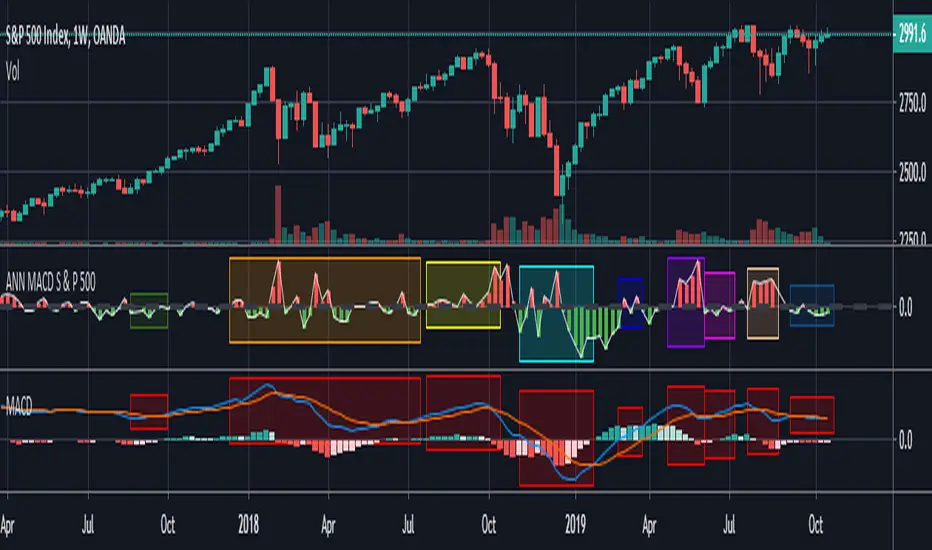
ANN MACD S&P 500 This script is formed by training the S & P 500 Index with various indicators. Details :
Learning cycles: 78089
AutoSave cycles: 100
Training error: 0.011650 (Far less than the target, but acceptable.)
Input columns: 19
Output columns: 1
Excluded columns: 0
Training example rows: 300
Validating example rows: 0
Querying example rows: 0
Excluded example rows: 0
Duplicated example rows: 0
Input nodes connected: 19
Hidden layer 1 nodes: 2
Hidden layer 2 nodes: 1
Hidden layer 3 nodes: 0
Output nodes: 1
Learning rate: 0.7000
Momentum: 0.8000
Target error: 0.0100
Note : Thanks for dear wroclai for his great effort .
Deep learning series will continue . Stay tuned! Regards.
Yaonology SPY StrategyOnly use this strategy in the US stock market. Especially use in SPY.
www.yaonology.com

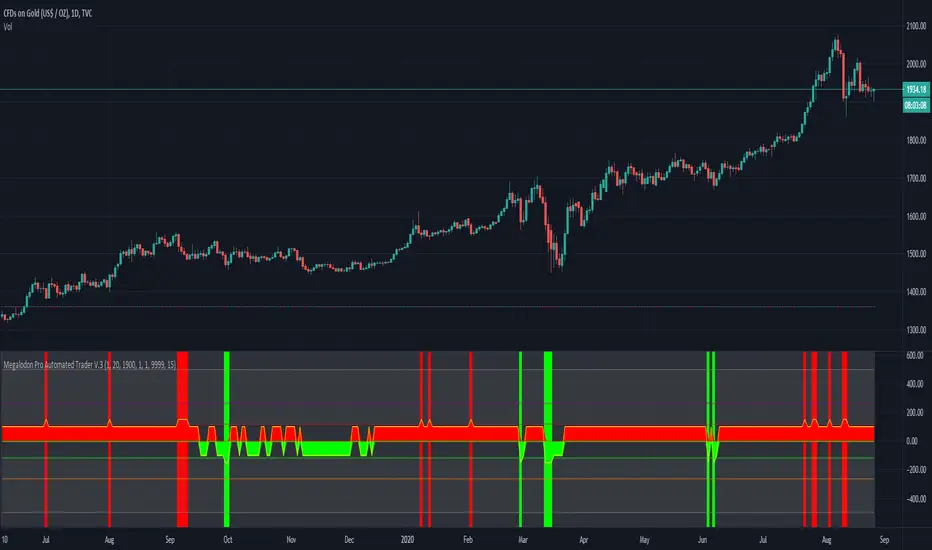
Megalodon Pro Automated Trader
Why Megalodon?
We believe that enlightening others is an incredible way to make this world a better place. That's why we created the tools you need to stop worrying about your investments and focus on what really matters in your life.
What is Megalodon?
Megalodon uses Artificial Intelligence that combines 574 back-tested indicators and 2674 back-tested setups, simultaneously.
Megalodon works with any kind of asset , market state and time frame .
What is the win rate?
Megalodon is extremely accurate and offers insane profits as long as the fundamental analysis is done right .
Backtesting results can be found on our social media or down below .
How to use Megalodon Pro Automated Trader?
Simply, orange rectangles are buy signals and purple rectangles are sell signals .
Green clouds show buy signals and red clouds show sell signals.
Yellow line shows the difference between buy and sell counts.
How to set alarms on Megalodon Pro Automated Trader?
Click on Alert, select Megalodon Pro Automated Trader and click on Buy-Signal or Sell-Signal. More details can be found on our social media.
You may also watch our Megalodon Investing Tutorials on Youtube for more information.
How to purchase?
Megalodon is totally FREE .
You may upgrade to Megalodon Pro for the most important features , including automizing your trading on any asset profitably, setting up alarms to get notified , joining to our VIP telegram channel to get daily updates and our VIP telegram group to interact with the community. Simply go to our website on our TradingView page for learning more and joining us for free.
Some of the backtesting results are:
BTC/USD for longer time frame trading in the bear market for the last year.
APPLE for longer time frame trading in the bull market for the last 10 years.
EURO/USD for day trading in the neutral market for the last month.
BTC/USD for day trading in the bull market for the last 15 days.
APPLE for day trading in the neutral market for the last 2 days and 6 hours.
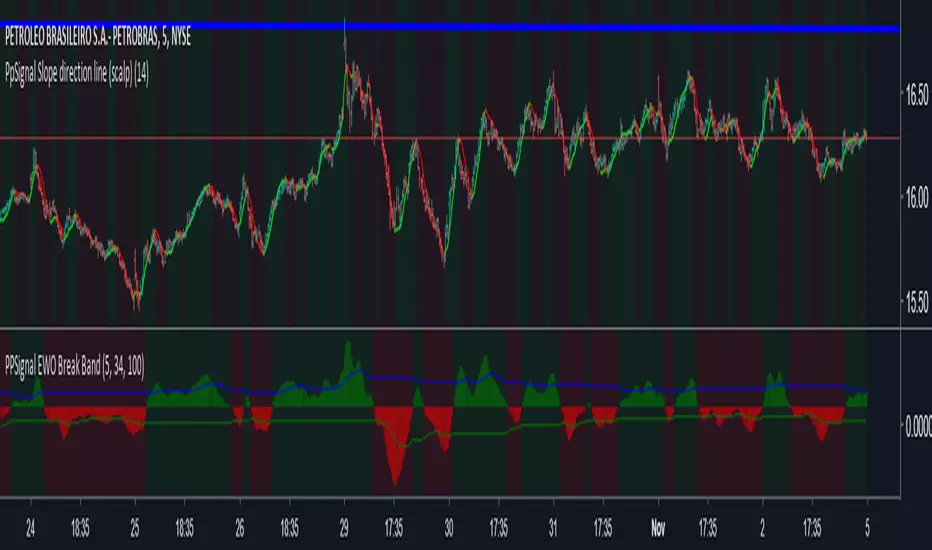
PpSignal Slope direction line (scalp)Slope direction line provides an opportunity to detect various peculiarities and patterns in price dynamics that are invisible to the naked eye.
Based on this information, traders can take the price movement further and adjust their strategy accordingly.
@WACC Volatility Weighted PUT/CALL Positions [SPX]This indicator is based on Volatility and Market Sentiment. When volatility is high, and market sentiment is positive, the indicator is in a low or 'buy state'. When volatility is low and market sentiment is poor, the indicator is high.
The indicator uses the VIX as it's volatility input.
The indicator uses the spread between the Call Volume on SPX/SPY and the Put Volume.
This is pulled from CVSPX and PVSPX.
When volatility and put/call reaches a critical level, such as the levels present in a crisis or a sell off, the line will be green. See Sept 2015, 2008, and Feb 2018.
This level can be edited in the source code.
As the indicator is based on Put/Call, the indicator works best on larger time frames as the put/call ratio becomes a more discernible measure of sentiment over time.

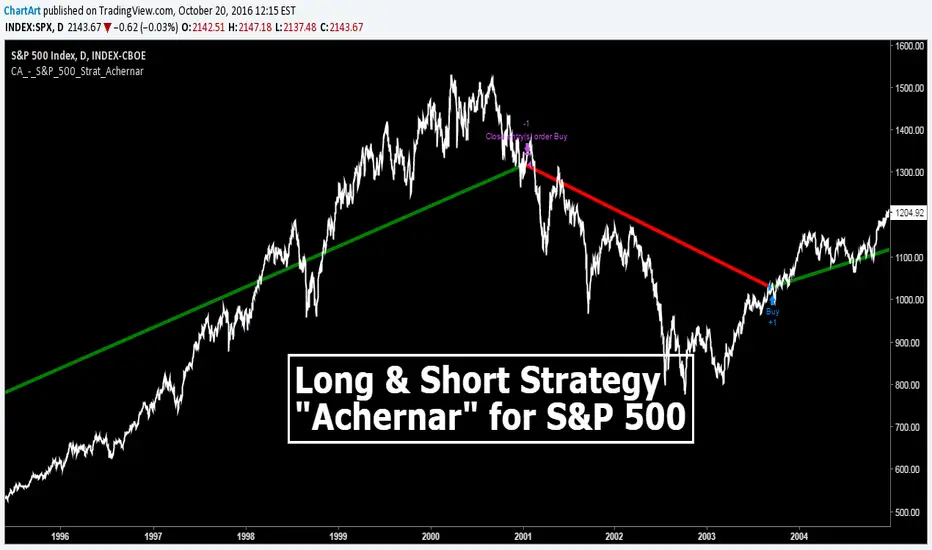
S&P 500 Long Only Investment Strategy, Achernar (by ChartArt)Here is my strategy with the working title "Achernar", which works best with the published default setting on the 'CBOE' 'S&P 500' daily chart. The strategy is intended for investments in long-term time-frames (the current average of the trades is a holding period of over 1000 days). The setting allows to use the 'CBOE' as price source (default) or the Tradingview TVC index, which uses a 'CFD' of the 'S&P 500' as price source. Please beware that there is a typo: This strategy does not go short, it closes the long trades and goes into cash instead, therefore this is a long only strategy.
If you don't want to lose all your money due to some random strategy you found on the Internet, here is a warning:
All trading involves high risk; past performance is not necessarily indicative of future results. Hypothetical or simulated performance results have certain inherent limitations. Unlike an actual performance record, simulated results do not represent actual trading. Also, since the trades have not actually been executed, the results may have under- or over-compensated for the impact, if any, of certain market factors, such as lack of liquidity. Simulated trading programs in general are also subject to the fact that they are designed with the benefit of hindsight. No representation is being made that any account will or is likely to achieve profits or losses similar to those shown.
P.S. The published script does not show the other trade entries on the screenshot above. Here is how the strategy looks like on the chart: