SPY RelativeShows an instrument's sentiment in a day (or week) compared to the market (SPY default). The Red line shows bearish sentiment compared to the market and the green is bullish. Technically this works like a proxy for Alpha/Beta factor.
SPDR S&P 500 ETF (SPY)

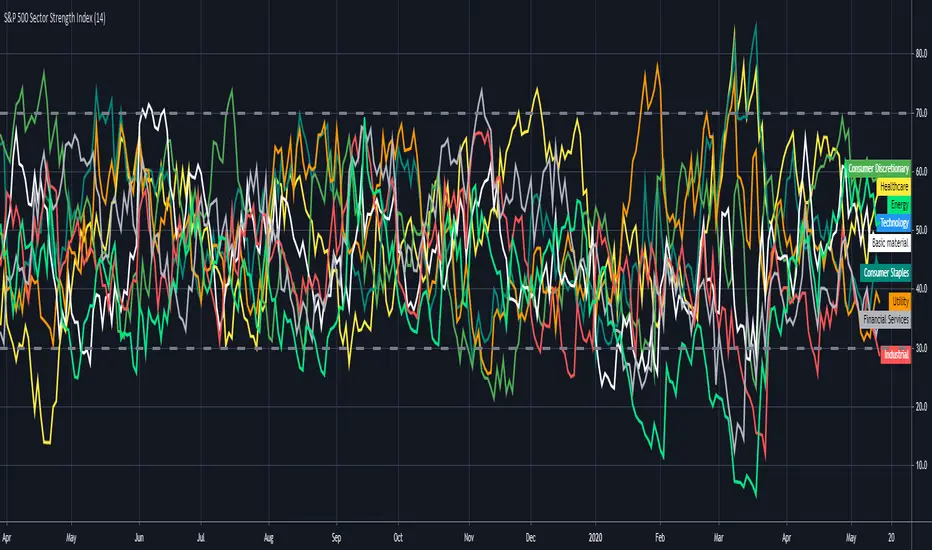
S&P 500 Sector Strength IndexHi traders , this is lonelygrass again 😄, and I am going to show what you don't often see out there and share it with you.
This indicator is called "s&p 500 sector strength index"😎 , which allows you to distinguish strengths and weaknesses between different sectors in s&p500, and to create meaningful trading frameworks around it.
Similar to the RSI indicator , it also has overbought and oversold levels , you can clearly figure out the degree of crowd behaviors in various sectors' stocks .
For me 🤣, I will use it to "BUY LOW⬇️ , SELL HIGH⬆️". When a sector is oversold at the moment, I will try to buy those stocks when I find price actions and chart patterns in comply with the analysis by this indicator , the opposite for shortselling.
Also, for sake of being more user-friendly 👍, I added a function which enables you to only select the sector(s) you want to look at in order to make it less messy.
If you can't help to know what I will share with you coming up, then FOLLOW my account 😙 . Also , your likes and shares are really important 🎊. I will get more motivated to bring you new thing every day!!! ✍
Monthly MA Close Generates buy or sell signal if monthly candle closes above or below the signal MA.
Long positions only.
Inputs:
-Change timeframe MA
-Change period MA
-Use SMA or EMA
-Display MA
-Use another ticker as signal
-Select time period for backtesting
This script is not necessarily written to maximize profits, but to minimize losses.
Although it can outperform 'Buy & Hold' on some occasions when there is a multiple month bearisch trend.
You can optimise this strategy by changing the signal MA inputs.
I would suggest aiming for the best Profit Factor starting from the monthly ("M") setting.
You can always fine-tune the results at a lower timeframe.
The option to use another ticker for providing signals can give you a more stable and unified results.
For example using AMEX:SPY as signal with default parameters gives better results with NASDAQ:AAPL than if you would use NASDAQ:AAPL itself.
I used the anti-repainting function from PineCoders to prevent repainting.
This script is best used for multi-month trading positions & Daily or 4H setting of your chart.

OasisTrading OHL Levels This indicator is free to all Oasis Trading Group members.
Open, High, and Low levels for D, W, M, 90D, 12M.
Labels and Alerts coming soon.
For Access or Questions: Private message us. Thank you.

Wick SniperThis indicator is free to all Oasis Trading Group members.
The Wick Sniper was created to catch volatile moves that are extended from the mean. It uses an advanced ATR formula to follow price like a band, with an upper deviation and a lower deviation. I have also added a 1 candle offset so that the moves are not in "hindsight". Feel free to experiment with the inputs to find what is best for your asset.
For Access or Questions: Private message us. Thank you.

SPY Expected Move by VIXThis indicator shows 1 and 2 standard deviation price move from the VWAP based on VIX. Implied Volatility (IV) is being used extensively in the Option world to project the Expected Move for the underlying instrument. VIX is used as a proxy for SPY's IV for 30 days.
This indicator is meaningful only for SPY but can be used in any other instrument which has a strong correlation to SPY.

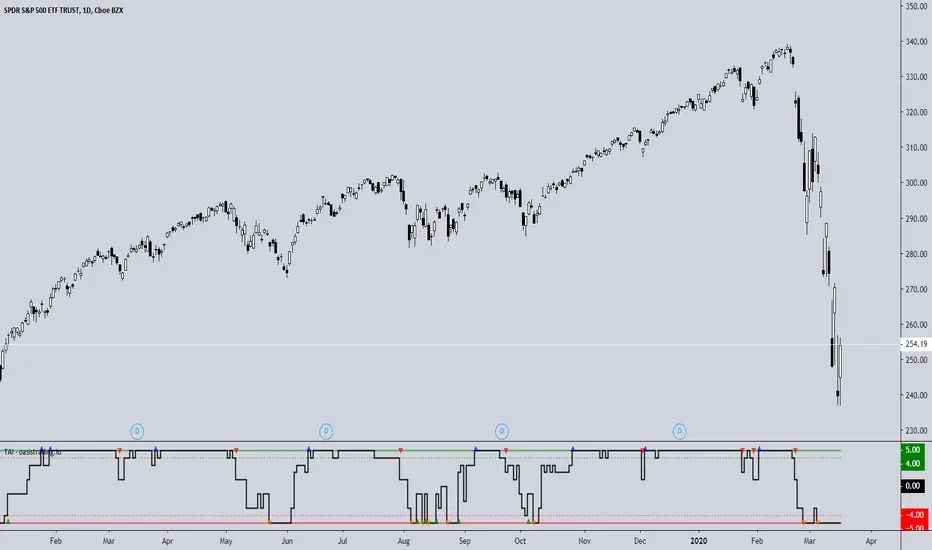
TAI - Trend Agreement IndexThe TAI is an experimental indicator we created to begin working on a automated trading algorithm. It takes five signals from our indicators and gives a +1 or -1 for each signal depending on if the signal is bullish or bearish.
This indicator should not be used for direct signals, but for confluence in trend. Long periods of flatness at 5 or -5 will indicate a very strong trend in that direction.
The TAI gives 4 different arrows depending on what the trend is doing.
Blue = Uptrend
Red = Uptrend Lost
Orange = Downtrend
Green = Downtrend Lost
This is a free add-on indicator for traders with access to the DBT MoMo and the Oasis Trading Suite and Bundle Package.
For Access or Questions: Private message us. Thank you.
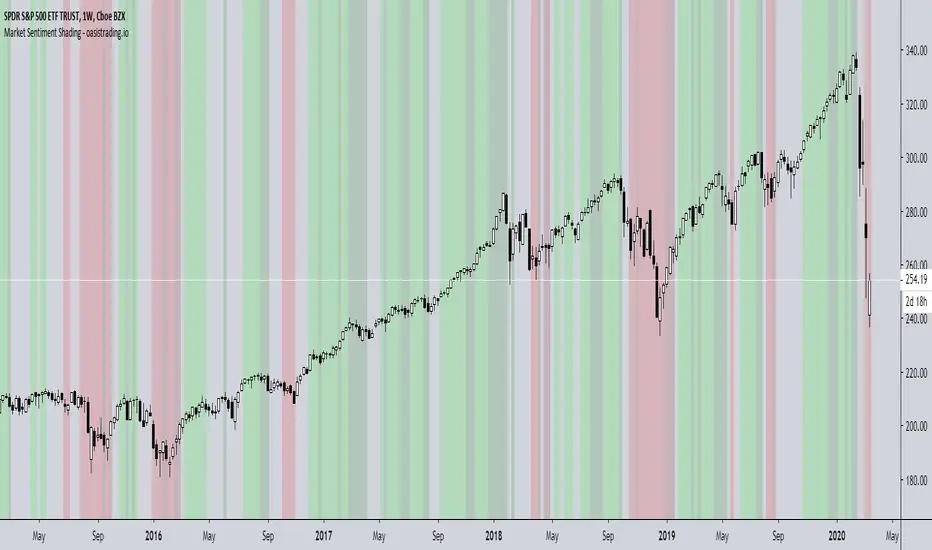
Market Sentiment ShadingThe Market Sentiment Shading Indicator shades the background of the asset based on signals from the DBT MoMo and Oasis Trading Suite. This indicator was designed to make it very obvious which direction the trend is moving and to keep the trader focused on following trend.
There are four different shades:
Dark Green = Bull
Light Green = Strong Bull
Dark Red = Bear
Light Red = Strong Bear
This is a free add-on indicator to traders with access to the DBT MoMo and Oasis Trading Suite and Bundle Package.
For Access or Questions: Private message us. Thank you.
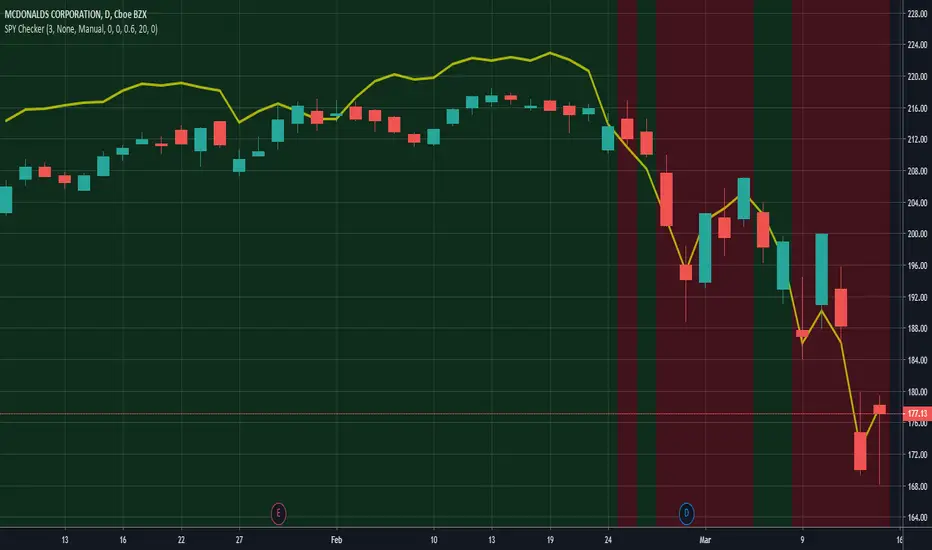
SPY CheckerUsing this indicator allows you to check the SPY for large gaps and candles (e.g. >1%) directly in your stock chart at first glance.
It is now also possible to use this indicator for all stock charts and to get the SPY indication on them visible without opening the SPY chart explicitly.
You are able to display the SPY trendline in the current chart as an overlay (yellow line) and configure the SPY trendline adjustment in the indicator settings. This will allow you to determine if the current stock chart is following the SPY or not. And you can also select a trading stop for several days in the indicator settings, which is visible through the green and red background color.
Hope this helps many of you to be more efficient in your SPY verification - have fun!
ATS Masters Indicator #3This master indicator is a collection of multiple useful indicators, which only requires one indicator slot in TradingView.
In this collection you will find the following 4 special indicators:
Gaps Checker
Large Candles Checker
SPY Checker Lite
Volume Checker Pro
So, using this master indicator you are able to use up to 4 special indicators in one.
If you would like to test this master indicator drop me a line and send a request for it.

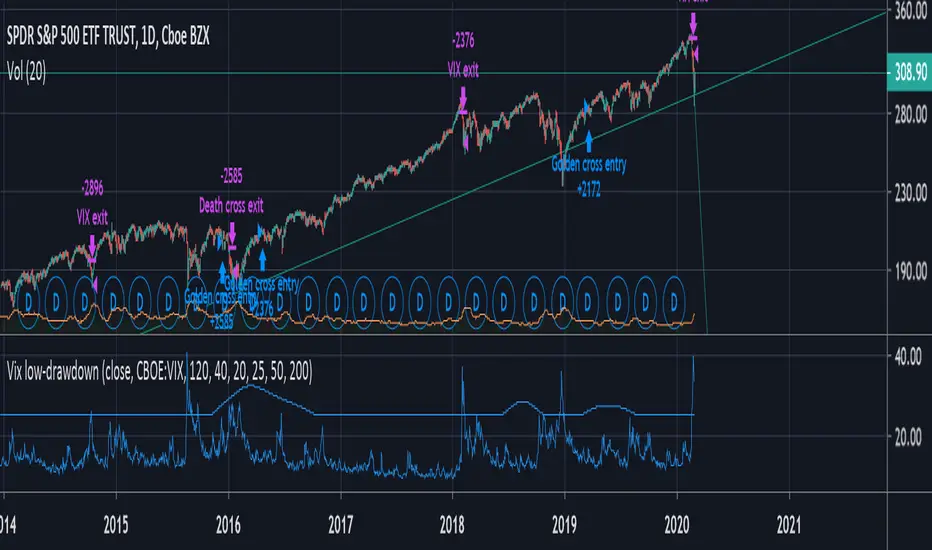
VIX + moving average low-drawdown SPY strategyAims to be a simple way to avoid recessions by combining two complementary tools that work well together: A simple moving average crossover (death cross & golden cross) to detect a bull markets and run with it, and a crossover between the VIX and a moving average of its previous peaks to get out as quickly as possible during periods of volatility.
The Death cross gets you out of slow drawn-out bear markets. The VIX gets you out of sudden rapid crashes.
TradersAI - Test 3**** This is a TEST script only! Do NOT use on real money accounts! *****
***** Intended to be used in testing by invited_only members *****
***** If you want to participate in our testing using your paper trading account(s), send me a private message *****

SPY Weekly Trading Strategy - ARK IndicatorDisclaimer: This is not financial advise, please consult with your licensed Financial Advisor for investment advise
Hello everyone,
This Script is designed to spot trends and provide you with an entry and exit points.
Rules of Trading with this Indicator:
1- The best risk/reward ratio of this indicator is that you buy at the very first buy Signal "B" and Sell at the very first Sell Signal "S"
2- and Repeat ....as simple as that
Few notes:
1- The repeats of the buy/sell signal are just confirmation of the the trend so to maximize the chances of being profitable, always start when the trend flips (From Sell to buy and vice versa).
2- No signal indicates that you maybe on an up/down trend depending on what the last signal was but the trend is starting to get weak
3- Once a trend is spotted by the algorithm, it will plot a line to establish, entry and exit depending on the direction of the trend (green for buying and red for selling)
4- you will notice that during up trend since the indicator recommends buying only entry points will be suggested with the help of a green line to give you an exact entry point, it is important that the price reaches that entry point for you to pull the trigger, however once the trend gets exhausted it will start to plot a red line so you are mentally prepared that a counter trend might be just around the corner (this is a pretty useful feature)
5- Recommended Settings: The most important setting that you need to be mindful of is "Signal Frequency", based on my observation so far, 2 works best with Weekly & monthly Charts, 8 with Daily Charts , and 10 with hourly charts or lower. As you know the price of a security depends on countless variables, including but not limited to general market condition, success/failure of the underlying security, and the psychology of the market participants of the security, so you can play around with the signal frequency to see what gives you the optimal/profitable signal in the historical candles.
6- the indicator comes with 3 moving averages since some traders/investors like to use moving averages, if you don't need them feel free to turn them off in the settings. they aren't part of any thing used behind the scene.
any questions feel free to contact me by commenting below.
Note: if you have any useful ideas on how to enhance the indicator, please don't be shy!
Warm regards & best of luck!
Ahmad

(JS)S&P 500 Volatility Oscillator For Options 2.0I am going to start taking requests to open source my indicators and they will also be updated to Version 4 of Pinescript.
I added some features to the original code such the ability to smooth the oscillator and select the look back periods for the historical volatility.
Link to original:
Original post:
"The idea for this started here: www.tradingview.com with the user @dime
This should only be used on SPX or SPY (though you could use it on other things for correlation I suppose) given that the instrument used to create this calculation is derived from the S&P 500 (thank you VIX ). There's a lot of moving parts here though, so allow me to explain...
First: The main signal is when Implied Volatility (from VIX ) drops beneath Historical Volatility - which is what you want to see so you aren't purchasing a ton of premium on long options. Green and above 0 means that IV% has dropped lower than Historical Volatility . (this signal, for example, would suggest using a Long Call or Put depending on your sentiment)
Second: The green line running underneath zero is the bottom portion of the "Average True Range" derived from the values used to create the oscillator. the closer the bottom histogram is to the green line, the more "normal" IV% is. Obviously, if this gets far away from the line then it could be setting up nicely to short options and sell the IV premium to someone else. (this signal, for example, would suggest using something like a Bull Put Spread)
Third: The red background along with the white line that drops down below zero signals when (and how far) the IV% from 3 months out (from VIX3M ) is less than the current IV%. This would signal the current environment has IV way too high, a signal to short options once again (and don't take any long option positions!).
Tried to make this simple, yet effective. If you trade options on SPX , SPY , even ES1! futures - this is a tool tailored specifically for you! As I said before, if you want you can use it for correlation on other securities. Any other ideas or suggestions surrounding this, please let me know! Enjoy!
Feb 17, 2019
Release Notes: Cosmetic update for a much cleaner look:
-Replaced the "HIGH IV" with a simlple "H"
-Now the white line is constantly showing you the relationship between VIX and VIX3M - when VIX is greater than VIX3M the background still goes red
-However, now when VIX drops below Historical Volatility, the background is bright green
-When both above are true - it's dark green
-The Average True Range on the bottom is now a series of crosses"

Auto Squeeze Breakout BarsThe Auto Squeeze Breakout Bars find bars that are breaking out of a low volatility environment into a high volatility environment.
The Squeeze shading is signaled when the volatility of the asset is very low. Then the Squeeze Breakout Bars are signaled when the asset is breaking out of this low volatility structure.
Warning bars will be signaled when it is approaching a breakout, but the conditions are not fully met at that very time.
The Auto Squeeze Breakout Bar indicator also has a built in stop loss mechanic that can be set to your preferred limit.
Stop losses are highly recommended when using the breakout bars because of possible head fakes. They are rare, but can occur depending on the asset you are trading.
For Access or Questions: Private message us. Thank you.

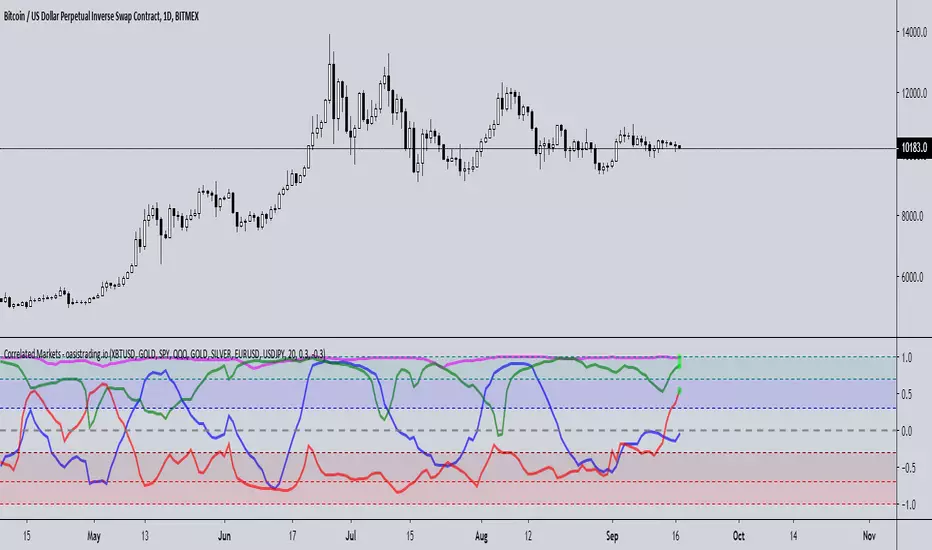
Correlated MarketsThis indicator is free to all Oasis Trading Group members.
This indicator reads correlations between two symbols of your choice, and displays 4 correlations at the same time.
The upper and lower thresholds are user-definable, alerts and visual indications are given when the line crosses the level.
This indicator uses a correlation coefficient which ranges between -1.0 and +1.0.
A correlation of +1.0 implies a perfect correlation while -1.0 implies the two pairs are in complete opposition.
This is useful not only in Forex trading but also for managing or diversifying your portfolio or for finding patterns,
for example when two Forex pairs move independently or an altcoin splits from BTC .
A circle on the +1 line will display for a positive correlation (or whatever you set the threshold to and vice versa for the -1 line.
Alerts are also available for each correlation pair.
For Access or Questions: Private message us. Thank you.
NYSE_ADVANCE_DECLINE_VOL vs SPYThis script plot a NYSE ADVANCING DECLINING VOLUME LINE on a WMA histogram of SPY. Very new at coding pine script, so use at your own risk

Bar RatioBar Ratio is an indicator tool that provides real-time likelihood of the current bar closing up or down (green or red).
Technical status, volatility and time are key elements in this indicator.
From the open of a bar, a ratio of 50% is assumed before changes from factors are considered.
The factors that change the likelihood of a bar closing up or down and their relative weight are listed below.
Micro-Trend observed over the last 20 bars - up to 2.5%
Macro-Trend observed over the last 70 bars - up to 2.5%
Current bar price against beginning of Micro-Trend - up to 2.5%
Combination of significant change above average volatility and move against direction of Micro-Trend - up to 2.5%
Combination of significant change above average volatility and move against direction of Macro-Trend - up to 2.5%
Previous bar direction up to 10 consecutive bars - up to 3.75%
Current status of bar (higher or lower) - up to 3.75%
Significance of change against average volatility - up to 5%
Time until bar close - up to 25%
Total: 100%
If all factors are synchronised, the likelihood of the bar closing up or down can be indicated at a probability of 100%.
While the practical ability for this to be used for trading is limited, the tool can be useful for choosing when it is safe to open a trade.
Time is a key element as the likelihood of the bar remaining at current status by the close of the bar is constantly increasing.
The accuracy of this tool is incredible and should be noted as it's primary trait.
You can find and use this indicator on any time-stamp or security such as Cryptocurrency, Forex, Stocks or Indices.
The Bar Ratio can be located by searching in your public indicator library at the top of your chart and adding it to your screen.

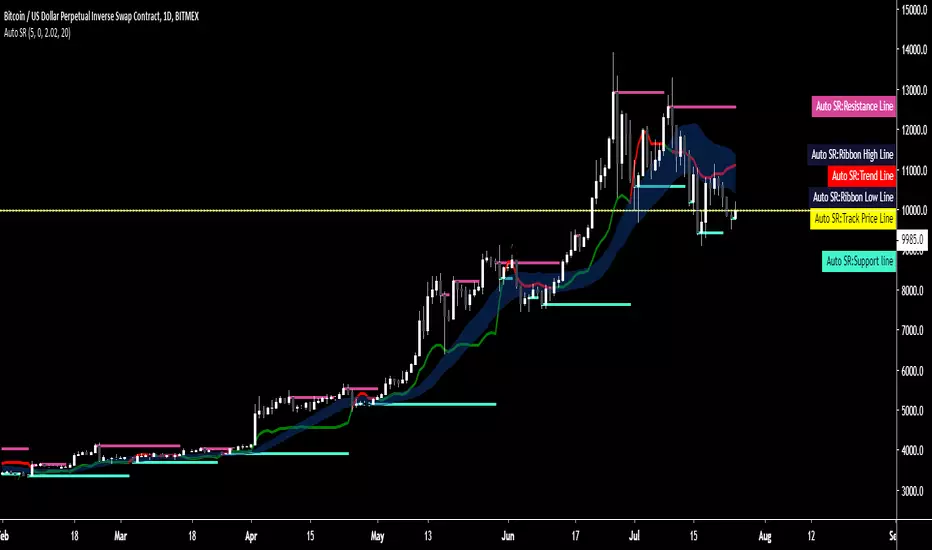
Auto SR - Automatic Support & ResistanceAuto SR is an indicator for TradingView™ which automatically searches and prints key support and resistance levels.
Its strength lies within its ability to provide visualization in real-time to aid in your trading.
It's a versatile indicator suitable for both short or long time frames and has a precision of 8 decimal points, therefore making it suitable for any market type.
A trend line shows a shift in major trends while a ribbon shows you shifts in smaller trends and indications are given for break and re-entry of both support and resistance levels.
All conditions are coupled with their own alerts, giving you the option to integrate it into your trading system or receive alerts on-the-fly.
Tried, true and tested for over one year, Auto SR has already become a trusted staple of those who've experienced it.
As a standalone system or an addition to your existing strategy, Auto SR has what it takes to elevate your trading to the next level.
Key Features:
- Automatic charting of support and resistance lines charted in real-time, no repainting.
- Major and minor trend detection
- Full alerts for support and resistance forming, price exiting or re-entering lines, trend shifts and more.
DBT MoMo v.4DBT MOMO
Introduction: The MoMo is a TradingView indicator designed to evaluate momentum and give the user signals according to momentum shifts, strength, extensions, traps, and divergence. It’s an all in one oscillator that will make reading price action near term and long term much easier.
Part One: Strength
The MoMo consist of two major parts. A 3-candle back formula and a 24-candle back formula. The 3-candle back is called the Price Line (the histogram on the MoMo). The 24-candle back is called the Trend Line (the line on the MoMo). Both lines are placed into a range from 20 to -20. It can go higher than 20 or lower than -20, but this is extremely rare and short lived.
A positive number indicates a bullish bias, a negative number indicates a bearish bias. When the Price or Trend line are ascending while below 0 this indicates that the bearish momentum is weakening. When the Price or Trend line are descending while above 0 this indicates that the bullish momentum is weakening.
In a strong trend the Trend Line will likely flatten out around 15 or -15. While the Trend Line is flat the Price Line will likely shift rapidly, this can lead to bull and bear traps, we will discuss this in the Trap section.
A rare, but powerful signal from the MoMo is when the Price and Trend Lines “pinch” and begin to move in the same direction. If this is happening the trader should be looking to follow the direction of these lines.
Part Two: Extensions
When both Price and Trend Lines are above 10 or below -10 this will begin to signal an extension.
Purple: Indicates the bears are extended to the downside and a pullback or trend reversal upward is likely.
Gold: Indicates the bulls are extended to the upside and a pullback or trend reversal downward is likely.
When only the Trend Line is above 10 the MoMo will shade the upper range red. This indicates the Trend is becoming bullish or entering an extension. If the Trend Line cannot maintain above 10 for long and breaks below 10 this indicates it’s an extension and trend will most likely continue downward.
When only the Trend Line is below -10 the MoMo will shade the upper range green. This indicates the Trend is becoming bearish or entering an extension. If the Trend Line cannot maintain below -10 for long and breaks above -10 this indicates it’s an extension and trend will most likely continue upward.
When the green or purple shading have turned off take the lowest point, this is considered a support level or a local bottom.
When the red or gold shading have turned off take the highest point, this is considered a resistance level or a local top.
The trader can preemptively trade the purple or gold warnings but be warned these warnings can go on for a long time if the trend is very strong. It is the same mentality of an overbought or oversold RSI, except the MoMo extensions have a much higher strike rate.
To avoid preemptively trading these extensions the trader should wait for confirmation on the Price Line and on price action. The Price Line (histogram) should be moving upward during a purple extension to begin showing a bottom. The Price Line (histogram) should be moving downward during the gold extension to begin showing a top.
Part Three: Traps
The relation between the Price Line and Trend Line can create trading signals for bull and bear traps. When the Trend Line is flattened out around 15 or -15, indicating a strong trend is in place, and the Price Line is rapidly moving towards the midline this may indicate a trap is forming.
When the Trend Line is flat around 15 and the Price Line begins moving towards 0, if the Price Line reaches 0 or close to 0 and the Trend Line is still flat, a trap has begone. Once the Price Line shifts from decreasing (red) to increasing (green) the trap is playing out. Therefore, the trader should look to exit short positions or enter long positions.
When the Trend Line is flat around -15 and the Price Line begins moving towards 0, if the Price Line reaches 0 or close to 0 and the Trend Line is still flat, a trap has begone. Once the Price Line shifts from increasing (green) to decreasing (red) the trap is playing out. Therefore, the trader should look to exit long positions or enter short positions.
Part Four: Divergences
The MoMo is exceptional at finding divergences with the Price Line and occasionally the Trend Line.
To find a divergence with the MoMo the trader must look for when the histogram is not following price action completely.
Bullish Divergence: Price makes a lower low, MoMo makes a higher low.
Bearish Divergence: Price makes a higher high, MoMo makes a lower high.
Hidden Bull Divergence: Price makes a higher low, MoMo makes a lower low.
Hidden Bear Divergence: Price makes a lower high, MoMo makes a higher high.
For Access or Questions: Private message us. Thank you.

Oasis Trading Suite LiteOasis Trading Suite Lite
Introduction: The Oasis Trading Suite is a TradingView indicator designed to make following trend and finding key pivot points very easy. It provides the trader with advanced trend coloring for candles, pivot points both high and low, and a trail that will follow price and give signals when a “buy the dip” or “sell the rally” opportunity is presented. This is a Lite version that only showcases the candle coloring.
Part One: Candle Coloring
The Oasis Trading Suite colors candles based on a trending bullish or bearish bias; this will override the default red/green coloring of candles which is based on closes.
Bullish Candles will be denoted with a green color by default.
Bearish Candles will be denoted with a red color by default.
Neutral Candles will be denoted with a gray candle by default. These are candles that do not have a trending bias.
For Access or Questions: Private message us. Thank you.
For the Full Version go here.

Oasis Trading SuiteOasis Trading Suite
Introduction: The Oasis Trading Suite is a TradingView indicator designed to make following trend and finding key pivot points very easy. It provides the trader with advanced trend coloring for candles, pivot points both high and low, and a trail that will follow price and give signals when a “buy the dip” or “sell the rally” opportunity is presented.
Part One: Candle Coloring
The Oasis Trading Suite colors candles based on a trending bullish or bearish bias; this will override the default red/green coloring of candles which is based on closes.
Bullish Candles will be denoted with a green color by default.
Bearish Candles will be denoted with a red color by default.
Neutral Candles will be denoted with a gray candle by default. These are candles that do not have a trending bias.
Part Two: Pivots
In addition to the normal red/green/gray candles there are also blue and orange candles. These candles are pivot bars.
Blue bars denote Bottom Pivots
Orange bars denote Top Pivots
These pivots are not exactly support and resistance, but more of a zone of influence. They can act as support and resistance, swing zones, and breakout points. These are not standard pivots, they do not repaint, they form live and once closed will not move candles.
Part Three: Trail
Finally, the Oasis Trading Suite gives the trader a trailing line that will turn green or red depending on trend. If price falls to the trail and the low (for green trail) is the only thing below the trail it will give a “buy the dip” signal. If the high (for red trail) is the only thing above the trail it will give a “sell the rally” signal. This trail is slightly lagging, so when trend is shifting there will sometimes be false signals at the final shifting point. I am experimenting with removing as many as possible using the “Strict Mode” found in the input settings for the Oasis Trading Suite.
Buy the Dip will be denoted by a Blue Arrow
Sell the Rally will be denoted by an Orange Arrow
For Access or Questions: Private message us. Thank you.

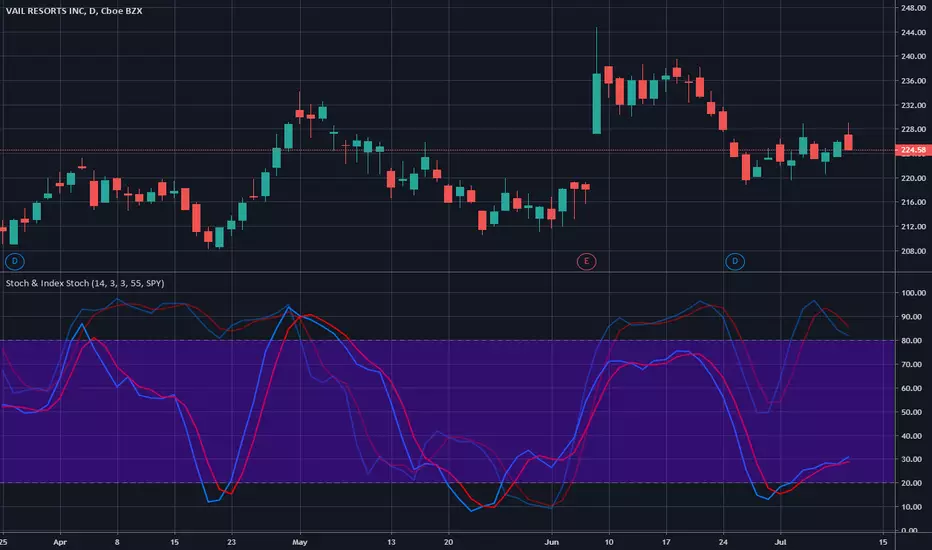
Stochastic & Index StochasticUsing this indicator you will be able to use the standard stochastic of a stock ticker as well as the stochastic of a stock market index simultaneously and without changing charts - both stochastics combined in only one indicator.
The stock market index stochastic can be changed in the indicator settings and is displayed with higher transparency. The degree of transparency and default color settings can also be adjusted.
For special analysis purposes, it is possible to display only the stochastic of the selected stock ticker or only the stochastic of the selected stock market index.
If you would like to test or use this indicator please drop me a line and send a request for it.