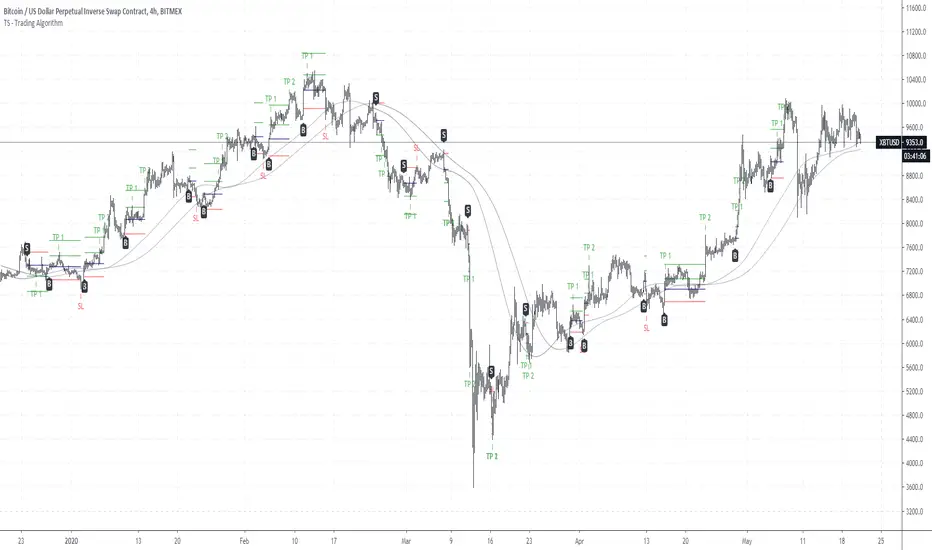
TS - Trading Algorithm - Crypto, Forex & StocksWhat does the TS - Algorithm do?
-- Plots trend following, high probability signals.
-- These signals do not repaint and can be used confidently to enter or exit a trade.
What markets can this indicator be used on?
-- Forex
-- Stocks
-- Commodities
-- Cryptocurrencies
What time-frames can this indicator be used on?
-- This indicator can be used on 1m, 3m , 5m, 10m, 15m, 30m, 1hr, 2hr, 3hr, 4hr, 6hr, 8hr, 12hr, Daily, Weekly, Bi-Weekly and Monthly time-frames.
-- This is a trend following algorithm, so low as there is good volume , volatility and price history of an asset, the model can perform.
Does this indicator repaint?
-- No
Premium Tradespot Script - Trial access and Information
-- Trial access offered
-- PM me directly to request trial access to the scripts or for more information.
Stocks
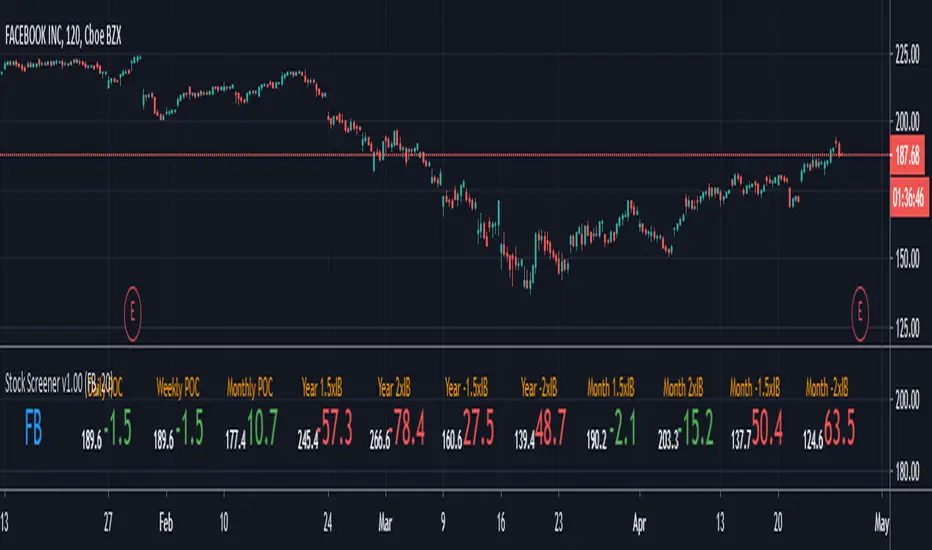
Stock Screener v1.00This script will show you the distance from the selected levels after entering your ticker. The first levels are POCs from the daily, weekly and monthly timeframes, the others are levels specially selected from multiples of the initial ballance on the monthly and higher timeframes. The display is in the form of a lowercase level and the distance of the current price from the level, where red indicates more distant levels and green means that the current price is close to the given level (default is 20 USD away)
send PM or visit website to get access
Theft Indicator - BOOM Buy/Sell SignalsWhat is our indicator?
Theft Indicator - BOOM is a script that shows entry levels on a condition that is met with our special algo. The algo consists of crossovers, which are not visible but we take pride in the effort we have put to make this indicator have a high success rate as long as you have a scalping target price set.
Does it Repaint?
Our indicator does NOT re-paint. Although while setting an alert it may pop up the repaint alert, please take into consideration that once a signal is fired on a "CLOSED BAR", our signal will never disappear, they do not repaint.
What Markets is it usable with?
You can use it in any market, Forex, Stocks, Crypto, Indices. All time frames work, not all trades will be profitable (this is how trading is, you can take a loss sometimes). But the Majority is profitable if you use a stop loss and target price.
How to use:
Simple plug and play it to your chart, in addition to a few other indicators we will recommend to you (we still have not published them yet), and this will confirm your trades. You can also connect TV alerts with a bot and let it run. Please be aware that SLIPPAGE time is important, If you run a bot on this indicator you HAVE to know that the buy/sell price will be on the bar AFTER the Candle close (For example: the BUY/SELL alert is on a candle, the buy/sell your bot or you will execute WILL be in the following candle depending on your trading system. We advise you to not leave the bot to trade on its own, you have to monitor and have a specific syntax that we will help you with creating according to your trading style.
P.S: This is not financial advice, we are just sharing our indicator that we know has good results, and it will take time for people in -ve profiles to recover losses and for the profiting to be more profitable. We use a specific trading method that only works with it
You can contact me for more information about the indicator, Goodluck :)

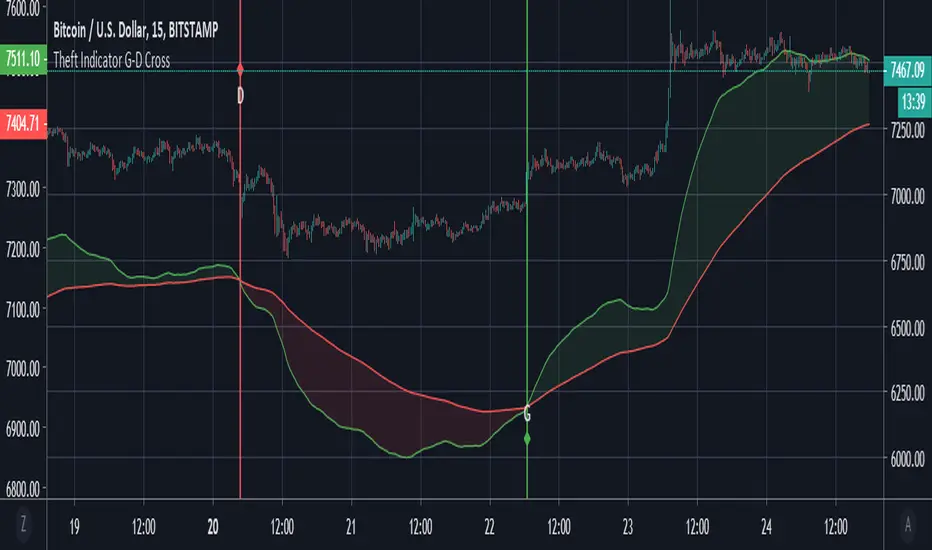
Theft Indicator - Golden/Death CrossThe golden cross and death cross used here is favorable for low time frames. We believe it is a good scalping option to use it. It works well with forex, stocks and crypto.
How is it used? - Just apply it to the chart, and take trades on the labels signaled. G = Golden cross || D = Death Cross.
The indicator is open for public use, but the source code is protected.
Enjoy it.
PpSIgnal Double Murrey's Math StrategyMurrey Math es un conjunto complejo de niveles de soporte y resistencia que actúan más o menos de la misma manera que los puntos de pivote, pero también proporcionan algunas ideas sobre si la tendencia actual debe continuar o revertirse. El concepto matemático de Murrey fue desarrollado por T. Henning Murrey en 1995 y se describió con gran detalle en su libro "El sistema de comercio matemático de Murrey para todos los mercados negociados".
compre cuando ambos sociladores este verdes y venda cuando ambos esten en rojo
Murrey Math is a complex set of support and resistance levels that act more or less the same as pivot points but also they provide some insights on whether the current trend should continue or it should reverse. The Murrey math concept has been developed by T. Henning Murrey in 1995 and has been described in great detail in his book “The Murrey Math Trading System For All Traded Markets.”
buy when both murray oscillators are green and sell when they are red

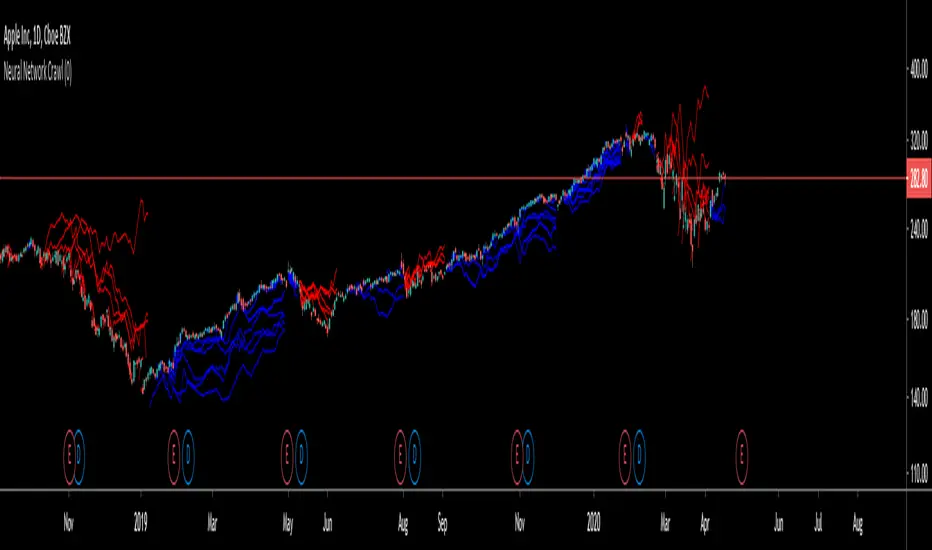
Neural Network CrawlAbout the Indicator
The Crawling Neural Network is a unique algorithm that identifies clusters of random walks that are crossing above or below the market price of the asset.
The random walks always exist, but the specific series that contribute to the cluster can only be seen during their significant period.
When the price trends strongly in a direction, it is more likely that it will traverse a significant amount of random walks and form a cluster.
The random walks are derived from a random selection of logarithmic movements in the last 200 bars and have been spawned at the beginning of price history.
Additionally, if you add the indicator to your chart multiple times and change the modifier in the settings panel, you can view more random walks that contribute to the clusters as seen in the screenshot below.
This indicator is available to everyone. Enjoy...
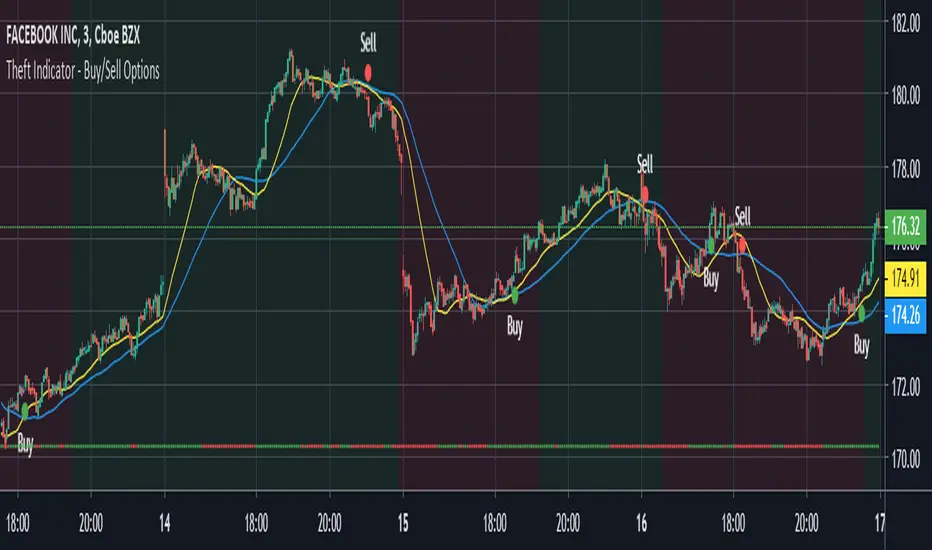
Theft Indicator - Buy/Sell Options Trading 1-3Mins ScalpingWhat is our indicator?
Theft Indicator - Buy/Sell Options Trading Signals is our third published script that shows price action on a certain period of time (We Use ATR indicator). We take pride in enabling trading to become easier for the experienced and the non-experienced traders around the globe. Buy & Sell alerts will be fired once a condition in our algo is met.
Does it Repaint?
Our indicator does NOT re-paint. Although while setting an alert it may pop up the repaint alert, please take into consideration that once a signal is fired on a "CLOSED BAR", our signal will never disappear, they do not repaint.
What Markets is it usable with?
You can use it in any market, Forex, Stocks, Crypto, Indices. All time frames are profitable, not all trades. But the Majority is profitable if you use a stop loss and target price. Although this one is for STOCK OPTIONS, it can work for other markets as well, but it will best perform with STOCKS & OPTIONS TRADING
How to use:
Simple plug and play it to your chart, in addition to a few other indicators we will recommend to you (we still have not published them yet), and this will confirm your trades. You can also connect TV alerts with a bot and let it run. Please be aware that SLIPPAGE time is important, If you run a bot on this indicator you HAVE to know that the buy/sell price will be on the bar AFTER the Candle close (For example: the BUY/SELL alert is on a candle, the buy/sell your bot or you will execute WILL be on the following candle depending on your trading system) THIS IS WITH EVERY SCRIPT, NOT MINE ONLY. We advise you to not leave the bot to trade on its own, you have to monitor and have a specific syntax that we will help you with creating according to your trading style.
How are the Buy/Sell Alerts fired?
We use the simple ATR (Average True Range) indicator. However we have modified the indicator to serve our trading system. Check below for a definition of what ATR is:
What is Average True Range - ATR?
The average true range (ATR) is a technical analysis indicator that measures market volatility by decomposing the entire range of an asset price for that period. Specifically, ATR is a measure of volatility introduced by market technician J. Welles Wilder Jr. The true range indicator is taken as the greatest of the following: current high less the current low; the absolute value of the current high less the previous close; and the absolute value of the current low less the previous close. The average true range is then a moving average, generally using 14 days, of the true ranges.
Why is our indicator special and different from the normal ATR indicators?
We have modified the uniqueness of ATR and changed it slightly to give more accurate signals, we do not promise all trades are profitable, the use of this indicator is up to your own judgement and liability. We believe that we have an indicator like no other ATR.
P.S: This is not financial advice, we are just sharing our indicator that we know has good results, and it will take time for people in -ve profiles to recover losses and for the profiting to be more profitable. We use a specific trading method that only works with it
You can contact me for more information about the indicator, Goodluck :)
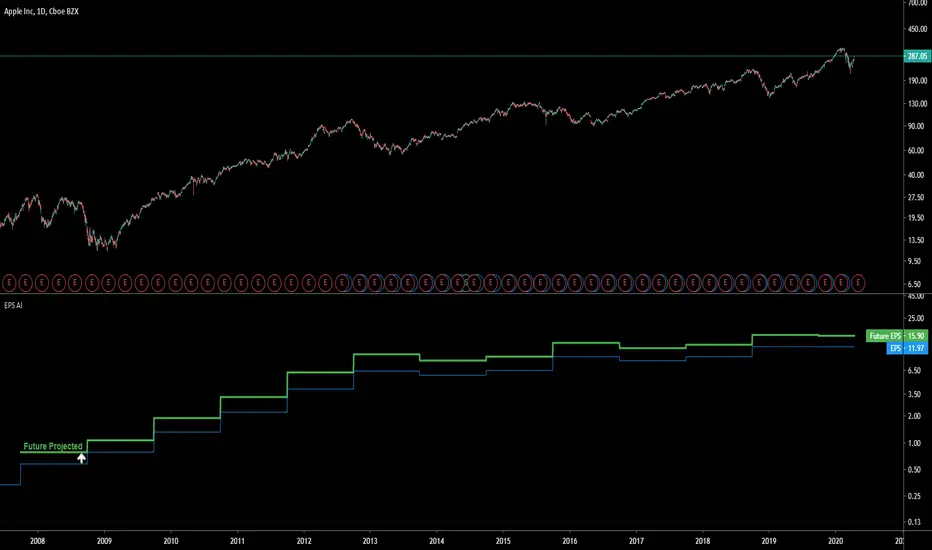
EPS AIThis indicator can be accessed by ANYONE by searching in the public indicator library located at the top of your chart!
Enjoy!
Introduction
This indicator uses machine learning to predict the next Earnings Per Share (EPS) figure.
The algorithm learns from previous figures in order to more accurately predict the next.
As time continues, this indicator will become more accurate as it learns from an increased amount of data from earnings results.
When the Future Projected EPS is positive, the line will appear green . When the Future Projected EPS is negative, the line will appear as red and sit below the EPS.
Settings Panel
The settings panel contains two tick-boxes.
Quarterly Earnings : When selected, the EPS and future projected EPS will utilise quarterly results. Yearly results are used by default.
Diluted EPS : When selected, the Diluted EPS and future projected Diluted EPS will be utilised. Basic EPS is used by default.
Indicator Utility
The EPS AI can be utilised on every securities instrument and time-frame.
This indicator has been built in Pinescript V4 and will operate in real-time.
This indicator can be accessed by ANYONE by searching in the public indicator library located at the top of your chart!
Enjoy!
Financials Per-EmployeeThe critical public eye has a strong interest in the fair payment of employees, especially in large, multi-national corporations such as Amazon, Apple, Google, and so on.
This indicator allows the user to view various measures of a companies financial performance against each employee.
When viewing the settings of this indicator, the user can select from a specific financial measure to view against the employees.
NOTE: Figures are published on a quarterly basis!
Settings Selections
Net Business Income per Employee
EBITDA per Employee
Gross Profit per Employee
Total Revenue per Employee
Total Common Equity per Employee
Total Number of Employees
This indicator can be accessed by ANYONE by searching in the public indicator library located at the top of your chart!

Theft Indicator - BUY/SELL AlertsWhat is our indicator?
Theft Indicator - Buy & Sell Alert System is our first published script that shows price action on a certain period of time (We Use ATR indicator). We take pride in enabling trading to become easier for the experienced and the non-experienced traders around the globe. Buy & Sell alerts will be fired once a conditions in our algo is met.
Does it Repaint?
Our indicator does NOT re-paint. Although while setting an alert it may pop up the repaint alert, please take into consideration that once a signal is fired on a "CLOSED BAR", our signal will never disappear, they do not repaint.
What Markets is it usable with?
You can use it in any market, Forex, Stocks, Crypto, Indices. We recommend high time frames but you can also use it on the 1 minute chart if you are a scalper and a risk taker. All time frames are profitable, not all trades. But the Majority is profitable. We will soon add a backtest strategy for it, there is no ETA on it tho.
How to use:
Simple plug and play it to your chart, in addition to a few other indicators we will recommend to you (we still have not published them yet), and this will confirm your trades. You can also connect TV alerts with a bot and let it run. Please be aware that SLIPPAGE time is important, If you run a bot on this indicator you HAVE to know that the buy/sell price will be on the bar AFTER the Candle close (For example: the BUY/SELL alert is on a candle, the buy/sell your bot or you will execute WILL be in the following candle depending on your trading system. Theft Indicator - Buy/Sell Alerts work best with higher time frames, however it works on smaller time frames, we recommend 15 mins, 30 mins, 1hr, 4hr. It just depends on your trading style. Please contact us if you do not understand how to use it.
How are the Buy/Sell Alerts fired?
We use the simple ATR (Average True Range) indicator. However we have modified the indicator to fit our trading system. Check below for a definition of what ATR is:
What is Average True Range - ATR?
The average true range (ATR) is a technical analysis indicator that measures market volatility by decomposing the entire range of an asset price for that period. Specifically, ATR is a measure of volatility introduced by market technician J. Welles Wilder Jr. The true range indicator is taken as the greatest of the following: current high less the current low; the absolute value of the current high less the previous close; and the absolute value of the current low less the previous close. The average true range is then a moving average, generally using 14 days, of the true ranges.
Why is our indicator special and different from the normal ATR indicators?
We have modified the mathematical equation and changed it slightly to give more accurate signals, we do not promise all trades are profitable, the use of this indicator is up to your own judgement and liability. We believe that we have an indicator like no other ATR because of our algo that is different from the normal ATR calculation.
P.S: This is not financial advice, we are just sharing our indicator that we know has good results, and it will take time for people in -ve profiles to recover losses and for the profiting to be more profitable.
You can contact me for more information about the indicator, Goodluck :)

Price CorrelationsThis indicator shows price correlations of your current chart to various well-known indices.
Values above 0 mean a positive correlation, below 0 a negative correlation (not correlated).
It works well with daily candle charts and above, but you may also try it on 1h candles.
The default indices:
- Gold
- S&p 500
- Mini Dow Jones
- Dow Jones
- Russel 2000
- Nasdaq 100
- Crude Oil
- Nikkei 225 (Japan)
- FTSE 100 (UK)
- Silver
- DAX Futures (DE)
You can change the defaults to compare prices with other indices or stocks.

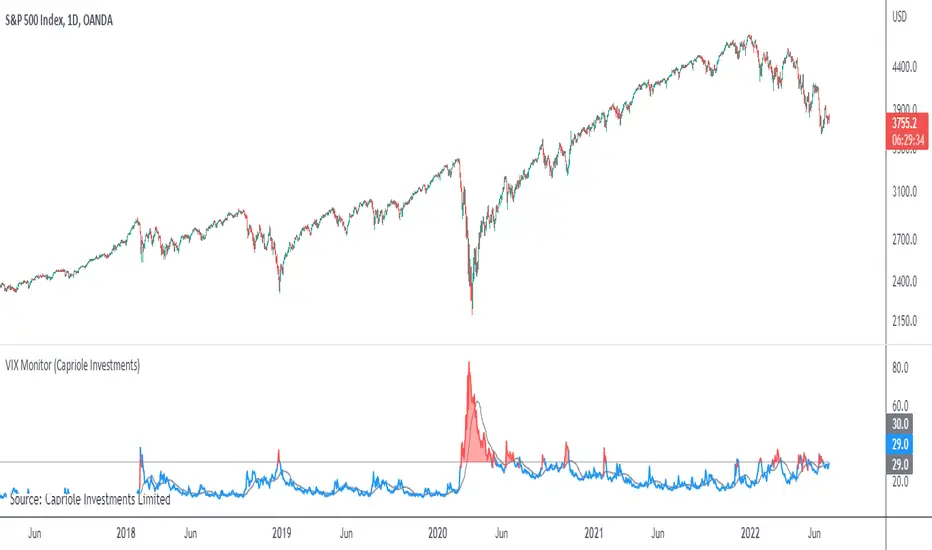
VIX MonitorSimple VIX Monitor to track spikes.
Spikes in VIX are often followed by big moves up in stocks.
Useful when paired with "Correlation & Beta" Indicator.
For Bitcoin Traders: when Bitcoin is highly correlated to Stocks (such as now) it could be a good opportunity for a short-term long trade.
Yield Curve Inversion MonitorIdentifies when the US Treasury Yield Curve inverts (2 and 10 year bond rates).
When they ‘invert’ long-term bonds have a lower interest rate than short-term bonds. In other words, the bond market is pricing in a significant drop in future interest rates (which might be caused by the US Fed fighting off a recession in the future).
In the last 50 years, every time the US treasury yield curve inverted a recession followed within 3 years. On average the S&P500 gained 19.1% following the inversion and peaked 13 months later. In other words, as far as investors are concerned, the recession began roughly one year later.
However, once the market peaks, it then drops 37.6% on average, wiping out all those gains and more.
...Looks like 2020 is shaping up to be another prime example.

Gold-Stocks RatioA historic risk-off flag.
When the Gold-Stocks Ratio is above the 200 week moving average, investors may fair better holding gold and avoiding equities, as was the case for the last 20 years.

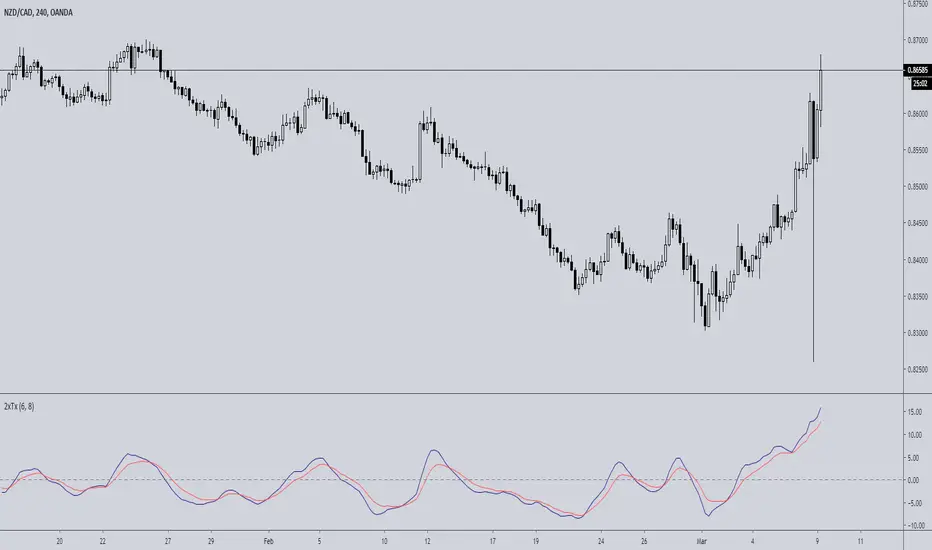
Double TRIX CrossoverTRIX is a great indicator to use on zero cross setups.... know what's even better? TRIX CROSS setups!!!
Faster in-and-out on trends, safer entry and exit signals in chop or consolidation. Base setup is 6 & 8 TRIX for longer time frames such as 4hr or 8hr; ideal or FX, Crypto, or volatile instruments. I haven't experimented with using this on lower time charts and adjusting the trix settings; if you do, drop a comment.
[e2] EDS Key & AvwapThis indicator shows a Key Level Support & Resistance level and VWAP that resets on your choice of the stock's Earnings , Dividends or Splits release date.
A maximum of 8 bands calculated using a factor of the anchored VWAP's standard deviation can be displayed.
Note
The script is designed for stock-trading only.
Credits
Inspired by timwest , LazyBear 's Earnings S/R Levels and MichelT 's Earnings, Splits, Dividends scripts.

Plutus eXploration Index - PXIGreetings Fellow Traders!
We have developed this simple and easy to use indicator so that all users can benefit from it by:
• Reducing the amount of time spent trading.
• Minimizing the risk of loss.
• Accurate timing on entries and exits.
• Signals are accurate in volatile market conditions.
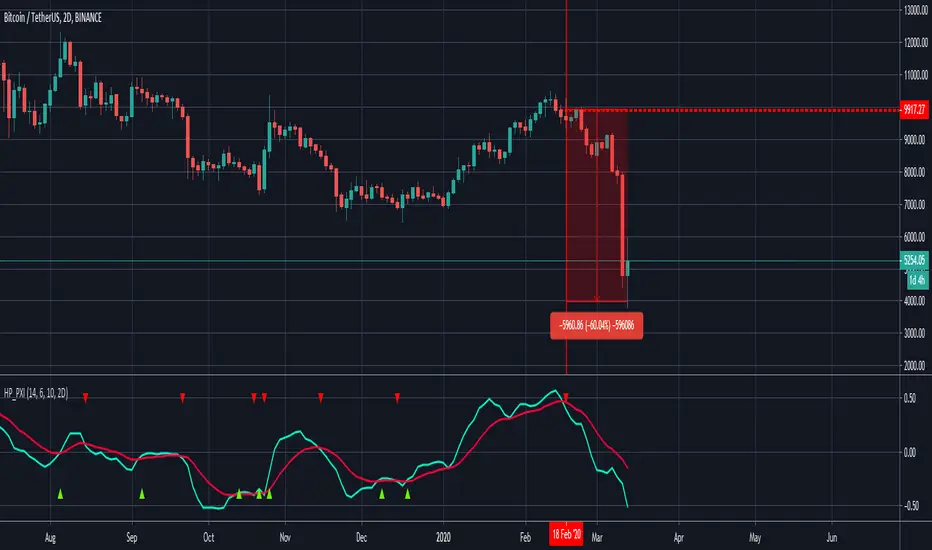
What is the PXI?
The Plutus eXploration Index falls under the centred momentum oscillator category which means that it fluctuates above and below a central point or line. Apex levels exist, where the indicator will reach a peak, and start moving in the opposite direction. Two lines move in unison and crossovers will signal a buy and a sell.
Setting up the indicator:
Once you have received your invite, the indicator will appear under your "my invite only" scripts in trading view detailed charts screen. Select PXI and add it to your chart. For free accounts on TradingView, the indicator limit is set to x3, so please de-activate something if you hit this limit.
You can access the PXI setting in the string of icons that follow after the indicators name in the top left corner of the indicator chart. In order:
Name | Visibility | Settings | Show source code | Delete | More
Under the settings, there are two tabs. One for the style, which you may freely change to suit your preferences. And then the first tab, for Inputs. The default settings for Long Minima, Short Maxima and Integrated EMA should not be changed.
The critical change to make in the input settings is the time frame !
The time frame on the price chart and the time frame on the indicator have to match! The range of allowable time frames is as follows:
15min | 30min | 1h | 4h | 12h | 1d | 2d | 1week
How to use the PXI:
The apex levels on the oscillator differ for each asset and vary depending on the selected time frame. The signals provided near apex points shall hold more weight. We recommend that traders assess these levels properly before considering a position.
Sell signal: Sell signals occur when the quick line (default blue) crosses over the slow line (default orange) from above.
A red arrow down will mark this point in time out on the chart.
Buy signal: Buy signals occur when the quick line (default blue) crosses the slow line (default orange) from bellow.
A green arrow down will mark this point in time out on the chart.
Maximizing Risk/Reward and profitability:
The indicator strives to keep positions open long enough to reap real rewards in the market. Maximum profit levels naturally occur around the apex points on the indicator chart, and the onus is on the trader to attempt an early exit once these levels are achieved.
Addition points to consider:
Most profitable trading signals occur on the daily time frames while considering the duration of trades and timing of the signals. For the lowest risk levels, weekly time frames are most suitable. From the weekly time frame down, the risk increases incrementally until you reach the 15min time frame. Signals at the lower levels occur more often and they are effective but, they should, however, be monitored closely. Also, the lower the time frame, the higher the chances of false-positive signals.
will not be liable for damages of any kind resulting from your use of or inability to use the indicator or content.
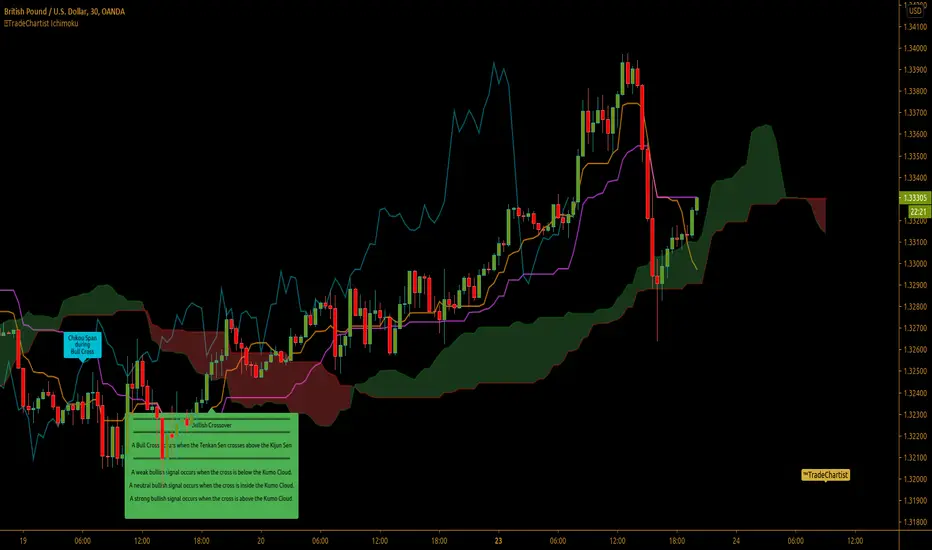
™TradeChartist - Show and Tell - Ichimoku Cloud™TradeChartist Show and Tell - Ichimoku Cloud is a free and easy to use script that helps anyone learn and understand the Ichimoku cloud by using the 'Show and Tell' option from the indicator settings and by choosing the Ichimoku component/Signal from the dropdown box. For individuals new to Ichimoku Cloud , Show and Tell option will help explain the components and signals of Ichimoku Cloud on the chart without having to navigate away from price action, thus making it easier to learn and understand Ichimoku cloud with respect to chart price action on the corresponding time frame.
The indicator automatically detects cryptocurrencies as it uses different settings specific to cryptocurrencies market - (20,60,120,30) respectively as opposed to classic - (9,26,52,26).
When 'Show and Tell' is unchecked from indicator settings, the script detects signals and important Ichimoku events like Bull/Bear crosses, Bullish/Bearish Kumo Twists, Bullish/Bearish Kumo Breakouts etc and plots labels on chart. To turn off this feature, just uncheck 'Labels' from the styles tab under the indicator settings.
This is a free to use indicator. Give a thumbs up or leave a comment if you like the script.
Larsson AcademyThe L.A. Indicator supports:
- Trend trading (not range trading) of
- Tech assets, such as tech stocks and bitcoin/cryptocurrencies (not commodities) over
- Long timeframes, e.g. daily, weekly and monthly candles (not hourly candles or less).
By distilling all data down to one of 3 states, up, down or inconclusive, the indicator can aid in the decision making over long time periods, together with a rule based trading process. It works by measuring trend consistency.

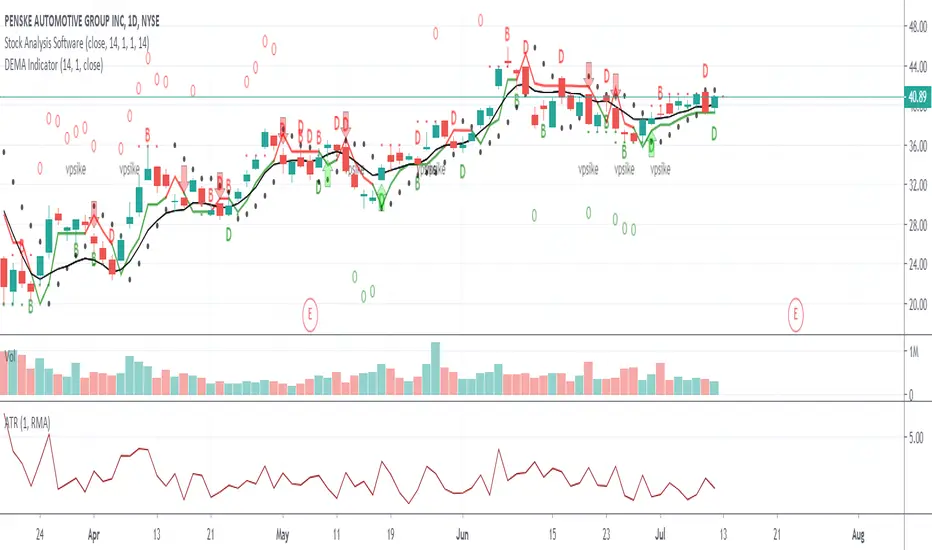
DEMA Indicator
The DEMA indicator is part of the stock analysis software trading system and will highlight on the chart when the moving average and candle are touching on a certain percent ratio. When the candle is GREEN and touching the moving average in the correct ratio it will show a GREEN D below the candle. If the candle is RED and it is touching the moving average in the correct ratio it will plot a RED D above the candle.
If you look at any of these charts you will see the red and green D's. The green D's below the green candles would signal a more bullish looking setup where as a red D would signal a more bearish looking setup.
This indicator is great when added to the complete system to look for entries but also exits. This indicator has been used by myself for many years as a trading professional.
Trend former ver stockTrend Former's stock version service indicator.
It is designed to be printed on daily and three-day bars.
Market characteristics require longer breathing than coin in position.
For further details, we will gradually increase the upload.
트랜드 포머의 주식버전 서비스 지표입니다.
일봉과 3일봉에서 출력되도록 설계 되어 있습니다.
마켓 특성상 포지션에서 코인보다는 더 긴 호흡을 요구합니다.
추가적인 자세한 설명은 점차 업로드를 늘려가도록 하겠습니다.

[astropark] Trend Is Your Friend V3 [alarms]Dear Followers,
today another awesome Swing and Scalping Trading Strategy indicator, runnable on a bot , which works great on High Timeframes (1D is suggested) but also on lower ones (just write me in order to help you find correct settings) and even better on 1m Renko chart!
If you are a scalper, you will love suggested entries for fast profit. You can run it on 1h timeframe (below is not suggested, there is "no-trend" below 1h!) if you are used to scalp trading and close each trade whenever you feel happy (a proper trailing stop strategy is suggested anyway).
This is not an evolution of "Trend Is Your Friend V1" or V2 , but a twin sister or the "Trend Is Your Friend V1" indicator you can see here below
and twin sister or the "Trend Is Your Friend V2" indicator you can see here below
This strategy differs for the engine used as basis, but has the same usage settings:
enable/disable signals on chart
enable/disable showing trend cloud
enable/disable bar coloring based on trend
enable/disable background coloring based on trend
edit trend period length (direct message me in order to help you fine best settings)
edit a smart variant option to enhance the trend cloud on your chart
enable/disable an option to smart enter trade
This strategy only trigger 1 buy or 1 sell. In order to get notified when a signal is triggered, you need to use the "alarms" version of this indicator.
Strategy results are calculated on the timeframe from December 2012 to now, so on 8 years, using 10000$ as initial capital and working at 1x leverage (so no leverage at all! If you like to use leverage, be sure to use a safe option, like 3x or 5x at most in order to have liquidation price very far).
This is not the "Holy Grail", so use a proper risk management strategy.
This script will let you set all notifications you may need in order to be alerted on each triggered signals.
The one for backtesting purpose can be found by searching for the astropark's "trend is your friend v3" and then choosing the indicator with "strategy" suffix in the name, or you can find here below
This is a premium indicator , so send me a private message in order to get access to this script.

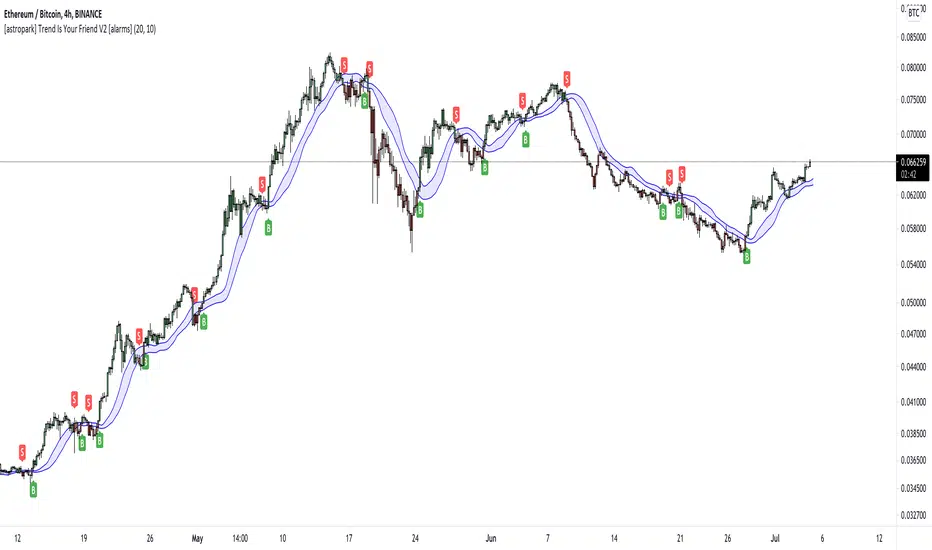
[astropark] Trend Is Your Friend V2 [alarms]Dear Followers,
today another awesome Swing and Scalping Trading Strategy indicator, runnable on a bot , which works great on High Timeframes (1D is suggested) but also on lower ones (just write me in order to help you find correct settings) and even better on 1m Renko chart!
If you are a scalper, you will love suggested entries for fast profit. You can run it on 1h timeframe (below is not suggested, there is "no-trend" below 1h!) if you are used to scalp trading and close each trade whenever you feel happy (a proper trailing stop strategy is suggested anyway).
This is a twin sister or the "Trend Is Your Friend V1" indicator you can see here below
This strategy differs for the engine used as basis, but has the same usage settings:
enable/disable signals on chart
enable/disable showing trend cloud
enable/disable bar coloring based on trend
enable/disable background coloring based on trend
edit trend period length (you have to increase it if you go on lower timeframes or you go on FOREX/Stocks market, direct message me in order to help you fine best settings)
This strategy only trigger 1 buy or 1 sell. In order to get notified when a signal is triggered, you need to use the "alarms" version of this indicator.
Strategy results are calculated on the timeframe from January 2015 to now, so on 5 years, using 10000$ as initial capital and working at 1x leverage (so no leverage at all! If you like to use leverage, be sure to use a safe option, like 3x or 5x at most in order to have liquidation price very far).
This is not the "Holy Grail", so use a proper risk management strategy.
This script will let you set all notifications you may need in order to be alerted on each triggered signals.
The one for backtesting purpose can be found by searching for the astropark's "trend is your friend" and then choosing the indicator with "strategy" suffix in the name, or you can find here below
This is a premium indicator , so send me a private message in order to get access to this script.