Institutional Zone Detector [Scalping-Algo]█ OVERVIEW
The Institutional Zone Detector identifies key supply and demand zones where large market participants (institutions, banks, hedge funds) have likely placed significant orders. These zones often act as powerful support and resistance levels, making them strategic areas for trade entries and exits.
This indicator is non-repainting, meaning once a signal appears on your chart, it will never disappear or change position. What you see in backtesting is exactly what you would have seen in real-time.
█ CORE CONCEPT
Markets move when large players execute substantial orders. These orders leave footprints in the form of specific candlestick patterns:
Demand Zones (Bullish)
When institutions accumulate positions, we often see a bearish candle followed by a strong bullish sequence. The last bearish candle before this move marks the demand zone - an area where buying pressure overwhelmed sellers.
Supply Zones (Bearish)
When institutions distribute positions, we typically see a bullish candle followed by a strong bearish sequence. The last bullish candle before this move marks the supply zone - an area where selling pressure overwhelmed buyers.
Price has a tendency to revisit these zones, offering potential trade opportunities.
█ HOW IT WORKS
The indicator scans for:
1. A potential zone candle (bearish for demand, bullish for supply)
2. A sequence of consecutive candles in the opposite direction
3. Optional: A minimum percentage move to filter weak signals
When all conditions are met, the zone is marked on your chart with:
• Upper and lower boundaries (solid lines)
• Equilibrium/midpoint level (cross marker)
• Extended channel lines for easy visualization
█ SETTINGS
Consecutive Candles Required (Default: 5)
Number of same-direction candles needed after the zone candle to confirm the pattern. Higher values = fewer but stronger signals.
Minimum Move Threshold % (Default: 0.0)
Minimum percentage price movement required to validate a zone. Increase this to filter out weak moves and focus on significant institutional activity.
Display Full Candle Range (Default: Off)
• Off: Shows Open-to-Low for demand zones, Open-to-High for supply zones
• On: Shows complete High-to-Low range of the zone candle
Show Demand/Supply Zone Channel (Default: On)
Toggle extended horizontal lines that project the zone levels across your chart.
Visual Theme (Default: Dark)
Choose between Dark (white/blue) or Light (green/red) color schemes.
Show Statistics Panel (Default: Off)
Displays a floating panel with exact price levels of the most recent zones.
Display Info Tooltip (Default: Off)
Shows an information label with indicator documentation.
█ HOW TO USE
Entry Strategies
1. Zone Bounce (Mean Reversion)
• Wait for price to return to a previously identified zone
• Look for rejection candles (pin bars, engulfing patterns) at zone levels
• Enter in the direction of the original zone (long at demand, short at supply)
• Place stops beyond the zone boundary
2. Zone Break (Momentum)
• When price breaks through a zone with strong momentum
• The broken zone often becomes the opposite type (broken demand becomes supply)
• Use for trend continuation trades
3. Equilibrium Trades
• The midpoint (cross marker) often acts as a magnet for price
• Can be used as a first target or as an entry point for scaled positions
Risk Management
• Always place stop-loss orders beyond zone boundaries
• Consider the zone width when calculating position size
• Wider zones = wider stops = smaller position size
• Use the equilibrium level for partial profit taking
Best Practices
• Higher timeframes produce more reliable zones
• Zones on multiple timeframes (confluence) are stronger
• Fresh/untested zones are more powerful than zones that have been touched multiple times
• Combine with other analysis methods (trend direction, volume, market structure)
█ ALERTS
Two alert conditions are available:
• "Demand Zone Identified" - Triggers when a new demand zone is detected
• "Supply Zone Identified" - Triggers when a new supply zone is detected
To set up alerts: Click on the indicator name → Add Alert → Select condition
█ IMPORTANT NOTES
• This indicator is a tool for analysis, not a complete trading system
• Signals are NOT automatic buy/sell recommendations
• Always use proper risk management
• Past performance does not guarantee future results
• Works on all markets and timeframes
• Non-repainting: Signals appear only after bar close confirmation
█ ACKNOWLEDGMENTS
Inspired by institutional order flow concepts and smart money trading methodologies. Built with a focus on reliability and practical application.
Supply and Demand

Supply and Demand Zones [BigBeluga]🔵 OVERVIEW
The Supply and Demand Zones indicator automatically identifies institutional order zones formed by high-volume price movements. It detects aggressive buying or selling events and marks the origin of these moves as demand or supply zones. Untested zones are plotted with thick solid borders, while tested zones become dashed, signaling reduced strength.
🔵 CONCEPTS
Supply Zones: Identified when 3 or more bearish candles form consecutively with above-average volume. The script then searches up to 5 bars back to find the last bullish candle and plots a supply zone from that candle’s low to its low plus ATR.
Demand Zones: Detected when 3 or more bullish candles appear with above-average volume. The script looks up to 5 bars back for a bearish candle and plots a demand zone from its high to its high minus ATR.
Volume Weighting: Each zone displays the cumulative bullish or bearish volume within the move leading to the zone.
Tested Zones: If price re-enters a zone and touches its boundary after being extended for 15 bars, the zone becomes dashed , indicating a potential weakening of that level.
Overlap Logic: Older overlapping zones are removed automatically to keep the chart clean and only show the most relevant supply/demand levels.
Zone Expiry: Zones are also deleted after they’re fully broken by price (i.e., price closes above supply or below demand).
🔵 FEATURES
Auto-detects supply and demand using volume and candle structure.
Extends valid zones to the right side of the chart.
Solid borders for fresh untested zones.
Dashed borders for tested zones (after 15 bars and contact).
Prevents overlapping zones of the same type.
Labels each zone with volume delta collected during zone formation.
Limits to 5 zones of each type for clarity.
Fully customizable supply and demand zone colors.
🔵 HOW TO USE
Use supply zones as potential resistance levels where sell-side pressure could emerge.
Use demand zones as potential support areas where buyers might step in again.
Pay attention to whether a zone is solid (untested) or dashed (tested).
Combine with other confluences like volume spikes, trend direction, or candlestick patterns.
Ideal for swing traders and scalpers identifying key reaction levels.
🔵 CONCLUSION
Supply and Demand Zones is a clean and logic-driven tool that visualizes critical liquidity zones formed by institutional moves. It tracks untested and tested levels, giving traders a visual edge to recognize where price might bounce or reverse due to historical order flow.

Supply & Demand - Trading Vidhyalaya (Free)A powerful script that automatically plots Supply and Demand zones on your chart. Designed to help traders identify potential reversal areas with precision.
Free Version Capabilities:
Works exclusively on the Daily (1D) Timeframe.
Includes Wick & Strong validation logic.
📍 Pinpoint accurate reversals.
🔔 Real-time alerts for Daily zones.
📉 "Touched" zone logic to keep your chart clean.
Want to use this on Intraday Charts? The Premium version supports ALL Timeframes (1m to Monthly) and includes Multi-Timeframe (MTF) overlay capabilities.

Institutional Supply/Demand (Unmitigated)Title: Institutional Supply/Demand (Unmitigated)
What it does: This indicator automatically detects and highlights Fresh Institutional Supply and Demand Zones based on market structure (Swing Highs and Swing Lows). It is designed to keep your chart clean by only showing levels that have not yet been tested.
Key Features:
Auto-Detection:
Red Boxes (Supply): Appear at major Swing Highs. These represent potential Sell Limit orders from institutions.
Green Boxes (Demand): Appear at major Swing Lows. These represent potential Buy Limit orders.
Mitigation Logic (The "Clean-Up"):
The script actively monitors price action.
If price touches a box, the box is instantly deleted.
This ensures you are never looking at "old" or "used" levels. If a box is visible on your chart, it means price has never returned to that level since it was created.
Customizable Structure:
Structure Lookback: Adjusts how sensitive the detection is.
Setting 5 (Default): Finds major, significant structure points.
Setting 3: Finds smaller, internal structure points (more zones).
How to Trade:
Wait for Price to Return: Watch for price to approach a visible Red or Green box.
Reaction: Since these are "Fresh" levels, look for a rejection (wick) or a reversal pattern as soon as price taps the zone.
No Clutter: You don't need to manually delete old lines; the script does it for you.
The Trader's Edge (A professional Trader's tool)This is a script which is made by a professional stock trader and this script is capable of drawing Demand / Supply zones as well as capable of scoring the trade as well depending upon freshness, time spent in the zone, it also has the power to calculate the pre - defined risk to reward for every trade that you take as per this indicator. This script also displays the Trendo f the stock on 3 difrerent time frames on one single time frame easy to do multiple time frame analysis. and it also as the power of identifying which zones are falling outside "THE BOLLINGER BANDS" There by signaling an "ALL STAR ENTRY" This tool is A must have for any professional Stock trader.

Liquidity Mix- Supply and DemandLiquidity Mix highlights developing and confirmed supply/demand zones and optional trade guides with entries, stops, targets, and risk/reward math. Benefits: see high-probability reaction areas early, size positions automatically from your risk input, track reward multiples, and receive optional alerts when price tags zones or entries—all in one overlay.

Hidden Zone Detector AI - Crypto/Forex/StockHidden Zone Detector AI - Crypto Forex Stock
Hidden Zone Detector AI is a professional TradingView indicator designed to find hidden supply and demand zones across markets — crypto, forex and stocks — and surface high-probability areas earlier than classical pivot-only methods. It combines price structure analysis, volatility/ATR sizing, volume profiling and multi-mode AI heuristics (Fast / Balanced / Accurate) to generate prediction zones, highlight tested areas, and visually mark zone breakouts. Built with practical trader workflow in mind: configurable anti-repaint options, adaptable Light/Dark UI, clear labels, and candle-coloring for immediate visual context.
How it works
• Detects hidden zones by scanning pivot formations and finding internal “hidden” bars that represent real institutional activity (not just visible swing points).
• Scores zones by size (ATR-relative), volume, and touch characteristics to produce a strength percentage (Weak/Medium/Strong).
• AI heuristics aggregate price, momentum, moving averages, RSI/MACD signals and volume patterns to propose prediction zones — adjustable for speed vs. accuracy.
• Zones are drawn as persistent boxes with optional midlines, labels, and tailored styling when broken or tested.
Main advantages
• Early edge: finds hidden zones that often act before obvious pivots.
• Actionable visuals: labeled zones, color-coded candles, and breakout styling speed decision-making.
• Flexible AI modes: choose Fast for responsiveness, Balanced for day-to-day use, or Accurate for stricter signals.
• Anti-repaint controls: require confirmed bars for predictions to improve signal reliability.
• Multi-market ready: tuned for crypto, forex and stock chart behavior.
• Light/Dark friendly: UI color handling ensures labels remain readable on any chart background.
• Open & reusable: released under Mozilla Public License 2.0 (MPL-2.0) — use and adapt freely with attribution.
Best practices & tips
• Start with Balanced mode and sensitivity ~5; increase sensitivity for earlier but noisier predictions.
• Use prediction confirmation (Require AI Prediction Confirmation) for lower repaint risk.
• Combine zone reads with higher-timeframe context and orderflow/volume tools for stronger entries.
• Adjust max active zones and opacity to keep charts clean on lower timeframes.
License & author
Mozilla Public License 2.0 (MPL-2.0).
Author: a_jabbaroff — created with care for the TradingView community and fellow traders.

Gold 1&5 Min Trading Strategy [TradingFinder] XAU Scalper Signal🔵 Introduction
Scalping in financial markets is based on immediate price reactions and precise analysis of price action behavior. In this trading approach, the trader must identify signals that originate directly from market structure, momentum shifts, candlestick formations, and the position of price relative to key zones.
Supply and demand areas serve as the primary regions of order concentration and form the foundation of scalping analysis, since they provide the most accurate representation of balance or imbalance between buyers and sellers as well as the active flow of liquidity in the market.
In demand zones, price reactions usually begin with the formation of reversal or continuation candlestick patterns. These patterns include structures such as Pin Bar, Engulfing, Doji, Failure, Rejection, and other forms of false breakout behavior, each of which can indicate a potential short term change in direction.
Liquidity plays a central role in these reactions, because price entering a demand zone typically coincides with the absorption of sell side liquidity and the restoration of order flow. This process often leads to rapid movements that are suitable for scalping. Therefore, combining candlestick confirmation with the location of price inside a supply or demand zone is one of the most reliable methods of identifying low risk scalping signals.
Demand zones include several structural variations, each representing a different form of liquidity behavior. One of the most well known examples is the order block, which is the final bearish candle before a strong bullish movement and indicates the presence of unfilled buy side interest.
Another important structure is the Fair Value Gap, which appears when a price void forms across three consecutive candles due to a lack of liquidity during the moment of displacement. The market often returns to this area to restore balance. Imbalance structures also represent one sided pressure in order flow where the market reacts later to correct these inefficiencies.
Breaker structure is another key element in demand analysis. A breaker is formed when an order block is violated and price returns to the same level after collecting liquidity, then continues in the opposite direction. This pattern often appears near liquidity based highs or lows and reflects a shift in the strength of market participants.
Together, order blocks, Fair Value Gaps, imbalances, and breakers form the core of demand analysis in price action and are widely used in precise scalping strategies due to their strong connection with liquidity and the high predictability of price reactions within them.
Bullish Setup :
Bearish Setup :
🔵 How to Use
This strategy is built on price action analysis, market reactions inside supply and demand zones, and confirmation through candlestick patterns. The first step is to identify key areas such as order blocks, Fair Value Gaps, imbalances, or breakers.
After these zones are located, price behavior within them is examined using candlestick structure and momentum direction. Entries are taken only when price reaches a validated zone, a clear sign of liquidity absorption or injection appears, and a confirming candlestick forms inside the zone.
This approach allows the trader to capture fast and precise entries during moments when the market is actively reacting to decision points.
🟣 Long Setup
In the buy setup, a valid demand zone must first be identified. This can be a bullish order block, an unfilled bullish Fair Value Gap, an imbalance at the lower part of structure, or a bullish breaker. When price enters this zone and shows signs of absorbing sell side liquidity, candlestick behavior must be examined.
Formation of reversal signals such as a Pin Bar with a long lower wick, bullish Engulfing, Rejection Candle, or a false breakout of the low, indicates a favorable shift in order flow. After receiving candlestick confirmation, a buy entry is taken within the same zone and the stop level is placed below the liquidity boundary. Targets are typically based on filling gaps, reaching supply zones, or returning to structural means.
🟣 Short Setup
In the sell setup, a valid supply zone must be recognized. This may include a bearish order block, a bearish Fair Value Gap, an imbalance at the upper part of structure, or a bearish breaker. When price enters this zone and liquidity accumulates above nearby highs, the probability of a fast momentum shift increases.
Confirmation occurs when a bearish reversal pattern forms such as Engulfing, Pin Bar with a long upper wick, indecisive Doji followed by rejection, or a false breakout of the high. After confirmation, the sell entry is placed and the stop level is set above the liquidity zone. Targets are selected based on filling lower Fair Value Gaps, reaching demand zones, or returning to structural midpoints.
🔵 Settings
Last Candle in Signal Direction : When On, a signal is issued only if the last candle moves in the direction required by the signal.
Signal in Nearly Zone : When enabled, the signal becomes valid even if the candle is near the zone rather than strictly inside it. When disabled, only signals formed inside the zone are allowed.
Allow Both Side Signals : When On, signals from both sides of the structure can be issued even if a limiting level exists. When disabled, only signals that do not violate the limiting level are allowed.
🔵 Conclusion
Using price action, supply and demand zones, and candlestick confirmation alongside liquidity analysis creates an effective framework for identifying fast market reactions in scalping conditions. Focusing on structures such as order blocks, Fair Value Gaps, imbalances, and breakers allows the trader to recognize shifts in momentum and changes in order flow with greater precision.
In this approach, entries are taken only when price reaches a validated zone, liquidity behavior is observable, and the confirming candle forms at the correct location. This leads to organized, low risk scalping signals that are aligned with the real time behavior of the market.

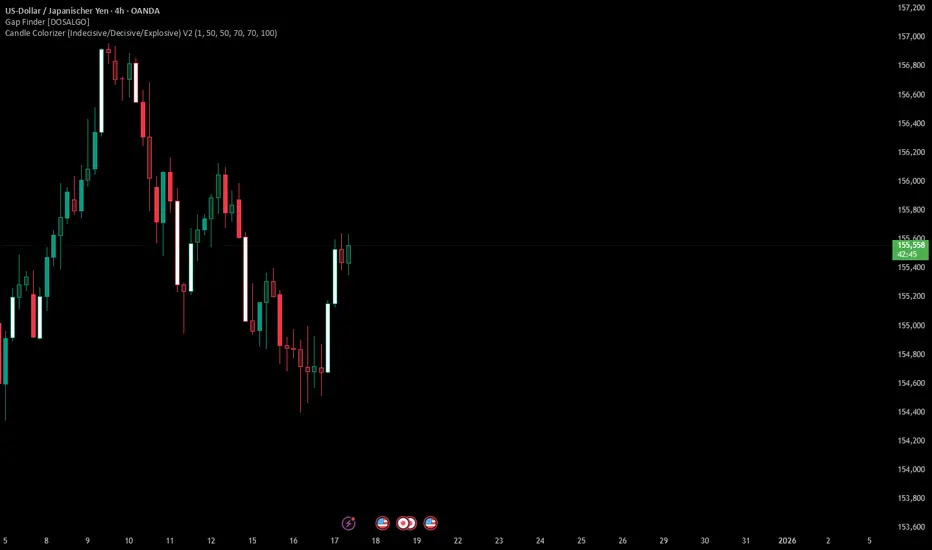
Candle Colorizer (Indecisive/Decisive/Explosive)Classifiaction of candles in indecisive/decisive/explosiv to more quickly identify supply and demand zones
Supply and Demand Scanner Toolkit [TradingFinder]🔵 Introduction
The analytical system presented here is built upon a deep quantitative foundation designed to capture the dynamic behavior of supply and demand in live markets. At its core, it calculates continuously adaptive zones where institutional liquidity, volatility shifts, and momentum transitions converge. These zones are derived from a combination of a regression-based moving average, a long-period ATR, and Fibonacci expansion ratios, all working together to model real-time volatility, price momentum, and the underlying market imbalance.
In practice, this means that at any given moment, five primary bands and seven variable analytical zones are generated around price, representing different market states ranging from extreme overbought to extreme oversold.
Each band reacts dynamically to price volatility, recalibrating with every new candle, which allows the system to mirror the true, constantly changing structure of supply and demand. Every movement between these zones reflects a transition in the strength and dominance of buyers and sellers, a process referred to as volatility-driven price state transitions.
Traditional analytical models often rely on fixed or static indicators that cannot keep up with the rapid microstructural changes in modern markets. This system instead uses regression and smoothing logic to adapt on the fly. By combining a regression moving average with a smoothed moving average, the model calculates real-time trend direction, momentum flow, and trend strength.
When the regression average rises above the smoothed one, the system classifies the trend as bullish; when it falls below, bearish. This dual-layer structure not only helps confirm direction but also enables the automatic detection of critical structural shifts such as Break of Structure (BoS), Change of Character (CHoCH), and directional reversals.
Both the current trend (Live Trend) and projected future trend (Vision Trend) are calculated simultaneously across all available timeframes. This dual analysis allows traders to identify structural changes earlier and to recognize whether a trend is gaining or losing momentum.
In most conventional moving-average-based frameworks, trading signals are delayed because these models react to price rather than anticipate it. As a result, many buy or sell signals appear after the real move has already begun, leading to entries that contradict the current trend. This system eliminates that lag by employing a mean reversion trading model. Instead of waiting for crossovers, it observes how far price deviates from its statistical mean and reacts when that deviation begins to shrink, the moment when equilibrium forces reemerge.
This approach produces non-lagging, data-driven signals that appear at the exact moment price begins to revert toward balance. At the same time, traders can visually assess the market’s condition by observing the spacing, compression, or expansion of the dynamic bands, which represent volatility shifts and trend energy. Through this interaction, the trader can quickly gauge whether a trend is strengthening, losing power, or preparing for a reversal. In other words, the model provides both quantitative precision and intuitive visualization.
A unique visual element in this system is how candles are displayed during transitional states. When Live Trend and Vision Trend contradict each other, for instance, when the current trend is bullish but the projected trend turns bearish, candle bodies automatically appear as hollow.
These hollow candles act as visual alerts for zones of uncertainty or equilibrium between buyers and sellers, often preceding trend reversals, liquidity sweeps, or volatility compression phases. Traders quickly learn to interpret hollow candles as signals to pause, observe, or prepare for potential shifts rather than to act impulsively.
Signal generation in this model occurs when price reverts from extreme zones back toward neutrality. When price exits the strong overbought or strong oversold zones and reenters a milder area, the system produces a reversal signal that aligns with real-time market dynamics. To refine accuracy, these signals are confirmed through several filters, including momentum verification, volatility behavior, and smart money validation. This multi-layered signal logic significantly reduces false entries, helping traders avoid overreactions to temporary liquidity spikes and enhancing performance in volatility-driven markets.
On a broader level, the model supports full multi-timeframe analysis. It can analyze up to twenty symbols simultaneously, across multiple timeframes, to detect directional bias, correlation, and confluence. The result is a holistic map of market structure in real time, showing how each asset aligns or diverges from others and how lower timeframes fit into the macro trend. Variables such as Live Trend, Vision Trend, Directional Strength, and Zone Positioning combine to give a complete structural snapshot at any given moment.
Risk management is handled by an adaptive Trailing Stop Engine that continuously aligns with current volatility and price flow. It integrates pivot mapping with ATR-based calculations to dynamically adjust stop-loss levels as price evolves. The engine offers four adaptive modes, Grip, Flow, Drift, and Glide, each tailored to different levels of market volatility and trader risk tolerance. In visualization, the profit area between entry and stop-loss is shaded light green for long positions and light red for short positions. This design allows immediate recognition of active risk exposure and profit lock-in zones, all in real time.
Altogether, the combination of ATR Volatility Mapping, Fibonacci Band Calibration, Regression-Based Trend Engine, Dynamic Supply and Demand Equilibrium, Conflict Detection through Hollow Candles, Mean Reversion Signal Model, and Adaptive Trailing Stop forms a unified analytical system. It maps the market’s structure, identifies current and future trends, measures the real-time balance of buyers and sellers, and highlights optimal entry and exit points. The final result is higher analytical precision, improved risk control, and a clearer view of the true, data-defined market structure.
🔵 How to Use
Analyzing supply and demand in live financial markets is one of the most complex challenges traders face. Price rarely moves in a straight line; instead, it evolves through phases of expansion, compression, and redistribution. Many traders misinterpret these movements because the zones that appear strong or reactive at first glance often represent nothing more than temporary liquidity redistributions.
These areas, while visually convincing, may lose relevance quickly when volatility increases or when viewed from another timeframe. In high-volatility environments, traditional zone analysis becomes even more unreliable. Price may seem to respect a support or resistance level only to break through it a few candles later. This behavior creates false zones and misleading reversal points.
The key to filtering such movements lies in understanding the context, how volatility, momentum, and structural flow interact across different timeframes. A single timeframe can only tell part of the story. The market’s true structure emerges only when data is synchronized from macro to micro levels.
This is where multi-timeframe correlation becomes essential. Every timeframe offers a different lens through which supply and demand balance can be observed. For example, a trader might see a bullish setup on a 15-minute chart while the 4-hour chart is still showing a strong distribution phase. Without alignment between these layers, trades are easily positioned against the dominant liquidity flow. The model presented here solves this by processing all relevant timeframes simultaneously, allowing traders to see how short-term movements fit within higher-level structures.
Each market phase, whether accumulation, expansion, or reversion, carries a unique volatility fingerprint. The system tracks transitions in volatility regimes, momentum divergence, and structural breakouts to anticipate when a phase change is approaching. For instance, when volatility compresses and ATR readings narrow, it often signals an upcoming breakout or reversal. By monitoring these shifts in real time, the model helps the trader differentiate between liquidity grabs (temporary volatility spikes) and genuine structural changes.
Every supply-demand interaction within this system is adaptive rather than static. The zones continuously recalibrate based on live parameters such as price velocity, momentum distribution, and liquidity displacement. This adaptive structure ensures that the balance between buyers and sellers is represented accurately as market conditions evolve.
In practice, this allows the user to identify early signs of trend exhaustion, potential reversals, and continuation patterns long before traditional indicators would react.
In essence, successful supply and demand analysis requires moving beyond subjective interpretation toward data-driven decision-making.
Manual drawing of zones or relying solely on visual intuition can lead to inconsistent results, especially in fast-changing markets. By combining ATR-driven volatility mapping, mean reversion dynamics, and multi-timeframe alignment, this framework offers a clear, objective, and responsive model of how market forces actually operate. Each decision becomes grounded in measurable context, not assumptions.
The analytical interface is divided into two main sections : the visual chart framework and the scanner data table.
On the chart, five dynamic bands and seven analytical zones appear around price. These are calculated from ATR, regression moving average, and Fibonacci expansion ratios to define whether the market is overbought, oversold, or neutral. Each zone has distinct color coding, allowing traders to recognize the market state instantly without switching tools or indicators.
Price movement within these bands reveals more than just direction, it tells a story of volatility, liquidity flow, and market equilibrium. The upper zones typically indicate exhaustion of buying pressure, while lower zones highlight areas of overselling or potential recovery. The way price reacts near these boundaries can help determine whether a continuation or reversal is likely.
At the heart of the visualization are two layered trend components : Live Trend and Vision Trend.
The Live Trend shows the present market direction based on regression and smoothing logic, while the Vision Trend projects the probable future trajectory by analyzing slope deviation and momentum displacement. When these two align, the trader sees confirmation of market strength. When they diverge, candle bodies turn hollow, a simple yet powerful visual alert signaling hesitation, consolidation, or a possible turning point.
At the bottom of the interface, the Scanner Table organizes all analytical data into a structured display. Each row corresponds to a symbol and timeframe, showing the current Live Trend, Vision Trend, Directional Strength, Zone Position, and Signal Age. This table provides a real-time overview of all assets being tracked, showing which ones are trending, which are in reversal, and which are entering transition zones. By analyzing this table, traders can instantly identify correlation clusters, where multiple assets share the same trend direction, often a sign of broader market sentiment shifts.
The Scanner can simultaneously process multiple timeframes and up to twenty different assets, producing a panoramic market overview. This makes it easy to apply a top-down analytical workflow, starting with higher timeframe alignment, then drilling down into lower levels for execution. Instead of reacting to isolated signals, traders can see where confluence exists across structures and focus only on setups that align with overall market context.
The bands and their color coding make interpretation intuitive even for less experienced users. Darker shades correspond to extreme zones, typically where institutional orders are being absorbed or distributed, while lighter zones mark mild overbought or oversold conditions. When price transitions from an outer extreme zone into a milder region, a signal condition becomes active. At this point, traders can cross-check the event using momentum and volatility filters before acting.
The trailing stop section of the display adds another critical dimension to decision-making. It visualizes stop levels as continuously updating colored lines that follow price movement. These levels are calculated dynamically through pivot mapping and ATR-based sensitivity. The shaded area between the entry point and active stop loss (light green for buys, light red for sells) gives traders immediate insight into how much of the move is currently secured as profit and how much remains exposed. This simple visual cue transforms risk management from a static calculation into a living, responsive process.
All components of this analytical system are fully customizable. Users can adjust signal type, calculation periods, smoothing intensity, and band sensitivity to match their trading style. For example, a scalper might shorten ATR and MA periods to capture rapid fluctuations, while a swing trader might increase them for smoother and more stable readings. Because every element responds to live data, even small adjustments lead to meaningful changes in how the system behaves.
When combined with the scanner’s data table, these features enable a top-down analytical workflow, one where decisions are not made from isolated indicators but from a complete, multi-dimensional understanding of market structure. The result is a system that supports both reactive precision and proactive market awareness.
🟣 Long Signal
A long signal is generated when price begins to rebound from deeply oversold conditions. More precisely, when price enters the strong or extreme oversold zones and then returns into the mild oversold region, the system identifies the start of a mean reversion phase. This transition is not based on subjective interpretation but on mathematical deviation from equilibrium, meaning that selling pressure has been exhausted and liquidity begins to shift toward buyers.
Unlike delayed signals that depend on moving average crossovers or oscillators, this signal appears the moment price starts moving back toward balance. The model’s mean reversion logic detects when volatility contraction and momentum realignment coincide, producing a non-lagging entry condition.
In this situation, traders can visually confirm the setup by observing the spacing and curvature of the lower bands. When the lower volatility bands begin to flatten or curve upward while ATR readings stabilize, it indicates that the market is transitioning from distribution to accumulation.
The strength and quality of each long signal depend on the configuration of trend variables. When both Live Trend and Vision Trend are bullish, the probability of continuation is significantly higher. This alignment suggests that the market’s short-term momentum is supported by long-term structure. On the other hand, when the two trends contradict each other, which the chart highlights with hollow candles, it represents a temporary phase of indecision or conflicting forces.
In these moments, traders are encouraged to monitor volatility compression and observe whether the next few candles confirm a real breakout or revert back to range conditions.
Additional confirmation can be derived from observing the slope of the regression moving average and the magnitude of ATR fluctuations. A steeper upward slope combined with decreasing volatility indicates stronger bullish intent. In contrast, if ATR expands while price remains flat, it signals potential traps or fakeouts driven by short-term liquidity grabs.
Valid long signals often emerge near the end of volatility compression periods or immediately after liquidity sweeps around major lows. These are points where large players typically absorb remaining sell orders before initiating upward movement. Once the long condition triggers, the system automatically calculates the initial stop loss using a combination of recent pivots and ATR range. From that point, the Trailing Stop Engine dynamically adjusts as price rises, maintaining optimal distance from the entry point and locking in profits without restricting trade potential.
For educational context, consider a situation where the market has been trending downward for several sessions, and the ATR value begins to decline, showing that volatility is compressing. As price touches the lower extreme zone and reverses into the mild oversold region while Live Trend starts turning positive, this creates an ideal long condition. A new cycle of expansion often begins right after such compression, and the system captures that early shift automatically.
🟣 Short Signal
A short signal represents the opposite scenario, a point where buying momentum weakens after a strong rally, and price begins to revert downward toward equilibrium. When price exits the strong or extreme overbought zones and moves into the mild overbought region, the model detects the start of a bearish mean reversion phase.
Here too, the signal appears without delay, as it is based on the real-time relationship between price and its volatility boundaries rather than on indicator crossovers.
The system identifies these short conditions when upward momentum shows visible fatigue in the volatility bands. The upper bands start to flatten or turn downward while the regression slope begins to lose angle. This is often accompanied by rising ATR readings, showing an expansion in volatility that reflects distribution rather than continuation.
The quality of the short signal is strongly influenced by the interaction between the two trend layers. When both Live Trend and Vision Trend point downward, the likelihood of sustained bearish continuation increases dramatically. However, if they diverge, candle bodies turn hollow, clearly marking zones of conflict or hesitation. These phases often coincide with the end of a bullish impulse wave and the start of an early correction.
A practical example can illustrate this clearly. Imagine a market that has been trending upward for several days with expanding volatility. When price pushes into the extreme overbought zone and starts pulling back into the mild region, the system interprets it as the first sign of distribution. If at the same time the regression moving average flattens and ATR begins to rise, it strongly suggests that institutional participants are taking profit. The generated short signal allows the trader to position early in anticipation of the downward reversion that follows.
The initial stop loss for short trades is calculated above the most recent pivot high, ensuring logical protection based on the structural context. From there, the Trailing Stop Engine automatically tracks the price movement downward, tightening stops as volatility decreases or expanding them during sharp swings to avoid premature exits.
The engine’s dynamic nature makes it suitable for both aggressive scalpers and patient swing traders. Scalpers can set the trailing sensitivity to “Grip” mode for tighter control, while swing traders can use “Glide” mode to capture larger portions of the trend.
Most short signals form right after volatility expansion or liquidity grabs around major highs, classic exhaustion areas where momentum divergence becomes evident. The combination of visual cues (upper band curvature, hollow candles, ATR spikes) provides traders with multiple layers of confirmation before taking action.
In both long and short scenarios, this analytical system replaces emotional decision-making with structured interpretation. By translating volatility, momentum, and price positioning into clear contextual patterns, it empowers the trader to see where reversals are forming in real time rather than guessing after the move has started.
🔵 Setting
🟣 Logical Setting
Channel Period : The main channel period that defines the base moving average used to calculate the central line of the bands. Higher values create a smoother and longer-term structure, while lower values increase short-term sensitivity and faster reactions.
Channel Coefficient Period : The ATR period used to measure volatility for determining the channel width. Higher values provide greater channel stability and reduce reactions to short-term market noise.
Channel Coefficient : The ATR sensitivity factor that defines the distance of the bands from the central average. A higher coefficient widens the bands and increases the probability of detecting overbought or oversold conditions earlier.
Band Smooth Period : The smoothing period applied to the bands to filter minor price noise. Lower values produce quicker reactions to price changes, while higher values create smoother and more stable lines.
Trend Period : The period used in the regression moving average calculation to identify overall trend direction. Shorter values highlight faster trend shifts, while longer values emphasize broader market trends.
Trend Smooth Period : The smoothing period for the regression trend to reduce volatility and confirm the dominant market direction. This setting helps to better distinguish between corrective and continuation phases.
Signals Gap : The time interval between generated signals to prevent consecutive signal clustering. A higher value strengthens the temporal filter and produces more selective and refined signals.
Bars to Calculate : Defines the number of historical candles used in calculations. Limiting this value optimizes script performance and reduces processing load, especially when multiple symbols or timeframes are analyzed simultaneously. Higher values increase analytical depth by including more historical data, while lower values improve responsiveness and reduce potential lag during live chart updates.
Trailing Stop : Enables or disables the dynamic trailing stop engine. When active, the system automatically adjusts stop loss levels based on live volatility and price structure, maintaining alignment with market flow and trend direction.
Trailing Stop Level : Defines the operational mode of the trailing stop engine with four adaptive styles: Grip, Flow, Drift, and Glide. Grip offers tight stop management for scalping and high precision setups, while Glide allows wider flexibility for swing or long-term trades.
Trailing Stop Noise Filter : Applies an additional filtering layer that smooths minor fluctuations and prevents unnecessary stop adjustments caused by short-term market noise or micro volatility.
🟣 Display Settings
Show Trend on Candles : Displays the current trend direction directly on price candles by applying dynamic color coding. When Live Trend and Vision Trend align bullish, candles appear in green tones, while bearish alignment displays in red. If the two trends conflict, candle bodies turn hollow, marking a Trend Conflict Zone that signals potential indecision or upcoming reversal. This feature provides instant visual confirmation of market direction without the need for external indicators
Table on Chart : Allows users to choose whether the analytical table appears directly over the chart or positioned below it. This gives full control over screen layout based on personal workspace preference and chart design.
Number of Symbols : Controls how many symbols are displayed in the screener table, adjustable from 10 up to 20 in steps of 2. This flexibility helps balance between detailed screening and visual clarity on different screen sizes.
Table Mode : Defines how the screener table is visually arranged.
Basic Mode : Displays all symbols in a single column for vertical readability.
Extended Mode : Arranges symbols side by side in pairs to create a more compact and space-efficient layout.
Table Size : Adjusts the visual scaling of the table. Available options include auto, tiny, small, normal, large, and huge, allowing traders to optimize table visibility based on their screen resolution and preferred chart density.
Table Position : Determines the exact placement of the screener table within the chart interface. Users can select from nine available alignments combining top, middle, and bottom vertically with left, center, and right horizontally.
🟣 Symbol Settings
Each of the 10 available symbol slots includes a full range of adjustable parameters for personalized analysis.
Symbol : Defines or selects the asset to be tracked in the screener, such as XAUUSD, BTCUSD, or EURUSD. This enables multi-asset scanning across different markets including forex, commodities, indices, and crypto.
Timeframe : Sets the specific timeframe for analysis for each selected symbol. Examples include 15 minutes, 1 hour (60), 4 hours (240), or 1 day (1D). This flexibility ensures precise control over how each asset is monitored within the multi-timeframe structure.
🟣 Alert Settings
Alert : Enables alerts for AAS.
Message Frequency : Determines the frequency of alerts. Options include 'All' (every function call), 'Once Per Bar' (first call within the bar), and 'Once Per Bar Close' (final script execution of the real-time bar). Default is 'Once per Bar'.
Show Alert Time by Time Zone : Configures the time zone for alert messages. Default is 'UTC'.
🔵 Conclusion
Understanding financial markets requires more than indicators, it demands a framework that captures the interaction of price, volatility, and structure in real time. This analytical system achieves that by combining mean reversion logic, volatility mapping, and dynamic supply and demand modeling into an adaptive, data-driven environment. Its computational bands and trend layers visualize market intent, showing when momentum is strengthening, fading, or preparing to shift.
Each signal, derived from statistical equilibrium rather than delayed indicators, reflects the exact moment when the balance between buyers and sellers changes. Variables like Live Trend, Vision Trend, Directional Strength, and ATR-based Volatility Context help traders assess signal quality and alignment across multiple timeframes. The system blends automation with human interpretation, preserving macro-to-micro consistency and enabling confident entries, exits, and stop management through its adaptive Trailing Stop Engine.
Every component, from color-coded zones to hollow candles, forms part of a broader narrative that teaches traders to read the market’s language instead of reacting to it. Built on self-correcting analysis, the framework continuously recalibrates with live data. By transforming volatility, liquidity, and price behavior into structured insight, it empowers traders to move from reaction to prediction, a living ecosystem that evolves with both the market and the trader.
Paid script

HTF Supply & Demand Zones 📊 Overview
Advanced supply and demand zone indicator that automatically detects institutional-level price zones on higher timeframes and dynamically adapts zone colors based on price position. Zones below price act as demand (support) and zones above price act as supply (resistance).
✨ Key Features
🎯 Dynamic Zone Recognition
- Smart Color Adaptation: Zones automatically change from demand (green) to supply (red) when price crosses them
- Higher Timeframe Analysis: Detect zones from any timeframe while trading on lower timeframes
- Base/Blast Pattern Detection**: Identifies strong institutional zones using base-blast candle methodology
- Automatic Zone Flipping: Broken demand zones become supply and vice versa
📈 Zone Detection Method
Uses the proven Base & Blast candle pattern:
- Base Candle: Small consolidation candle with minimal wick
- Blast Candle: Strong momentum candle breaking from the base
- Customizable Ratio: Adjust base/blast body size ratio (default 8:1)
- Wick Filter: Ensures clean base candles for higher probability zones
🎨 Visual Features
- Clean Zone Boxes: Extended zones with customizable colors and transparency
- Smart Labels: Display zone type and touch count
- Touch Counter: Track how many times price has tested each zone
- Info Dashboard: Real-time statistics in top-right corner
⚙️ Zone Management
- Auto-Delete After X Touches**: Remove zones after specified number of tests (default: 5)
- Optional Break Deletion**: Choose whether to delete zones when price breaks through
- Maximum Zone Limit**: Control chart cleanliness by limiting displayed zones
- Extended Zones**: All zones extend to the right for forward visibility
🔧 Settings
Detection Parameters
- Higher Timeframe: Select any timeframe for zone detection (empty = current timeframe)
- Base/Blast Ratio: 4.0 to 30.0 (default: 8.0) - Higher = stronger zones, fewer signals
- Wick Threshold: 0.1 to 0.5 (default: 0.3) - Maximum base candle wick size
Display Options
- Toggle demand/supply zones independently
- Maximum zones to display (1-50)
- Show/hide zone labels
- Customizable colors for demand and supply zones
- Adjustable border width
Zone Management
- Delete after X touches (1-30 touches)
- Delete on break option
- Touch counter displays current/max touches
💡 How to Use
For Swing Trading
1. Set timeframe to Daily or Weekly
2. Use 8:1 ratio for high-quality zones
3. Enable auto-delete after 3-5 touches
4. Trade pullbacks to green zones (demand) for longs
5. Trade rallies to red zones (supply) for shorts
For Day Trading
1. Set timeframe to 1H or 4H
2. Use 6:1 ratio for more zones
3. Watch for zone color changes as confirmation
4. Enter when price retests zones in the direction of the higher timeframe trend
For Scalping
1. Set timeframe to 15m or 1H
2. Use 5:1 ratio for frequent signals
3. Focus on first touch of fresh zones
4. Use lower timeframes for precise entries
📋 Best Practices
✅ DO:
- Use zones from higher timeframes for better reliability
- Wait for zone color change as confirmation of flip
- Focus on first 2-3 touches of a zone
- Combine with trend analysis
- Use zones as targets and entry levels
❌ DON'T:
- Trade every zone - quality over quantity
- Ignore the touch counter
- Use on very low timeframes without HTF context
- Trade zones that have been tested many times
🎓 Understanding Dynamic Colors
Green Zones (Demand) = Below current price = Support = Look for bounces
Red Zones (Supply) = Above current price = Resistance = Look for rejections
When price breaks a green zone downward, it flips to red (former support becomes resistance)
When price breaks a red zone upward, it flips to green (former resistance becomes support)
📊 Info Dashboard
The top-right table displays:
- Active timeframe
- Current demand zones count (below price)
- Current supply zones count (above price)
- Active base/blast ratio
- Maximum touches setting
🔔 Trading Signals
High Probability Setups:
- Fresh zones (0-1 touches) on higher timeframes
- Zones that align with major support/resistance
- First test after a zone color flip
- Multiple timeframe confluence
Avoid:
- Zones with 4+ touches
- Zones in choppy/ranging markets
- Counter-trend zones during strong momentum
⚡ Performance Notes
- Maximum 500 boxes and lines supported
- Optimized for real-time scanning
- Minimal resource usage
- No repainting - all zones are confirmed
🎯 Recommended Settings by Trading Style
Conservative (Higher Quality)
- Ratio: 10:1
- Wick Threshold: 0.2
- Delete After: 3 touches
Balanced (Default)
- Ratio: 8:1
- Wick Threshold: 0.3
- Delete After: 5 touches
Aggressive (More Signals)
- Ratio: 6:1
- Wick Threshold: 0.4
- Delete After: 7 touches
---
📖 Additional Resources
For more information on supply and demand trading:
- Study institutional order flow
- Learn base and blast candle patterns
- Understand market structure and liquidity zones
- Practice on demo before live trading
Risk Warning: This indicator is a tool for technical analysis. Always use proper risk management and combine with your trading strategy. Past performance does not guarantee future results.
---
Compatible with all markets: Forex, Stocks, Crypto, Futures, and Indices
Version: 1.0 | Language: Pine Script v5

Demand Supply Zones with MTFDemand Supply Zones with Multi-Timeframe Analysis
Overview:
Advanced institutional demand/supply zone detector with multi-timeframe analysis, proximity alerts, and trend dashboards. Identifies high-probability reversal areas using intelligent base detection and breakout validation across 4 simultaneous timeframes.
Core Unique Features:
• 💎 Elite Base Factor: Auto-detects institutional base patterns using pre-breakout candle body ratio analysis (adjustable 0.1-2.0).
• 🌐 4-Timeframe Zone Detection: Simultaneous MTF zones with individual "👁️ Tested" toggles for granular control - unprecedented in demand/supply indicators.
• 🚨 Proximity Dashboard: Real-time distance tracking to nearest zones (current + all MTF). Visual "APPROACHING!" alerts when price within threshold %.
• 📊 Zone Analytics Dashboard: Live counters for active/tested zones per timeframe with date range display and MTF status tracking.
• 📈 Multi-Timeframe Trend Analysis: 4-TF trend direction
• 🎯 Advanced EMA System: 10 multi-timeframe EMA-20 lines + Golden/Death Cross alerts with customizable styling.
• 📅 Date Range Filter: Performance optimization with calendar-based zone limits (10-500 zones).
• 🧩 Gap Filling: Optional gap bridging between base and leg-out candles for continuous zones.
• 🔐 No Repainting: MTF zones created only on confirmed bars with lookahead bias disabled.
How It Works:
1. Base Detection: Identifies consolidation candles (1-4 consecutive) with customizable body % threshold. Elite mode auto-detects when pre-breakout candle is significantly smaller.
2. Leg-Out Validation: Confirms breakout strength of legout
3. Zone Extension: Projects zones forward (10-500 bars).Fresh zones (green/red) turn gray when tested.
4. MTF Integration: Detects zones from 4 higher timeframes with independent parameters. Each MTF has individual tested zone toggle.
5. Analytics: Proximity dashboard calculates real-time distance to nearest zones. Trend dashboard shows direction across 4 TFs.
Important Notes:
• Educational Purpose: This indicator is for analysis and learning only. Does not guarantee future results.
• Risk Management Required: Always use stop losses and proper position sizing.
• Chart Type: Use standard Candlestick charts. Non-standard charts (Heikin Ashi/Renko) not recommended for accurate zone detection.
• Timeframe Requirements: MTF zones appear only when viewing lower timeframe than selected MTF (e.g., view 1H chart to see Daily MTF zones).
• Performance: Enable Date Range Filter when using multiple MTF timeframes to reduce computational load.
• Past Performance Disclaimer: Historical accuracy does not guarantee future trading results.
⭐ If you find this indicator valuable, please like and share!

SD Demand & Supply IndicatorSD Demand & Supply Indicator automatically identifies and displays demand and supply zones across multiple timeframes.
The indicator detects:
Demand Zones: Drop–Boring–Rally (DBR) and Rally–Boring–Rally (RBR) formations
Supply Zones: Rally–Boring–Drop (RBR) and Drop–Boring–Drop (DBD) formations
When a Demand Zone is detected, it plots a blue Label below the relevant boring candle. When a Supply Zone is detected, it plots a red Label above the relevant boring candle — making it easy to visualize potential reversal areas.
With built-in alert functionality, you can also set alerts on your preferred symbols and timeframes to get instant notifications whenever new Demand or Supply Zones are formed.
How the Script Works?
1. The script scans the price action of three to five consecutive candles to identify potential Demand and Supply patterns based on the open, High, Low and close prices.
2. The script evaluates every candle’s price movement based on set conditions to confirm a valid demand or supply pattern.
3. For demand cases, the script recognizes specific formations such as Drop– Boring –Rally (DBR) and Rally– Boring –Rally (RBR), which indicate potential buying zones.
4. For supply cases, it identifies Rally– Boring –Drop (RBD) and Drop– Boring –Drop (DBD) structures, indicate potential selling zones.
5. When a valid Demand Zone is detected, the script plots a Blue label below the relevant Boring candle.
6. When a valid Supply Zone is found, it plots a Red label above the relevant Boring candle.
7. The script includes an alert feature that notifies users in real-time whenever a valid demand or supply pattern is formed, allowing timely action
How Users can get benefited using this Script?
1. The labels and text plotted by the script help traders visually identify potential entry and exit points.
2. When a valid Demand Zone is detected and the price revisits it, it may indicate a potential bullish reversal.
3. When a valid Supply Zone is detected and the price revisits it, it may indicate a potential bearish reversal.
4. Users can integrate this script with other indicators, fundamental data, or sentiment analysis to confirm signals and make more informed decisions.
5. Traders should use proper risk management strategies, including stop-loss orders to limit losses and targets when the trade moves in their favor.
Settings Explained
1. Boring & Legin Ratio
This is the ratio between the Legin candle and the Boring candle.
A default value of 2 means the Legin candle size (High–Low) is twice the size (High–Low) of the Boring candle.
2. Leg-In & Leg-Out Ratio
This is the ratio of Legin candle and Legout candle.
A default value 2 means the Legout candle size (High-Low) is twice the size (High-Low) of the Legin candle.
3. Leg-In & Three-Leg-Out Ratio
This is the ratio of Legin candle and to the combined size of three Legout candles. A default value 2 means the overall size of the three Legout candles is twice that of the Legin candle.
4. Leg-In Body to Wick Ratio
It is the ratio between the body size of a candle and its total wick length.
A default value of 0.6 means that 60% of the total candle length should be the body.
Zone Selection Filters
1. All Possible Zones
Displays all types of zones, including with or without Clear Area and with or without True Range (TR) vs Average True Range (ATR) criteria
2. All Zones with TR Vs ATR
Shows all zones but with True Range (TR) vs Average True Range (ATR) criteria.
3. Clear Area Zone Only
It will show the Zone with Clear Area and either with or without TR Vs ATR compliance
Clear Area Zone – is considered when the body of the Legout candle does not overlap the Boring candle. In other words, the right side of the Boring candle area remains completely free
4. Clear Area Zone with TR vs ATR Compliance
It will show the Zone with Clear Area and with TR Vs ATR compliance
Note: No. 1 and 2 is suitable for Forex, and crypto market segment
No. 3 and 4 is suitable for commodity and stock market segment
What is TR Vs ATR Criteria?
TR (True Range) vs ATR (Average True Range) criteria is used to validate the strength of a Demand or Supply Zone and it is very important criteria.
For Legin Candle (first candle of the pattern from left) — TR value should be greater than the ATR value.
For Boring Candle (second candle of the pattern from left) — TR value should be smaller than the ATR value.
For Legout Candle (third ,fourth & fifth candle of the pattern from left) — TR value should again be greater than the ATR value,
Important:
Due to the high calculation effort, the history is limited to maximum 10 Zones in total. All zones prior to that will not be displayed so that chart remain clear. Once our indicator has started displaying a Zone, then zone will be visible until it exceeds maximum 10 Zone history. This indicator does not repaint. All signals remain fixed once a candle closes.
What Makes this Indicator Unique?
The Smart Dude Indicator stands out because it doesn’t just mark Demand and Supply Zones — it qualifies them using advanced candle behavior and volatility analysis by using TR Vs ATR analysis .
Unlike typical zone indicators that rely only on price structure, Smart Dude combines candle-to-candle ratio logic with TR vs ATR criteria
Why traders use this indicator?
This strategy is already being used by many experienced traders, including some of my close trading associates. They’ve seen results and even encouraged me to publish it so that more traders can benefit from it. The indicator combines key elements like candle ratio and TR vs ATR criteria, giving users a structured and reliable way to identify zones.
How this Indicator Is Original?
The Smart Dude Indicator is a fully original work — designed and coded from scratch with a unique logic structure.
It is not copied or derived from any existing open-source script.
Key points that make it unique and original:
Exclusive Candle Ratio Logic
TR vs ATR Integration
Clear Area Detection
Fully Hand-Written Logic
Every condition — from candle identification to ratio calculation and plotting — has been manually coded line by line without importing or modifying any existing public logic.
Disclaimer:
This indicator is only for educational purposes and that highlights potential market opportunities. It should not be treated as financial or investment advice.
Trading in financial markets involves risk. The indicator is designed to assist you in making more informed decisions but outcomes depend on your due intelligence and zone validation skills

Khosro XAUUSD Strategy [TradingFinder] Trading Room Hunter Setup🔵 Introduction
The Trading Room Hunter (TRH) strategy is an analytical model based on the Smart Money Concept, developed by Khosro, an Iranian international trader based in Dubai. This approach is built upon a deep understanding of liquidity engineering, market structure shifts, and institutional order flow. Its core objective is to identify the so-called TRH Zone, the area where market liquidity gets trapped and institutional investors begin accumulating positions. Unlike traditional indicator-based methods, the TRH Zone focuses purely on price behavior and supply & demand dynamics to pinpoint the most precise reversal zones in the market.
Within Smart Money logic, every impulsive move in price results from the displacement or absorption of liquidity in a specific range. In the TRH model, the last pivot preceding the impulsive move (Origin Pivot) is defined as the Distal Line, and the Break Candle, which disrupts the market structure, forms the Proximal Line. The area between these two points defines the Trading Room Hunter Zone, a reaction zone where price, after creating a displacement or Break of Structure (BoS), often returns to fill an imbalance and provide a precision entry opportunity.
In essence, the TRH Zone is the region where smart money seeks re-entry after a liquidity sweep and a confirmed CHoCH or BoS. It frequently lies between supply/demand boundaries and fair value gaps (FVGs), forming one of the strongest decision-making frameworks within modern price-action theory. Due to its structural accuracy, the TRH setup can also function as a Set & Forget Setup, where the trader defines the zone, places a limit order, and lets the market naturally react, eliminating emotional decision-making and allowing for automated execution aligned with institutional logic.
🔵 How to Use
In the TRH strategy, entries are taken based on price returning to the area between the last impulsive pivot and the break candle. This range (the TRH Zone) represents the region where liquidity from the previous move remains concentrated. Before continuing its main direction, price often revisits this zone to fill imbalances or mitigate unfilled orders. The logic is simple: every explosive move originates from a point where large orders were executed, and TRH precisely highlights that institutional footprint.
🟣 Bullish Setup
When the market breaks a structural high after a strong bearish leg, liquidity shifts from sellers to buyers. The last bearish candle before the breakout marks the origin of the bullish move, and the zone between that candle and the break candle becomes the smart-money entry area. As price revisits this zone and signs of exhaustion in selling pressure appear, that’s the optimal point for a long position. Stop-loss is placed slightly below the origin pivot, and targets are set at the next supply zone or upper liquidity pool.
🟣 Bearish Setup
Conversely, when the market breaks a structural low after a sharp bullish leg, liquidity transitions from buyers to sellers. The last bullish candle before the drop is identified as the origin pivot, while the bearish break candle defines the lower boundary of the zone. The range between these two points forms the TRH Supply Zone, where late buyers are trapped and fresh institutional selling begins. As price retraces into this zone, short entries can be placed near the upper boundary, with stops above the pivot and targets toward the next liquidity pool below.
Because of its structural precision and clearly defined reaction behavior, TRH is one of the most effective Set & Forget setups in Smart Money trading. Simply mark the zone, place your order, and let the market do the rest.
🔵Setting
🟣 Spike Filter | Movement
Minimum Spike Bars : Defines the minimum number of consecutive candles required for a valid spike.
Movement Power : Enables or disables the momentum-based spike filter.
Movement Power Level : Sets the strength threshold; higher values filter out weaker moves and only detect strong spikes.
Pivot Period : Defines the lookback range used to detect swing highs and swing lows in market structure. A higher value smooths out smaller fluctuations and focuses on major pivots, while a lower value increases sensitivity and identifies minor turning points more frequently.
🟣 Position Management
Stop-Loss Threshold : Enables or disables the stop-loss threshold feature.
Stop-Loss Threshold Value : Defines the value of the stop-loss threshold for risk management.
Risk-Reward Ratio : Sets the desired risk-to-reward ratio (e.g., 1:1 or 1:2).
Wide Zone Filter : Filters out zones that exceed a defined width threshold, preventing detection of overly broad TRH areas.
🟣 Display Settings
Display Mode : Chooses between Setup (showing setups) or Signal (showing trade signals).
Show Entry Levels : Displays entry levels on the chart (buy/sell zones) when enabled
Only Display the Last Position : Displays only the most recent position on the chart when enabled.
Setup Width Drawing : Adjusts the visual width of the setup drawings on the chart for better visibility.
🔵 Conclusion
The TRH strategy is a precise structural model of liquidity flow that identifies zones where smart money is most likely to enter and where price is most likely to react. By combining the Origin Pivot and Break Candle, TRH isolates the key areas that drive institutional order flow. Without relying on indicators, it focuses purely on price structure, making it highly effective for both reactive entries and Set & Forget setups.
Ultimately, TRH creates a balance between market structure and liquidity flow, enabling traders to identify institutional decision zones on the chart with minimal risk and maximum clarity

Orderblocks & BreakersThis indicator identifies potential orderblocks and breakers based on recent swing highs and lows. It is built to offer a structured, customizable, and noise-controlled view of how price interacts with supply and demand levels.
The script applies pivot-based swing detection to identify swing highs and lows.
Bullish Orderblocks: The script Identifies and stores the last down candle before a swing high is breached and confirms and plots the orderblock with a market structure break (close above the swing high).
Bearish Orderblocks: The script Identifies and stores the last up candle before a swing low is breached and confirms and plots the orderblock with a market structure break (close below the swing low).
When price later closes through an existing orderblock, it is reclassified as a Breaker and recolored accordingly. (all colors can be changed in the settings)
What Makes It Different
Unlike most orderblock tools that simply mark every swing-based block, this version introduces:
1. Chop Control – automatically hides breakers that price repeatedly closes through (2 closes after the orderblock becomes a breaker), keeping only relevant zones visible.
2. Recent Block Filtering – limits how many of the recent orderblocks or breakers are displayed, preventing chart clutter.
3. Dynamic Updating – orderblocks automatically convert to breakers when price closes beyond them, with clear color changes.
These features make it easier to study cleaner price structure without manually managing old or invalid zones. The optional Chop Control filter can reduce overlapping or repeatedly invalidated zones to keep the chart clearer.
Customizable Parameters
- Swing detection length (shorter means more aggressive pivot detection, longer means less aggressive so less highs/lows detected)
- Number of recent blocks to display
- Visibility toggles for orderblocks or breakers
- Color and transparency controls for each type
Alerts
Alerts can be set to trigger when price tests any defined zone.
Purpose
This indicator is designed as a price structure visualization and study tool.
It may assist in understanding how price interacts with previously active regions, but it does not produce signals or trade recommendations.

Two-Part Supply & Demand Zones with Role ReversalWill show demand and supply with boxes
Once a zone is used it will be removed to keep the chart clean
Twisted Forex's Doji + Area StrategyTitle
Twisted Forex’s Doji + Area Strategy
Description
What this strategy does
This strategy looks for doji candles forming inside or near supply/demand areas . Areas are built from swing pivots and sized with ATR, then tracked for retests (“confirmations”). When a doji prints close to an area and quality checks pass, the strategy places a trade with the stop beyond the doji and a configurable R:R target.
How areas (zones) are built
• Swings are detected with a user-set pivot length.
• Each swing spawns a horizontal area centered at the pivot price with half-height = zoneHalfATR × ATR .
• Duplicates are de-duplicated by center distance (ATR-scaled).
• Areas fade when broken beyond a buffer or after an optional age (expiry).
• Retests are recorded when price touches and then bounces away from the area; repeated reactions increase the zone’s “strength”.
Signal logic (summary)
Doji detection: strict or loose body criteria with optional minimum wick fractions and ATR-scaled minimum range.
Proximity: price must be inside/near a supply or demand area (proxATR × ATR).
Side resolution: overlap is resolved by (a) which side price penetrates more, (b) fast/slow EMA trend, or (c) nearest distance. Optional “previous candle flip” can bias long after a bearish candle and short after a bullish one.
Optional 1-bar confirmation: the bar after the doji must close away from the area by confirmATR × ATR .
Quality filter (Off/Soft/Strict): four checks—(i) wick rejection past the edge, (ii) doji closes in an edge “band” of the area, (iii) fresh touch (cooldown), (iv) approach impulse over a short lookback. In Strict , thresholds auto-tighten.
Orders & exits
• Long: stop below doji low minus buffer; Short: above doji high plus buffer.
• Target = rrMultiple × risk distance .
• Pyramiding is off by default.
Position sizing
You can size from the script or from Strategy Properties:
• Script-driven (default): set Position sizing = “Risk % of equity” and choose riskPercent (e.g., 1.0%). The script applies safe floors/rounding (FX micro-lots by default) so quantity never rounds to zero.
• Properties-driven : toggle Use TV Properties → Order size ON, then pick “Percent of equity” in Properties (e.g., 1%). The header includes safe defaults so trades still place.
Key inputs to explore
• Zone building : pivotLen, zoneHalfATR, minDepartureATR, expiryBars, breakATR, leftBars, dedupeATR.
• Doji & proximity : strictDoji, dojiBodyFrac, minWickFrac, minRangeATR, proxATR, minBarsBetween.
• Overlap resolution : usePenetration, useTrend (EMA 21/55), “previous candle flip”, needNextBarConf & confirmATR.
• Quality : qualityMode (Off/Soft/Strict), minQualPass/kStrict, wickPenATR, edgeBandFrac, approachLookback, approachMinATR, freshTouchBars.
• Zone strength gating : minStrengthSoft / minStrengthStrict.
• HTF confluence (optional) : useHTFTrend (HTF EMA 34/89) and/or useHTFZoneProx (HTF swing bands).
Tips to make it cleaner / higher quality
• Turn needNextBarConf ON and use confirmATR = 0.10–0.15 .
• Increase approachMinATR (e.g., 0.35–0.45) to require a stronger pre-touch impulse.
• Raise minStrengthSoft/Strict (e.g., 4–6) so only well-reacted zones can signal.
• Use signalsOnlyConfirmed ON if you prefer trades only from zones with retests (the script falls back gracefully when none exist yet).
• Nudge proxATR to 0.5–0.6 to demand tighter proximity to the level.
• Optional: enable useHTFTrend to filter counter-trend setups.
Default settings used in this publication
• Initial capital: 100,000 (illustrative).
• Slippage: 1 tick; Commission: 0% (you can raise commission if you prefer—spread is partly modeled by slippage).
• Sizing: Risk % of equity via inputs; riskPercent = 1.0% ; FX uses micro-lot floors by default.
• Quality: Off by default (Soft/Strict available).
• HTF trend gate: Off by default.
Backtesting notes
For a meaningful sample size, test on liquid symbols/timeframes that yield 100+ trades (e.g., majors on 5–15m over 1–2 years). Backtests are modelled and broker costs/spread vary—validate on your feed and forward-test.
How to read the chart
Shaded bands are supply (above) and demand (below). Brighter bands are the nearest K per side (visual aid). BUY/SELL labels mark entries; colored dots show entry/SL/TP levels. You can hide zones or unconfirmed zones for a cleaner view.
Disclaimer
This is educational material, not financial advice. Trading involves risk. Always test and size responsibly.

Basic Odds Enhancer: Supply Zone for ShortsHow to Use/Adjust:
On your chart, it marks bars where a 20-bar high coincides with high volume and bearish divergence—flag these as supply zones.
Tweak supply_threshold to 2.0 for stricter volume (fewer but stronger signals).
For zones, manually draw rectangles around the flagged area (use Drawing Tools > Rectangle).
Backtest: Apply to historical data (e.g., EUR/USD 4H) and check win rate with shorts on retests.
This setup typically yields 2-5 signals per week on major pairs, depending on volatility. Test on a demo account, and combine with market context (e.g., avoid shorts in strong uptrends).

Odds Enhancer: Volume + RSI DivHow it Works: This flags potential demand zones where price hits a 20-bar low with a volume spike and bullish RSI divergence. Customize for supply zones by flipping logic.

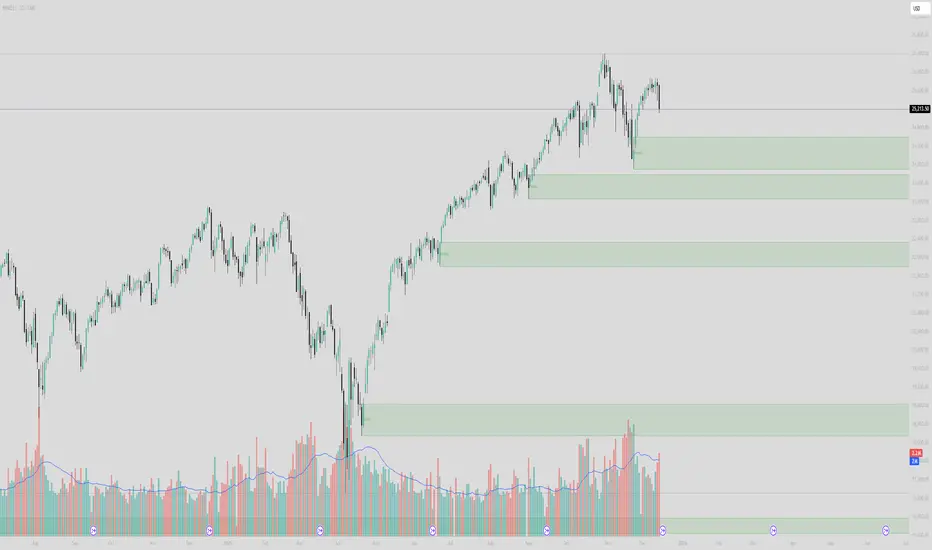
Supply & Demand Limited [DOSALGO]The Supply & Demand Limited indicator is a powerful tool designed to automatically identify and plot significant supply and demand zones on your chart. Based on the core principles of price action, this indicator pinpoints areas where buying or selling pressure has historically been strong enough to cause a substantial shift in the market. By visualizing these key institutional levels, traders can gain a clearer perspective on potential turning points, support/resistance areas, and high-probability trade setups.
This "Limited" version is specifically optimized for higher timeframe analysis and will function exclusively on Daily and Weekly charts, helping traders focus on the most significant market structure.
Key Features
Automatic Zone Detection: The indicator's internal calculation method scans the price action to detect valid supply and demand zones, saving you the time and effort of manual charting.
Identifies Key Patterns: It recognizes classic supply and demand patterns, including Rally-Base-Drop (RBD), Drop-Base-Rally (DBR), and continuation patterns like Rally-Base-Rally (RBR) and Drop-Base-Drop (DBD).
Dynamic Zone Interaction: Zones are not static. The indicator tracks price interaction, changing a zone's color once it has been touched. It can also automatically remove zones that have been significantly penetrated, keeping your chart clean and relevant.
"Level on Level" (LoL) Detection: A unique feature that identifies when new zones form within or overlapping existing ones. These "stacked" zones can often indicate particularly strong areas of confluence.
Built-in Alerts: Never miss an opportunity. Set up custom alerts to notify you the moment a new supply or demand zone is formed or when the price touches an existing zone.
Fully Customizable: Tailor the indicator to your exact trading style with extensive customization options. Adjust everything from the zone definition and colors to the number of zones displayed on your chart.
How to Use This Indicator
The primary goal of this indicator is to highlight potential areas where the market may reverse or pause.
Identify Potential Reversal Points: A supply zone (red) above the current price may act as resistance, presenting a potential area for short entries. A demand zone (green) below the current price may act as support, offering a potential area for long entries.
Confirm with Other Tools: For best results, use these zones in conjunction with your existing trading strategy. Confirm signals with other indicators, trend analysis, or fundamental factors to increase confidence.
Set Stop-Loss and Take-Profit: The boundaries of the zones can serve as logical guides for placing stop-loss orders (e.g., just above a supply zone or just below a demand zone) and for setting profit targets.
Settings Explained
Zone Definition
Show "Level on Level" (LoL) Labels: Toggles the "(LoL)" text on zones that are stacked on top of each other.
Include Continuation Patterns?: Choose whether to display only reversal patterns (RBD, DBR) or also include continuation patterns (RBR, DBD).
Zone Type: Select how zones are drawn.
Wider: Uses the full high/low of the base candles for a larger zone.
Preferred: Uses a more precise calculation to define the zone, often resulting in a tighter, more refined area.
Max Base Candles in Zone: Sets the maximum number of consolidation (base) candles allowed for a valid zone to be formed.
Zone Display & Limits
Limit Supply/Demand Zones: Toggle on or off to limit the number of zones displayed.
Max Supply/Demand Zones: When the limit is on, this sets the maximum number of the most relevant supply or demand zones to show on the chart.
Zone Interaction
Delete Zone on Deep Wick Penetration?: If enabled, the indicator will automatically remove a zone from the chart if the price penetrates it by a significant amount.
Remove Tested Zone %: Defines how much the price must penetrate a zone (as a percentage of the zone's height) to be considered "deep" and trigger its removal.
Colors & Style
Full customization over the colors for fresh and touched supply and demand zones, as well as the appearance of the zone labels.
Alerts
Alert on New Zone Creation?: Enable to receive an alert when a new zone is confirmed.
Alert on Zone Touch?: Enable to receive an alert when the price first enters an existing zone.
Disclaimer: This indicator is a tool for technical analysis and should not be considered financial advice. All trading involves risk. Always conduct your own research and analysis before making any trading decisions. Past performance is not indicative of future results.

Supply Zone & Demand M15Supply Zone & Demand M15
This indicator automatically detects and plots supply and demand zones based on 15-minute pivots and impulse strength.
🔎 Features
Multi-timeframe visibility: Zones are detected on M15 pivots but can be viewed on any lower timeframe (M1, M5, etc.).
Zone validation: Zones appear only after a strong impulsive move, measured against ATR.
Retest counting: Each time price retests a zone, a counter is displayed.
Retests can be merged by time window (No merge, 30 minutes, or 1 hour).
Zone merging: Nearby overlapping zones are automatically combined with a tolerance setting.
Configurable display: Choose between immediate display of zones or only after N retests.
Customizable style: Full control over colors, extension to the left, and max number of zones kept.
⚙️ Settings
Pivot strength: Minimum bars for swing highs/lows.
Impulse filter: Require ATR-based momentum before validating a zone.
Zone width: Defined as a multiple of ATR.
Retest merge: Select None, 30 minutes, or 1 hour.
Invalidation: Option to remove zones once broken.
Display mode: Show zones immediately or only after the required number of retests.
✅ Use Cases
Identify high-probability reversal areas.
Track how many times a zone has been retested.
Spot confluence when historical zones align with current price action.
⚠️ Disclaimer: This indicator is a technical tool, not financial advice. Always combine with proper risk management.

Demand & Supply by DaoEADemand & Supply by DaoEA
This indicator is designed to help traders identify key demand and supply zones, displaying strong price action patterns such as Pin Bar, Engulfing, Hammer, and Shooting Star to confirm reversal points.
Key Features
Automatically identifies Supply & Demand Zones and extends them to the right.
Displays Break of Structure (BOS) when prices break out of these zones.
Tracks Swing Highs/Lows and analyzes HH, HL, LH, and LL.
Highlights strong price action patterns such as Bullish/Bearish Pin Bars, Engulfing, Hammer, and Shooting Star.
Customizable zones, colors, and labels.
Overlay zone protection. To avoid over-cluttering the chart,
Usage
Use with higher timeframes (H1 and above) to identify high demand and supply points.
Switch to smaller timeframes (M15–M30) to identify entry and exit opportunities.
Wait for a strong BOS + PA to confirm the signal.
Suitable for scalpers, swing traders, and Smart Money Concept (SMC) traders who want to clearly understand market structure.

3CRGANG - SUPPLY/DEMAND ZONESOverview
The "3CRGANG - SUPPLY/DEMAND ZONES" indicator is a sophisticated tool designed to identify, classify, and visualize dynamic supply (resistance) and demand (support) zones on your TradingView charts. It goes beyond basic level plotting by incorporating a state-based system that tracks how zones evolve based on price interactions, helping traders anticipate potential reversals, continuations, or breakdowns at key levels. Zones are categorized into states like Untested, Verified, Weak, Flipped, and Broken, providing contextual insights into their strength and reliability. This indicator is particularly useful for swing traders, scalpers, and position traders who rely on price action around institutional levels, as it filters noise and highlights actionable zones with customizable alerts and visual aids.
Built on Pine Script v6, it overlays directly on your chart with semi-transparent boxes for zones, optional labels for quick reference, and alert triggers for zone tests. The invite-only access ensures users benefit from its proprietary enhancements, making it a premium alternative to generic zone indicators.
How It's Built: Core Concepts and Calculations
At its foundation, the indicator detects potential supply and demand zones using a fractal-based pivot detection method, which identifies local highs and lows by comparing a central bar's price to surrounding bars within a validation window. This window is dynamically adjusted via a "Fractal Sensitivity Factor" (default 6.0), which scales the lookback period relative to your chart's timeframe—ensuring zones adapt to market volatility without over- or under-fitting. For example, on a 15-minute chart, this might equate to checking 18-24 bars around a candidate pivot for confirmation.
Once a fractal pivot is confirmed:
Zone Boundaries: The zone is constructed around the pivot high/low, extended by a fraction of the Average True Range (ATR, period 7) using the "Zone Boundary ATR Multiplier" (default 0.3). This creates a band that accounts for typical price fluctuations, preventing overly tight or loose zones. A subtle "Zone Fuzz Factor" (default 0.15) adds a minor buffer to the ATR-derived extension, allowing for fine-tuning in choppy markets without altering the core range.
Merging Overlaps: To avoid clutter, overlapping zones of the same type (or flipped counterparts) are intelligently merged through up to 2-3 passes (configurable via "Max Merge Passes"). This consolidation increases the "test count" for the resulting zone, reflecting cumulative price rejections and enhancing its perceived strength.
Zone Testing and Classification: Price interactions with zones are evaluated using one of two methods:
Dynamic - Bars: Counts tests when price wicks into the zone from outside or closes out after entering, with a minimum gap (0-2 bars) to prevent rapid-fire counts in ranging markets.
Mechanical - Pivots: Enhances the dynamic method by requiring a mechanical pivot (e.g., via TradingView's built-in pivothigh/pivotlow) within the zone during the test, adding a layer of confirmation for more conservative signals. Tests are tallied with a "Weak Zone Test Threshold" (default 1), classifying zones as:
Untested: No interactions yet—fresh levels with high potential.
Weak: 1 or fewer meaningful tests—early signals that may fade.
Verified: Multiple tests (above threshold)—strong, repeatedly respected levels.
Flipped: A broken zone that reverses role (e.g., resistance becomes support), based on a decisive close beyond the boundary.
Broken: Permanently invalidated by a strong breakout, optionally displayed for historical context.
Time and Session Integration: Zones are timestamped and limited to a "Back Limit" (default 500 bars) for performance. It incorporates a custom holiday library (importing from RotemB's LIBRARY_3CRGANG_Holidays_Library) to detect closures across major exchanges (NYSE, LSE, FSE, SSX, TSE, HKSE), adjusting session times for half-days and full holidays. Alerts are filtered by user-selected sessions, weekends, and a "Do Not Disturb" (DND) mode with timezone-aware scheduling (e.g., UTC+3 Jerusalem default, selectable from 90+ global options).
This combination of fractal detection, ATR-based sizing, multi-pass merging, and test-driven state evolution draws from classic supply/demand principles but refines them with proprietary logic to handle real-world market dynamics, such as volatility clustering and institutional session biases.
Why It’s Useful
Supply and demand zones are foundational to price action trading, representing areas where large orders accumulate and cause reversals or pauses. This indicator streamlines the process by automating zone discovery and maintenance, saving time compared to manual drawing. Its state system adds predictive value: Verified zones often signal high-probability bounces, while Flipped ones highlight role reversals for trend continuation trades. Alerts notify you of tests in real-time, ideal for multi-chart monitoring, and session/holiday filters reduce false signals during low-liquidity periods (e.g., no alerts on Christmas for NYSE-linked assets).
Traders benefit from reduced emotional bias—zones "age out" beyond the back limit, focusing on recent action—and customizable visuals prevent chart overload. In volatile markets like forex or crypto, the ATR-adjusted boundaries adapt better than fixed-percentage methods, while the test count helps gauge exhaustion (e.g., over-tested Weak zones may signal impending breaks). Overall, it enhances decision-making by providing not just levels, but their evolving context.
How to Use It
Add to Chart:
Search for "3CRGANG - SUPPLY/DEMAND ZONES" in TradingView's invite-only scripts (access required). Apply to any timeframe from 1-minute to yearly, though it shines on intraday (15M-4H) for active trading.
Configure Inputs:
Test Mode: Choose "Dynamic - Bars" for sensitive, wick-focused testing or "Mechanical - Pivots" for stricter, pivot-confirmed interactions. Adjust "Minimum Test Gap" (0-2) to filter rapid tests and "Weak Zone Test Threshold" (1-3) to define strength tiers.
Pivot Filters: Tune "Fractal Sensitivity Factor" (5-14) for fewer/more zones—higher values for smoother trends, lower for chop.
Zone Width: Set "Zone Boundary ATR Multiplier" (0-1) for tighter/wider bands; use "Zone Fuzz Factor" (0-1) sparingly for boundary tweaks.
Visual: Select zone style (Solid/Dashed/Dotted), linewidth (1-3), and horizontal extension (None/Right/Both). Toggle visibility per state (e.g., hide Broken for cleaner charts).
Labels: Enable "Show Labels" for state/type info; add "Show Zone Size" (in pips/$) and "Show Test Count" for details. Adjust shift for positioning.
Alerts: Enable per state (Untested/Weak/Verified/Flipped). Filter by sessions (e.g., enable NYSE for US equities), holidays, weekends, and DND (set time ranges in your timezone to mute notifications).
Colors: Customize per state/type for intuitive visuals (e.g., red shades for resistance).
Trading Application:
Entries: Buy at Verified Demand (green) tests, sell at Verified Supply (red). Use Flipped zones for breakout confirmation.
Exits/Risk: Place stops beyond zone boundaries; trail profits on Weak/Flipped signals indicating fading strength.
Alerts Setup: In TradingView's alert dialog, select this indicator and configure for "alert() function calls only" to receive zone-test notifications.
Multi-Timeframe: View higher-TF zones on lower charts for confluence (e.g., daily zones on 1H).
Best Practices: Combine with volume or oscillators; backtest on your asset to optimize sensitivity.
Chart Example: XAG/USD (m5 timeframe)
Chart Notes
The chart displays zones on XAGUSD (M5 timeframe), presenting a clear price action structure with three distinct zones. A green Verified Support zone, marked with a translucent green box, indicates a robust demand level that has been tested multiple times and held firm. A blue Weak Support zone, outlined with a lighter blue box, reflects a less-tested support level with fewer rejections, suggesting lower reliability. A gold Flipped Resistance zone, highlighted with a golden box, initially acted as a resistance with rejections before breaking through and retesting as a support zone, showcasing its transition. Labels appear to the right of each zone, displaying details such as "VERIFIED SUPPORT (6.72 points, T=3)" for the Verified zone, "WEAK SUPPORT (6.9 points, T=1)" for the Weak zone, and "FLIPPED SUPPORT (3.85 points, T=10)" for the Flipped zone, with sizes in dollars (or pips if under $1) and test counts included. Zones extend horizontally to the right based on the user-defined shift setting, with customizable dashed or dotted borders for enhanced visual clarity.
Requires 500 bars of history for optimal performance. Alerts are muted during holidays (e.g., Lunar New Year) or Do Not Disturb periods.
Settings
Test Mode: Choose method (Dynamic - Bars or Mechanical - Pivots), set minimum test gap (0-2 bars), and weak zone threshold (1-3 tests).
General: Adjust back limit (250-1000 bars).
Pivot Filters: Set fractal sensitivity factor (5-14) and max merge passes (1-3).
Zone Width: Define ATR multiplier (0-1) and fuzz factor (0-1).
Visual: Select zone style (Solid, Dashed, Dotted), line width (1-3), shift end right (1-50 bars), and extension (None, Right, Both).
Visibility: Toggle display for each state (Untested, Verified, Weak, Flipped, Broken).
Labels: Enable labels, set shift (1-50 bars), size, and show size/test counts.
Alerts: Enable alerts by state (Untested, Weak, Verified, Flipped).
DND Settings: Set timezone, Do Not Disturb hours, and weekend alerts.
Sessions Alerts: Filter alerts by exchange (NYSE, LSE, etc.) and holiday settings.
Colors: Assign colors to each zone state and type.
Why It's Unique and Worth Invite-Only Access
While supply/demand indicators exist, this one stands out through its integrated ecosystem: adaptive fractal pivots with sensitivity scaling, multi-pass overlap merging that preserves test history, and a nuanced state machine that evolves zones based on configurable test mechanics—far beyond simple high/low plotting or basic breakouts. The proprietary blending of ATR fuzzing, retroactive test validation during zone creation, and global exchange holiday/session filtering (with half-day adjustments) minimizes irrelevant alerts, a common pain point in public scripts. It doesn't rely solely on built-ins or educational code; instead, it enhances them with custom logic for zone lifecycle management, making it resilient across assets and timeframes.
This originality justifies its closed-source nature—revealing the full interplay of fractal windowing, merge algorithms, and alert conditioning could dilute its edge. As an invite-only script, it provides clear value through premium features like timezone-aware DND, comprehensive holiday integration (e.g., Lunar New Year for HKSE), and state-aware alerts, which aren't replicated in free alternatives. Traders seeking an efficient, low-noise tool for institutional-level analysis will find it worth the access, as it delivers actionable insights that generic indicators overlook.
Disclaimer
This indicator assists in zone identification but does not guarantee success. Trading involves risk, and past performance is not indicative of future results. Always use proper risk management.
