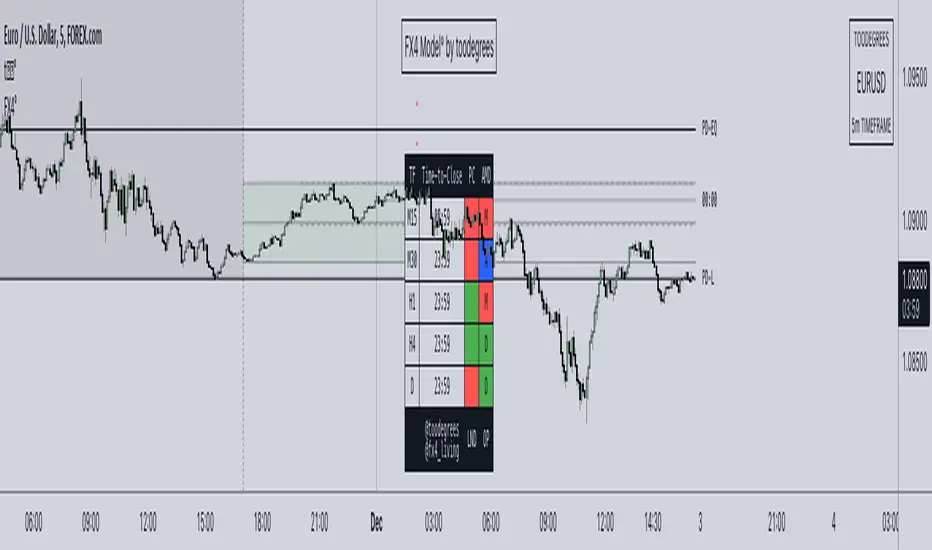
FX4Model° [fx4_living x toodegrees]Introducing the FX4 Model, an advanced automated trading framework designed to optimize your trading positions made by the trader fx4_living. This model integrates the previous day's high and low, and half of that range, to identify premium and discount zones.
The FX4 Model incorporates the ICT Asian range, spanning from 20:00 (New York time) to the midnight open. This period constitutes part of the day's accumulation range, during which a large volume of orders is processed. This implies that the high and low of this range are perceived as crucial liquidity pool zones.
The FX4 Model features a time-based dashboard. This dashboard presents key information such as the close of the previous candle. It also indicates the remaining time before certain significant candle closes (price and time).
With this tool, you gain a robust trading framework that empowers you to capitalize on profitable trading opportunities.
The FX4 accumulation range spans from the previous day's close to 2 AM New York local time. This range is part of the day's accumulation period, during which a lot of orders are triggered. Therefore, the high and the low of this range are seen as vital liquidity pool zones.
The ICT midnight open is marked with a vertical line at 00:00. This refers to the opening price of a financial instrument at midnight New York time. This opening price is significant as it serves as a reference point for trading strategies.
Time-To-Close Dashboard
This outstanding Dashboard displays the Time Frame and its "Time-To-Close".
It shows the Previous Candle Close (Bullish or Bearish).
The Time will appear in Red when there's 5 minutes left before the candle closes.
Previous Day Range (High-Low + 50%)
The previous day's high and low (PD) ranges can be leveraged in your trading strategy for the current day, using them as reference points for potential trading opportunities. The 50% division creates premium and discount zones within the previous day's range. If the price is in the discount zone, you should look for a buy opportunity, whereas if the price is in the premium zone, a sell opportunity should be considered.
FX4 Accumulation Range (High-Low + 50%)
The accumulation range's high and low points provide the most recent liquidity zone for the current day. These points can be used as reference points for potential trading opportunities. The 50% division here also creates premium and discount zones within the accumulation range. If the price is in the discount zone, a buy opportunity should be considered, and if the price is in the premium zone, a sell opportunity should be considered.
Other features:
Automatic Time Zone: As the title suggests, the automatic time zone feature means that you'll never need to adjust any GMT or hour settings. Everything updates automatically, even if you don't live on the East Coast of the United States.
Automatic Dark/Light Mode All graphics will automatically adapt their color based on your background. There's no need to tweak any settings; they're designed to provide consistent visuals.
System
Hobbiecode - RSI + Close previous dayThis is a simple strategy that is working well on SPY but also well performing on Mini Futures SP500. The strategy is composed by the followin rules:
1. If RSI(2) is less than 15, then enter at the close.
2. Exit on close if today’s close is higher than yesterday’s high.
If you backtest it on Mini Futures SP500 you will be able to track data from 1993. It is important to select D1 as timeframe.
Please share any comment or idea below.
Have a good trading,
Ramón.

Adaptive Candlestick Pattern Recognition System█ INTRODUCTION
Nearly three years in the making, intermittently worked on in the few spare hours of weekends and time off, this is a passion project I undertook to flesh out my skills as a computer programmer. This script currently recognizes 85 different candlestick patterns ranging from one to five candles in length. It also performs statistical analysis on those patterns to determine prior performance and changes the coloration of those patterns based on that performance. In searching TradingView's script library for scripts similar to this one, I had found a handful. However, when I reviewed the ones which were open source, I did not see many that truly captured the power of PineScrypt or leveraged the way it works to create efficient and reliable code; one of the main driving factors for releasing this 5,000+ line behemoth open sourced.
Please take the time to review this description and source code to utilize this script to its fullest potential.
█ CONCEPTS
This script covers the following topics: Candlestick Theory, Trend Direction, Higher Timeframes, Price Analysis, Statistic Analysis, and Code Design.
Candlestick Theory - This script focuses solely on the concept of Candlestick Theory: arrangements of candlesticks may form certain patterns that can potentially influence the future price action of assets which experience those patterns. A full list of patterns (grouped by pattern length) will be in its own section of this description. This script contains two modes of operation for identifying candlestick patterns, 'CLASSIC' and 'BREAKOUT'.
CLASSIC: In this mode, candlestick patterns will be identified whenever they appear. The user has a wide variety of inputs to manipulate that can change how certain patterns are identified and even enable alerts to notify themselves when these patterns appear. Each pattern selected to appear will have their Profit or Loss (P/L) calculated starting from the first candle open succeeding the pattern to a candle close specified some number of candles ahead. These P/L calculations are then collected for each pattern, and split among partitions of prior price action of the asset the script is currently applied to (more on that in Higher Timeframes ).
BREAKOUT: In this mode, P/L calculations are held off until a breakout direction has been confirmed. The user may specify the number of candles ahead of a pattern's appearance (from one to five) that a pattern has to confirm a breakout in either an upward or downward direction. A breakout is constituted when there is a candle following the appearance of the pattern that closes above/at the highest high of the pattern, or below/at its lowest low. Only then will percent return calculations be performed for the pattern that's been identified, and these percent returns are broken up not only by the partition they had appeared in but also by the breakout direction itself. Patterns which do not breakout in either direction will be ignored, along with having their labels deleted.
In both of these modes, patterns may be overridden. Overrides occur when a smaller pattern has been detected and ends up becoming one (or more) of the candles of a larger pattern. A key example of this would be the Bearish Engulfing and the Three Outside Down patterns. A Three Outside Down necessitates a Bearish Engulfing as the first two candles in it, while the third candle closes lower. When a pattern is overridden, the return for that pattern will no longer be tracked. Overrides will not occur if the tail end of a larger pattern occurs at the beginning of a smaller pattern (Ex: a Bullish Engulfing occurs on the third candle of a Three Outside Down and the candle immediately following that pattern, the Three Outside Down pattern will not be overridden).
Important Functionality Note: These patterns are only searched for at the most recently closed candle, not on the currently closing candle, which creates an offset of one for this script's execution. (SEE LIMITATIONS)
Trend Direction - Many of the patterns require a trend direction prior to their appearance. Noting TradingView's own publication of candlestick patterns, I utilize a similar method for determining trend direction. Moving Averages are used to determine which trend is currently taking place for candlestick patterns to be sought out. The user has access to two Moving Averages which they may individually modify the following for each: Moving Average type (list of 9), their length, width, source values, and all variables associated with two special Moving Averages (Least Squares and Arnaud Legoux).
There are 3 settings for these Moving Averages, the first two switch between the two Moving Averages, and the third uses both. When using individual Moving Averages, the user may select a 'price point' to compare against the Moving Average (default is close). This price point is compared to the Moving Average at the candles prior to the appearance of candle patterns. Meaning: The close compared to the Moving Average two candles behind determines the trend direction used for Candlestick Analysis of one candle patterns; three candles behind for two candle patterns and so on. If the selected price point is above the Moving Average, then the current trend is an 'uptrend', 'downtrend' otherwise.
The third setting using both Moving Averages will compare the lengths of each, and trend direction is determined by the shorter Moving Average compared to the longer one. If the shorter Moving Average is above the longer, then the current trend is an 'uptrend', 'downtrend' otherwise. If the lengths of the Moving Averages are the same, or both Moving Averages are Symmetrical, then MA1 will be used by default. (SEE LIMITATIONS)
Higher Timeframes - This script employs the use of Higher Timeframes with a few request.security calls. The purpose of these calls is strictly for the partitioning of an asset's chart, splitting the returns of patterns into three separate groups. The four inputs in control of this partitioning split the chart based on: A given resolution to grab values from, the length of time in that resolution, and 'Upper' and 'Lower Limits' which split the trading range provided by that length of time in that resolution that forms three separate groups. The default values for these four inputs will partition the current chart by the yearly high-low range where: the 'Upper' partition is the top 20% of that trading range, the 'Middle' partition is 80% to 33% of the trading range, and the 'Lower' partition covers the trading range within 33% of the yearly low.
Patterns which are identified by this script will have their returns grouped together based on which partition they had appeared in. For example, a Bullish Engulfing which occurs within a third of the yearly low will have its return placed separately from a Bullish Engulfing that occurred within 20% of the yearly high. The idea is that certain patterns may perform better or worse depending on when they had occurred during an asset's trading range.
Price Analysis - Price Analysis is a major part of this script's functionality as it can fundamentally change how patterns are shown to the user. The settings related to Price Analysis include setting the number of candles ahead of a pattern's appearance to determine the return of that pattern. In 'BREAKOUT' mode, an additional setting allows the user to specify where the P/L calculation will begin for a pattern that had appeared and confirmed. (SEE LIMITATIONS)
The calculation for percent returns of patterns is illustrated with the following pseudo-code (CLASSIC mode, this is a simplified version of the actual code):
type patternObj
int ID
int partition
type returnsArray
float returns
// No pattern found = na returned
patternObj TEST_VAL = f_FindPattern()
priorTestVal = TEST_VAL
if not na( priorTestVal )
pnlMatrixRow = priorTestVal.ID
pnlMatrixCol = priorTestVal.partition
matrixReturn = matrix.get(PERCENT_RETURNS, pnlMatrixRow, pnlMatrixCol)
percentReturn = ( (close - open ) / open ) * 100%
array.push(matrixReturn.returns, percentReturn)
Statistic Analysis - This script uses Pine's built-in array functions to conduct the Statistic Analysis for patterns. When a pattern is found and its P/L calculation is complete, its return is added to a 'Return Array' User-Defined-Type that contains numerous fields which retain information on a pattern's prior performance. The actual UDT is as follows:
type returnArray
float returns = na
int size = 0
float avg = 0
float median = 0
float stdDev = 0
int polarities = na
All values within this UDT will be updated when a return is added to it (some based on user input). The array.avg , array.median and array.stdev will be ran and saved into their respective fields after a return is placed in the 'returns' array. The 'polarities' integer array is what will be changed based on user input. The user specifies two different percentages that declare 'Positive' and 'Negative' returns for patterns. When a pattern returns above, below, or in between these two values, different indices of this array will be incremented to reflect the kind of return that pattern had just experienced.
These values (plus the full name, partition the pattern occurred in, and a 95% confidence interval of expected returns) will be displayed to the user on the tooltip of the labels that identify patterns. Simply scroll over the pattern label to view each of these values.
Code Design - Overall this script is as much of an art piece as it is functional. Its design features numerous depictions of ASCII Art that illustrate what is being attempted by the functions that identify patterns, and an incalculable amount of time was spent rewriting portions of code to improve its efficiency. Admittedly, this final version is nearly 1,000 lines shorter than a previous version (one which took nearly 30 seconds after compilation to run, and didn't do nearly half of what this version does). The use of UDTs, especially the 'patternObj' one crafted and redesigned from the Hikkake Hunter 2.0 I published last month, played a significant role in making this script run efficiently. There is a slight rigidity in some of this code mainly around pattern IDs which are responsible for displaying the abbreviation for patterns (as well as the full names under the tooltips, and the matrix row position for holding returns), as each is hard-coded to correspond to that pattern.
However, one thing I would like to mention is the extensive use of global variables for pattern detection. Many scripts I had looked over for ideas on how to identify candlestick patterns had the same idea; break the pattern into a set of logical 'true/false' statements derived from historically referencing candle OHLC values. Some scripts which identified upwards of 20 to 30 patterns would reference Pine's built-in OHLC values for each pattern individually, potentially requesting information from TradingView's servers numerous times that could easily be saved into a variable for re-use and only requested once per candle (what this script does).
█ FEATURES
This script features a massive amount of switches, options, floating point values, detection settings, and methods for identifying/tailoring pattern appearances. All modifiable inputs for patterns are grouped together based on the number of candles they contain. Other inputs (like those for statistics settings and coloration) are grouped separately and presented in a way I believe makes the most sense.
Not mentioned above is the coloration settings. One of the aims of this script was to make patterns visually signify their behavior to the user when they are identified. Each pattern has its own collection of returns which are analyzed and compared to the inputs of the user. The user may choose the colors for bullish, neutral, and bearish patterns. They may also choose the minimum number of patterns needed to occur before assigning a color to that pattern based on its behavior; a color for patterns that have not met this minimum number of occurrences yet, and a color for patterns that are still processing in BREAKOUT mode.
There are also an additional three settings which alter the color scheme for patterns: Statistic Point-of-Reference, Adaptive coloring, and Hard Limiting. The Statistic Point-of-Reference decides which value (average or median) will be compared against the 'Negative' and 'Positive Return Tolerance'(s) to guide the coloration of the patterns (or for Adaptive Coloring, the generation of a color gradient).
Adaptive Coloring will have this script produce a gradient that patterns will be colored along. The more bullish or bearish a pattern is, the further along the gradient those patterns will be colored starting from the 'Neutral' color (hard lined at the value of 0%: values above this will be colored bullish, bearish otherwise). When Adaptive Coloring is enabled, this script will request the highest and lowest values (these being the Statistic Point-of-Reference) from the matrix containing all returns and rewrite global variables tied to the negative and positive return tolerances. This means that all patterns identified will be compared with each other to determine bullish/bearishness in Adaptive Coloring.
Hard Limiting will prevent these global variables from being rewritten, so patterns whose Statistic Point-of-Reference exceed the return tolerances will be fully colored the bullish or bearish colors instead of a generated gradient color. (SEE LIMITATIONS)
Apart from the Candle Detection Modes (CLASSIC and BREAKOUT), there's an additional two inputs which modify how this script behaves grouped under a "MASTER DETECTION SETTINGS" tab. These two "Pattern Detection Settings" are 'SWITCHBOARD' and 'TARGET MODE'.
SWITCHBOARD: Every single pattern has a switch that is associated with its detection. When a switch is enabled, the code which searches for that pattern will be run. With the Pattern Detection Setting set to this, all patterns that have their switches enabled will be sought out and shown.
TARGET MODE: There is an additional setting which operates on top of 'SWITCHBOARD' that singles out an individual pattern the user specifies through a drop down list. The names of every pattern recognized by this script will be present along with an identifier that shows the number of candles in that pattern (Ex: " (# candles)"). All patterns enabled in the switchboard will still have their returns measured, but only the pattern selected from the "Target Pattern" list will be shown. (SEE LIMITATIONS)
The vast majority of other features are held in the one, two, and three candle pattern sections.
For one-candle patterns, there are:
3 — Settings related to defining 'Tall' candles:
The number of candles to sample for previous candle-size averages.
The type of comparison done for 'Tall' Candles: Settings are 'RANGE' and 'BODY'.
The 'Tolerance' for tall candles, specifying what percent of the 'average' size candles must exceed to be considered 'Tall'.
When 'Tall Candle Setting' is set to RANGE, the high-low ranges are what the current candle range will be compared against to determine if a candle is 'Tall'. Otherwise the candle bodies (absolute value of the close - open) will be compared instead. (SEE LIMITATIONS)
Hammer Tolerance - How large a 'discarded wick' may be before it disqualifies a candle from being a 'Hammer'.
Discarded wicks are compared to the size of the Hammer's candle body and are dependent upon the body's center position. Hammer bodies closer to the high of the candle will have the upper wick used as its 'discarded wick', otherwise the lower wick is used.
9 — Doji Settings, some pulled from an old Doji Hunter I made a while back:
Doji Tolerance - How large the body of a candle may be compared to the range to be considered a 'Doji'.
Ignore N/S Dojis - Turns off Trend Direction for non-special Dojis.
GS/DF Doji Settings - 2 Inputs that enable and specify how large wicks that typically disqualify Dojis from being 'Gravestone' or 'Dragonfly' Dojis may be.
4 Settings related to 'Long Wick Doji' candles detailed below.
A Tolerance for 'Rickshaw Man' Dojis specifying how close the center of the body must be to the range to be valid.
The 4 settings the user may modify for 'Long Legged' Dojis are: A Sample Base for determining the previous average of wicks, a Sample Length specifying how far back to look for these averages, a Behavior Setting to define how 'Long Legged' Dojis are recognized, and a tolerance to specify how large in comparison to the prior wicks a Doji's wicks must be to be considered 'Long Legged'.
The 'Sample Base' list has two settings:
RANGE: The wicks of prior candles are compared to their candle ranges and the 'wick averages' will be what the average percent of ranges were in the sample.
WICKS: The size of the wicks themselves are averaged and returned for comparing against the current wicks of a Doji.
The 'Behavior' list has three settings:
ONE: Only one wick length needs to exceed the average by the tolerance for a Doji to be considered 'Long Legged'.
BOTH: Both wick lengths need to exceed the average of the tolerance of their respective wicks (upper wicks are compared to upper wicks, lower wicks compared to lower) to be considered 'Long Legged'.
AVG: Both wicks and the averages of the previous wicks are added together, divided by two, and compared. If the 'average' of the current wicks exceeds this combined average of prior wicks by the tolerance, then this would constitute a valid 'Long Legged' Doji. (For Dojis in general - SEE LIMITATIONS)
The final input is one related to candle patterns which require a Marubozu candle in them. The two settings for this input are 'INCLUSIVE' and 'EXCLUSIVE'. If INCLUSIVE is selected, any opening/closing variant of Marubozu candles will be allowed in the patterns that require them.
For two-candle patterns, there are:
2 — Settings which define 'Engulfing' parameters:
Engulfing Setting - Two options, RANGE or BODY which sets up how one candle may 'engulf' the previous.
Inclusive Engulfing - Boolean which enables if 'engulfing' candles can be equal to the values needed to 'engulf' the prior candle.
For the 'Engulfing Setting':
RANGE: If the second candle's high-low range completely covers the high-low range of the prior candle, this is recognized as 'engulfing'.
BODY: If the second candle's open-close completely covers the open-close of the previous candle, this is recognized as 'engulfing'. (SEE LIMITATIONS)
4 — Booleans specifying different settings for a few patterns:
One which allows for 'opens within body' patterns to let the second candle's open/close values match the prior candles' open/close.
One which forces 'Kicking' patterns to have a gap if the Marubozu setting is set to 'INCLUSIVE'.
And Two which dictate if the individual candles in 'Stomach' patterns need to be 'Tall'.
8 — Floating point values which affect 11 different patterns:
One which determines the distance the close of the first candle in a 'Hammer Inverted' pattern must be to the low to be considered valid.
One which affects how close the opens/closes need to be for all 'Lines' patterns (Bull/Bear Meeting/Separating Lines).
One that allows some leeway with the 'Matching Low' pattern (gives a small range the second candle close may be within instead of needing to match the previous close).
Three tolerances for On Neck/In Neck patterns (2 and 1 respectively).
A tolerance for the Thrusting pattern which give a range the close the second candle may be between the midpoint and close of the first to be considered 'valid'.
A tolerance for the two Tweezers patterns that specifies how close the highs and lows of the patterns need to be to each other to be 'valid'.
The first On Neck tolerance specifies how large the lower wick of the first candle may be (as a % of that candle's range) before the pattern is invalidated. The second tolerance specifies how far up the lower wick to the close the second candle's close may be for this pattern. The third tolerance for the In Neck pattern determines how far into the body of the first candle the second may close to be 'valid'.
For the remaining patterns (3, 4, and 5 candles), there are:
3 — Settings for the Deliberation pattern:
A boolean which forces the open of the third candle to gap above the close of the second.
A tolerance which changes the proximity of the third candle's open to the second candle's close in this pattern.
A tolerance that sets the maximum size the third candle may be compared to the average of the first two candles.
One boolean value for the Two Crows patterns (standard and Upside Gapping) that forces the first two candles in the patterns to completely gap if disabled (candle 1's close < candle 2's low).
10 — Floating point values for the remaining patterns:
One tolerance for defining how much the size of each candle in the Identical Black Crows pattern may deviate from the average of themselves to be considered valid.
One tolerance for setting how close the opens/closes of certain three candle patterns may be to each other's opens/closes.*
Three floating point values that affect the Three Stars in the South pattern.
One tolerance for the Side-by-Side patterns - looks at the second and third candle closes.
One tolerance for the Stick Sandwich pattern - looks at the first and third candle closes.
A floating value that sizes the Concealing Baby Swallow pattern's 3rd candle wick.
Two values for the Ladder Bottom pattern which define a range that the third candle's wick size may be.
* This affects the Three Black Crows (non-identical) and Three White Soldiers patterns, each require the opens and closes of every candle to be near each other.
The first tolerance of the Three Stars in the South pattern affects the first candle body's center position, and defines where it must be above to be considered valid. The second tolerance specifies how close the second candle must be to this same position, as well as the deviation the ratio the candle body to its range may be in comparison to the first candle. The third restricts how large the second candle range may be in comparison to the first (prevents this pattern from being recognized if the second candle is similar to the first but larger).
The last two floating point values define upper and lower limits to the wick size of a Ladder Bottom's fourth candle to be considered valid.
█ HOW TO USE
While there are many moving parts to this script, I attempted to set the default values with what I believed may help identify the most patterns within reasonable definitions. When this script is applied to a chart, the Candle Detection Mode (along with the BREAKOUT settings) and all candle switches must be confirmed before patterns are displayed. All switches are on by default, so this gives the user an opportunity to pick which patterns to identify first before playing around in the settings.
All of the settings/inputs described above are meant for experimentation. I encourage the user to tweak these values at will to find which set ups work best for whichever charts they decide to apply these patterns to.
Refer to the patterns themselves during experimentation. The statistic information provided on the tooltips of the patterns are meant to help guide input decisions. The breadth of candlestick theory is deep, and this was an attempt at capturing what I could in its sea of information.
█ LIMITATIONS
DISCLAIMER: While it may seem a bit paradoxical that this script aims to use past performance to potentially measure future results, past performance is not indicative of future results . Markets are highly adaptive and often unpredictable. This script is meant as an informational tool to show how patterns may behave. There is no guarantee that confidence intervals (or any other metric measured with this script) are accurate to the performance of patterns; caution must be exercised with all patterns identified regardless of how much information regarding prior performance is available.
Candlestick Theory - In the name, Candlestick Theory is a theory , and all theories come with their own limits. Some patterns identified by this script may be completely useless/unprofitable/unpredictable regardless of whatever combination of settings are used to identify them. However, if I truly believed this theory had no merit, this script would not exist. It is important to understand that this is a tool meant to be utilized with an array of others to procure positive (or negative, looking at you, short sellers ) results when navigating the complex world of finance.
To address the functionality note however, this script has an offset of 1 by default. Patterns will not be identified on the currently closing candle, only on the candle which has most recently closed. Attempting to have this script do both (offset by one or identify on close) lead to more trouble than it was worth. I personally just want users to be aware that patterns will not be identified immediately when they appear.
Trend Direction - Moving Averages - There is a small quirk with how MA settings will be adjusted if the user inputs two moving averages of the same length when the "MA Setting" is set to 'BOTH'. If Moving Averages have the same length, this script will default to only using MA 1 regardless of if the types of Moving Averages are different . I will experiment in the future to alleviate/reduce this restriction.
Price Analysis - BREAKOUT mode - With how identifying patterns with a look-ahead confirmation works, the percent returns for patterns that break out in either direction will be calculated on the same candle regardless of if P/L Offset is set to 'FROM CONFIRMATION' or 'FROM APPEARANCE'. This same issue is present in the Hikkake Hunter script mentioned earlier. This does not mean the P/L calculations are incorrect , the offset for the calculation is set by the number of candles required to confirm the pattern if 'FROM APPEARANCE' is selected. It just means that these two different P/L calculations will complete at the same time independent of the setting that's been selected.
Adaptive Coloring/Hard Limiting - Hard Limiting is only used with Adaptive Coloring and has no effect outside of it. If Hard Limiting is used, it is recommended to increase the 'Positive' and 'Negative' return tolerance values as a pattern's bullish/bearishness may be disproportionately represented with the gradient generated under a hard limit.
TARGET MODE - This mode will break rules regarding patterns that are overridden on purpose. If a pattern selected in TARGET mode would have otherwise been absorbed by a larger pattern, it will have that pattern's percent return calculated; potentially leading to duplicate returns being included in the matrix of all returns recognized by this script.
'Tall' Candle Setting - This is a wide-reaching setting, as approximately 30 different patterns or so rely on defining 'Tall' candles. Changing how 'Tall' candles are defined whether by the tolerance value those candles need to exceed or by the values of the candle used for the baseline comparison (RANGE/BODY) can wildly affect how this script functions under certain conditions. Refer to the tooltip of these settings for more information on which specific patterns are affected by this.
Doji Settings - There are roughly 10 or so two to three candle patterns which have Dojis as a part of them. If all Dojis are disabled, it will prevent some of these larger patterns from being recognized. This is a dependency issue that I may address in the future.
'Engulfing' Setting - Functionally, the two 'Engulfing' settings are quite different. Because of this, the 'RANGE' setting may cause certain patterns that would otherwise be valid under textbook and online references/definitions to not be recognized as such (like the Upside Gap Two Crows or Three Outside down).
█ PATTERN LIST
This script recognizes 85 patterns upon initial release. I am open to adding additional patterns to it in the future and any comments/suggestions are appreciated. It recognizes:
15 — 1 Candle Patterns
4 Hammer type patterns: Regular Hammer, Takuri Line, Shooting Star, and Hanging Man
9 Doji Candles: Regular Dojis, Northern/Southern Dojis, Gravestone/Dragonfly Dojis, Gapping Up/Down Dojis, and Long-Legged/Rickshaw Man Dojis
White/Black Long Days
32 — 2 Candle Patterns
4 Engulfing type patterns: Bullish/Bearish Engulfing and Last Engulfing Top/Bottom
Dark Cloud Cover
Bullish/Bearish Doji Star patterns
Hammer Inverted
Bullish/Bearish Haramis + Cross variants
Homing Pigeon
Bullish/Bearish Kicking
4 Lines type patterns: Bullish/Bearish Meeting/Separating Lines
Matching Low
On/In Neck patterns
Piercing pattern
Shooting Star (2 Lines)
Above/Below Stomach patterns
Thrusting
Tweezers Top/Bottom patterns
Two Black Gapping
Rising/Falling Window patterns
29 — 3 Candle Patterns
Bullish/Bearish Abandoned Baby patterns
Advance Block
Collapsing Doji Star
Deliberation
Upside/Downside Gap Three Methods patterns
Three Inside/Outside Up/Down patterns (4 total)
Bullish/Bearish Side-by-Side patterns
Morning/Evening Star patterns + Doji variants
Stick Sandwich
Downside/Upside Tasuki Gap patterns
Three Black Crows + Identical variation
Three White Soldiers
Three Stars in the South
Bullish/Bearish Tri-Star patterns
Two Crows + Upside Gap variant
Unique Three River Bottom
3 — 4 Candle Patterns
Concealing Baby Swallow
Bullish/Bearish Three Line Strike patterns
6 — 5 Candle Patterns
Bullish/Bearish Breakaway patterns
Ladder Bottom
Mat Hold
Rising/Falling Three Methods patterns
█ WORKS CITED
Because of the amount of time needed to complete this script, I am unable to provide exact dates for when some of these references were used. I will also not provide every single reference, as citing a reference for each individual pattern and the place it was reviewed would lead to a bibliography larger than this script and its description combined. There were five major resources I used when building this script, one book, two websites (for various different reasons including patterns, moving averages, and various other articles of information), various scripts from TradingView's public library (including TradingView's own source code for *all* candle patterns ), and PineScrypt's reference manual.
Bulkowski, Thomas N. Encyclopedia of Candlestick Patterns . Hoboken, New Jersey: John Wiley & Sons Inc., 2008. E-book (google books).
Various. Numerous webpages. CandleScanner . 2023. online. Accessed 2020 - 2023.
Various. Numerous webpages. Investopedia . 2023. online. Accessed 2020 - 2023.
█ AKNOWLEDGEMENTS
I want to take the time here to thank all of my friends and family, both online and in real life, for the support they've given me over the last few years in this endeavor. My pets who tried their hardest to keep me from completing it. And work for the grit to continue pushing through until this script's completion.
This belongs to me just as much as it does anyone else. Whether you are an institutional trader, gold bug hedging against the dollar, retail ape who got in on a squeeze, or just parents trying to grow their retirement/save for the kids. This belongs to everyone.
Private Beta for new features to be tested can be found here .
Vires In Numeris

*Backtesting System ⚉ OVERVIEW ⚉
One of the best Systems for Backtesting your Strategies.
Incredibly flexible, simple, fast and feature-rich system — will solve most of your queries without much effort.
Many systems for setting StopLoss, TakeProfit, Risk Management and advanced Filters.
All you need to do is plug in your indicator and start Backtesting .
I intentionally left the option to use my System on Full Power before you load your indicator into it.
The system uses the built-in simple and popular moving average crossover signal for this purpose. (EMA 50 & 200).
Also Highly Recommend that you Fully use ALL of the features of this system so that you understand how they work before you ask questions.
Also tried to leave TIPS for each feature everywhere, read Tips, activate them and see how they work.
But before you use this system, I Recommend you to read the following description in Full.
—————— How to connect your indicator in 2 steps:
Adapt your indicator by adding only 2 lines of code and then connect it to this Backtesting System.
Step 1 — Create your connector, For doing so:
• 1 — Find or create in your indicator where are the conditions printing the Long-Buy and Short-Sell signals.
• 2 — Create an additional plot as below
I'm giving an example with a Two moving averages cross.
Please replicate the same methodology for your indicator wether it's a MACD, RSI , Pivots, or whatever indicator with Clear Buy and Sell conditions.
//@version=5
indicator('Moving Average Cross', overlay = true)
MA200 = ta.𝚎𝚖𝚊(close, 200)
MA50 = ta.𝚎𝚖𝚊(close, 50)
// Generate Buy and Sell conditions
buy = ta.crossover (MA200, MA50)
sell = ta.crossunder (MA200, MA50)
plot(MA200, color=color.green)
plot(MA50 , color=color.red )
bgcolor(color = buy ? color.green : sell ? color.red : na, title='SIGNALS')
// ———————————————— SIGNAL FOR SYSTEM ————————————————
Signal = buy ? +1 : sell ? -1 : 0
plot(Signal, title='🔌Connector🔌', display = display.none)
// —————— 🔥 The Backtesting System expects the value to be exactly +1 for the 𝚋𝚞𝚕𝚕𝚒𝚜𝚑 signal, and -1 for the 𝚋𝚎𝚊𝚛𝚒𝚜𝚑 signal
Basically, I identified my Buy & Sell conditions in the code and added this at the bottom of my indicator code
Now you can connect your indicator to the Backtesting System using the Step 2
Step 2 — Connect the connector
• 1 — Add your updated indicator to a TradingView chart and Add the Backtesting System as well to the SAME chart
• 2 — Open the Backtesting System settings and in the External Source field select your 🔌Connector🔌 (which comes from your indicator)
_______________________________
⚉ MAIN SETTINGS ⚉
‾‾‾‾‾‾‾‾‾‾‾‾‾‾‾‾‾‾‾‾‾‾‾‾‾‾‾‾‾‾‾
𝐄𝐱𝐭𝐞𝐫𝐧𝐚𝐥 𝐒𝐨𝐮𝐫𝐜𝐞 — Select your indicator. Add your indicator by following the 2 steps described above and select it in the menu. To familiarize yourself with the system until you select your indicator, you will have an in-built strategy of crossing the two moving EMA's of 50 and 200.
Long Deals — Enable/Disable Long Deals.
Short Deals — Enable/Disable Short Deals.
Wait End Deal — Enable/Disable waiting for a trade to close at Stop Loss/Take Profit. Until the trade closes on the Stop Loss or Take Profit, no new trade will open.
Reverse Deals — To force the opening of a trade in the opposite direction.
ReEntry Deal — Automatically open the same new deal after the deal is closed.
ReOpen Deal — Reopen the trade if the same signal is received. For example, if you are already in the long and a new signal is received in the long, the trade will reopen. * Does not work if Wait End Deal is enabled.
𝐓𝐚𝐤𝐞 𝐏𝐫𝐨𝐟𝐢𝐭:
None — Disables take profit. Useful if you only want to use dynamic stoplosses such as MA, Fast-Trailing, ATR Trail.
FIXED % — Fixed take profit in percent.
FIXED $ — Fixed Take in Money.
ATR — Fixed Take based on ATR.
R:R — Fixed Take based on the size of your stop loss. For example, if your stop is 10% and R:R=1, then the Take would be 10%. R:R=3 Take would be 30%, etc.
HH / LL — Fixed Take based on the previous maximum/minimum (extremum).
𝐒𝐭𝐨𝐩 𝐋𝐨𝐬𝐬:
None — Disables Stop Loss. Useful if you want to work without a stop loss. *Be careful if Wait End Deal is enabled, the trade may not close for a long time until it reaches the Take.
FIXED % — Fixed Stop in percent.
FIXED $ — Fixed Stop in Money.
TRAILING — Dynamic Trailing Stop like on the stock exchanges.
FAST TRAIL — Dynamic Fast Trailing Stop moves immediately in profit and stays in place if the price stands still or the price moves in loss.
ATR — Fixed Stop based on the ATR.
ATR TRAIL — Dynamic Trailing Stop based on the ATR.
LO / HI — A Fixed Stop based on the last Maximum/Minimum extemum. Allows you to place a stop just behind or above the low/high candle.
MA — Dynamic Stop based on selected Moving Average. * You will have 8 types of MA (EMA, SMA, HMA, etc.) to choose from, but you can easily add dozens of other MAs, which makes this type of stop incredibly flexible.
Add % — If true, then with the "𝗦𝘁𝗼𝗽 %" parameter you can add percentages to any of the current SL. Can be especially useful when using Stop - 𝗔𝗧𝗥 or 𝗠𝗔 or 𝗟𝗢/𝗛𝗜. For example with 𝗟𝗢/𝗛𝗜 to put a stop for the last High/Low and add 0.5% additional Stoploss.
Fixed R:R — If the stop loss is Dynamic (Trailing or MA) then if R:R true can also be made Dynamic * Use it carefully, the function is experimental.
_________________________________________
⚉ TAKE PROFIT LEVELS ⚉
‾‾‾‾‾‾‾‾‾‾‾‾‾‾‾‾‾‾‾‾‾‾‾‾‾‾‾‾‾‾‾‾‾‾‾‾‾‾‾‾‾
A unique method of constructing intermediate Take Profit Levels will allow you to select up to 5 intermediate Take Profit Levels and one intermediate Stop Loss.
Intermediate Take Profit Levels are perfectly calculated into 5 equal parts in the form of levels from the entry point to the final Take Profit target.
All you need to do is to choose the necessary levels for fixing and how much you want to fix at each level as a percentage. For example, TP 3 will always be exactly between the entry point and the Take Profit target. And the value of TP 3 = 50 will close 50% of the amount of the remaining size of the position.
Note: all intermediate SL/TP are closed from the remaining position amount and not from the initial position size, as TV does by default.
SL 0 Position — works in the same way as TP 1-5 but it's Stop. With this parameter you can set the position where the intermediate stop will be set.
Breakeven on TP — When activated, it allows you to put the stop loss at Breakeven after the selected TP is reached. For this function to work as it should - you need to activate an intermediate Take. For example, if TP 3 is activated and Breakeven on TP = 3, then after the price reaches this level, the Stop loss will go to Breakeven.
* This function will not work with Dynamic Stoplosses, because it simply does not make sense.
CoolDown # Bars — When activated, allows you to add a delay before a new trade is opened. A new trade after CoolDown will not be opened until # bars pass and a new signal appears.
_____________________________
⚉ TIME FILTERS ⚉
‾‾‾‾‾‾‾‾‾‾‾‾‾‾‾‾‾‾‾‾‾‾‾‾‾‾‾‾‾
Powerful time filter code that allows you to filter data based on specific time zones, dates, and session days. This code is ideal for those who need to analyze data from different time zones and weed out irrelevant data.
With Time Filter, you can easily set the starting and ending time zones by which you want to filter the data.
You can also set a start and end date for your data and choose which days of the week to include in the analysis. In addition, you can specify start and end times for a specific session, allowing you to focus your analysis on specific time periods.
_________________________________
⚉ SIGNAL FILTERS ⚉
‾‾‾‾‾‾‾‾‾‾‾‾‾‾‾‾‾‾‾‾‾‾‾‾‾‾‾‾‾‾‾‾‾
Signal Filters — allows you to easily customize and optimize your trading strategies based on 10 filters.
Each filter is designed to help you weed out inaccurate signals to minimize your risks.
Let's take a look at their features:
__________________________________
⚉ RISK MANAGEMENT ⚉
‾‾‾‾‾‾‾‾‾‾‾‾‾‾‾‾‾‾‾‾‾‾‾‾‾‾‾‾‾‾‾‾‾‾
Risk management tools that allow you to set the maximum number of losing trades in a row, a limit on the number of trades per day or week and other filters.
Loss Streak — Set Max number of consecutive loss trades.
Win Streak — Max Winning Streak Length.
Row Loss InDay — Max of consecutive days with a loss in a row.
DrawDown % — Max DrawDown (in % of strategy equity).
InDay Loss % — Set Max Intraday Loss.
Daily Trades — Limit the number of MAX trades per day.
Weekly Trades — Limit the number of MAX trades per week.
* 🡅 I would Not Recommend using these functions without understanding how they work.
Order Size — Position Size
• NONE — Use the default position size settings in Tab "Properties".
• EQUITY — The amount of the allowed position as a percentage of the initial capital.
• Use Net Profit — On/Off the use of profit in the following trades. *Only works if the type is EQUITY.
• SIZE — The size of the allowed position in monetary terms.
• Contracts — The size of the allowed position in the contracts. 1 Сontract = Сurrent price.
________________
⚉ NOTES ⚉
‾‾‾‾‾‾‾‾‾‾‾‾‾‾‾‾
It is important to note that I have never worked with Backtesting and the functions associated with them before.
It took me about a month of slow work to build this system.
I want to say Big Thanks:
• The PineScripters🌲 group, the guys suggested how to implement some features. Especially @allanster
• Thanks to all those people who share their developments for free on TV and not only.
• I also thank myself for not giving up and finishing the project, and not trying to monetize the system by selling it. * Although I really want the money :)
I tried hard to make it as fast and convenient as possible for everyone who will use my code.
That's why I didn't use any libraries and dozens of heavy functions, and I managed to fit in 8+-functions for the whole code.
Absolutely every block of code I tried to make full-fledged modular, that it was easy to import/edit for myself (you).
I have abused the Ternary Pine operator a little (a lot) so that the code was as compact as possible.
Nevertheless, I tried very hard to keep my code very understandable even for beginners.
At last I managed to write 500 lines of code, making it one of the fastest and most feature-rich systems out there.
I hope everyone enjoys my work.
Put comments and write likes.

FBMAEN:
TradingView indicator for FBMA strategy
People oftem ask: “Dmitry, BABA, TSLA, AAPL flies like a rocket! Well, what are we buying!?” - And I say no, the price does not act like a straight rocket upwards or downwards, instead it breathes, inhales moving away from the moving average and exhales returning to it, so we will wait for the first pullback and buy exactly at the value of the moving average.
Your new paradigm: wait for the stock to pull back to the moving average rather than chasing the price
And one more thing... Remember, you don't want to buy a stock when it's going down, you'll start to have doubts. it's against human nature to go long when the price is falling, but that's why this strategy works so well. We buy on the price rollback (pullback to the moving average), but we DO IT WHILE FOLLOWING THE TREND.
The biggest consequence of this strategy, my author's FBMA strategy and this is a game changer (results are in the comments).
So, let's dive into FBMA indicator settings:
Main settings
ATR Period — Period of intergrated ATR Indicator(shows ATR in a small dashboard);
Settings of Moving Averages
Sign Moving Averages? — shows values of moving averages near their lines on the chart;
Fix MAs' signatures overlapping? — automatically MAs' signatures overlapping (specifically for SMAs and EMAs!) ;
Fix MAs' signatures overlapping between SMAs and EMAs? — automatically group overlapping between EMAs' and SMAs' signatures;
Min distance between MAs' signatures (in % of ATR) — minimal distance between MAs' signatures that indicator will push away MAs' signatures from each other if they are overlapped;
Dashboard
Dashboard position — position of dashboard on the chart ( 9 options ).
Settings of MAs
Source;
Period;
Option for showing EMA and/or SMA of chosen period and source;
Line colour ;
Signature colour .
Addons
Show data by selected timeframe? — shows difference of current price opening and opening a "timeframe" time ago;
Shows MAs only if asset has grown by selected growth % in selected timeframe?
Growth, % — percent, which asset has to gain in order for MAs to be plotted;
Timeframe — frequency with which price's current and previous opening are being will be compared;
Show analog MAs' signatures? — shows MAs' value in a small table;
Show cloud between 1st and 2nd MAs? — shows cloud for both EMAs and SMAs simultaneously).
Price Action
This settings are intuitively understandable
Feel free to leave your questions or suggestions in the comments!
* Price Action-section was taken from ChrisMoody's CM_Price_Action and rebuilt.
RU:
Индикатор TradingView для стратегии ПООС
Мне часто пишут в личку: “Дмитрий, BABA, TSLA , AAPL летит ракетой! Ну что покупаем!?”- А я говорю нет, цена не летит по прямой ракетой вверх, она дышит, делает вдохи отдаляясь от скользящей и выдохи возвращаясь к ней, поэтому мы дождёмся первого пуллбэка и купим точно на значении скользящей
Ваша новая парадигма: ждать акцию на пуллбэке к скользящей по тренду, а не гнаться за ценой
И ещё… Помните, вы не захотите покупать акцию в момент, когда она падает, вы начнете сомневаться т.к. это против человеческой природы заходить в лонг при падении цены, но именно поэтому эта стратегия работает так эффективно, т.к. мы покупаем на откате цены (пуллбэке к скользящей), но ПО ТРЕНДУ
Самое большее следствие из этой стратегии, моя авторская стратегия ПООС и это гейм-чейнджер (результаты в комментариях).
Итак, давайте посмотрим сами настройки индикатора:
Основные настройки
ATR Period — период интегрированного индикатора ATR (показывает ATR на небольшой панели);
Настройки скользящих средних
Sign Moving Averages? — показывает значения скользящих средних рядом с их линиями на графике;
Исправить перекрытие сигнатур МА? — автоматически сигнатуры СС перекрываются (специально для SMA и EMA!) ;
Исправить перекрытие сигнатур МА между SMA и EMA? — автоматически группировать перекрытие между сигнатурами EMA и SMA;
Минимальное расстояние между сигнатурами скользящих средних (в % от ATR) — минимальное расстояние между сигнатурами скользящих средних, при котором индикатор будет отталкивать сигнатуры скользящих средних друг от друга, если они перекрываются;
Панель управления
Dashboard position — положение таблицы на графике ( 9 вариантов ).
Настройки МА
Source;
Период;
Опция отображения EMA и/или SMA выбранного периода и source;
Цвет линии ;
Цвет подписи .
Дополнения
Показать данные по выбранному таймфрейму? — показывает разницу текущей цены открытия и цены открытия в прошлом, по времени равному величины параметра "Таймфрейм";
Показывает MA только в том случае, если актив вырос на выбранный % роста за выбранный период времени?
Прирост, % — процент, на который актив должен набраться, чтобы скользящие средние были построены;
Таймфрейм — частота, с которой будет сравниваться текущее и предыдущее открытие цены;
Показать сигнатуры аналоговых МА? — показывает значение МА в небольшой таблице;
Показать облако между 1-й и 2-й скользящими средними? — показывает облако для EMA и SMA одновременно).
Price Action
Эти настройки будут интуитивно понятны
Оставляете свои вопросы и предложения в комментариях, всё учтём!
* Price Action-section was taken from ChrisMoody's CM_Price_Action and rebuilt.

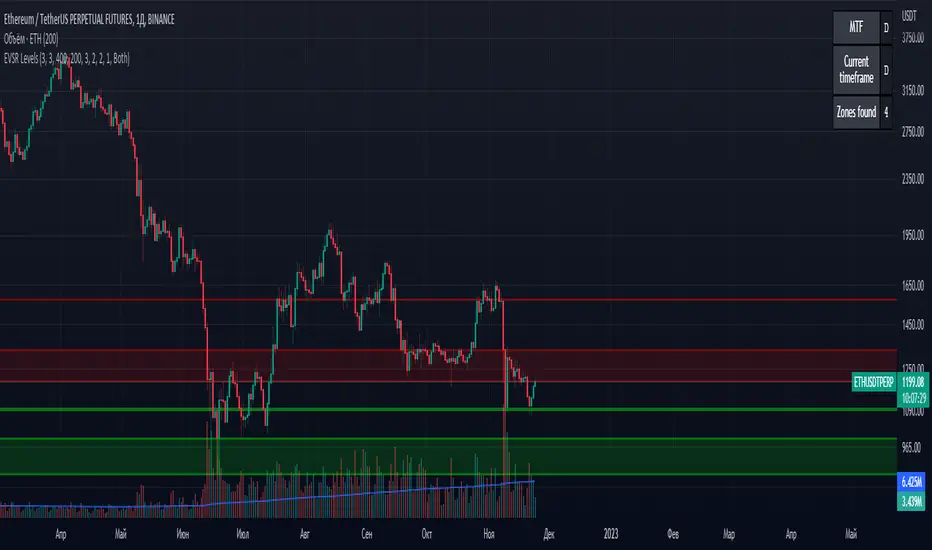
Extreme Volume Support Resistance LevelsExtreme Volume Support Resistance Levels are S/R levels(zones, basically), based on extreme volume .
Settings:
Lookback -- number of bars, which algorithm will be using;
Volume Threshold Period -- period of MA (Volume MA), which smoothers volume in order to find the extremes;
Volume Threshold Multiplier -- multiplier for Volume MA, which "lift" Volume MA and thus will provide the algorithm with more accurate extreme volume ;
Number of zones to show -- number of last S/R zones, which will be shown on the chart.
RU:
Extreme Volume Support Resistance Levels — это уровни S/R (зоны, в основном), основанные на избыточном объеме.
Параметры:
Lookback -- число баров, которое алгоритм будет использовать для расчётов;
Volume Threshold Period -- период MA (Volume MA), которая сглаживает объем для нахождения экстремумов объёма;
Volume Threshold Multiplier -- множитель для Volume MA, который "поднимает" Volume MA и тем самым обеспечивает алгоритм более точными значениями экстремального объёма;
Количество зон для отображения -- количество оставшихся зон S/R, которые отображаются на графике.
LuxAlgo - Backtester (S&O)The S&O Backtester is an innovative strategy script that encompasses features + optimization methods from our Signals & Overlays™ toolkit and combines them into one easy-to-use script for backtesting the most detailed trading strategies possible.
Our Signals & Overlays™ toolkit is notorious for its signal optimization methods such as the 'Optimal Sensitivity' displayed in its dashboard which provides optimization backtesting of the Sensitivity parameter for the Confirmation & Contrarian Signals.
This strategy script allows even more detailed & precise backtests than anything available previously in the Signals & Overlays™ toolkit; including External Source inputs allowing users to use any indicator including our other paid toolkits for take profit & stop loss customization to develop strategies, along with 10+ pre-built filters directly Signals & Overlays™' features.
🔶 Features
Full Sensitivity optimization within the dashboard to find the Best Win rates or Best Profits.
Counter Trade Mode to reverse signals in undesirable market conditions (may introduce higher drawdowns)
Built-in filters for Confirmation Signals w/ Indicator Overlays from Signals & Overlays™.
Built-in Confirmation exit points are available within the settings & on by default.
External Source Input to filter signals or set custom Take Profits & Stop Losses.
Optimization Matrix dashboard option showing all possible permutations of Sensitivity.
Option to Maximize for Winrate or Best Profit.
🔶 Settings
Sensitivity signal optimizations for the Confirmation Signals algorithm
Buy & Sell conditions filters with Indicator Overlays & External Source
Take Profit exit signals option
External Source for Take Profit & Stop Loss
Sensitivity ranges
Backtest window default at 2,000 bars
External source
Dashboard locations
🔶 Usage
Backtests are not necessarily indicative of future results, although a trader may want to use a strategy script to have a deeper understanding of how their strategy responds to varying market conditions, or to use as a tool for identifying possible flaws in a strategy that could potentially be indicative of good or bad performance in the future.
A strategy script can also be useful in terms of it's ability to generate more complete & configurable alerts, giving users the option to integrate with external processes.
In the chart below we are using default settings and built-in optimization parameters to generate the highest win rate.
Results like the above will vary & finding a strategy with a high win rate does not necessarily mean it will persist into the future, however, some indications of a well-optimized strategy are:
A high number of closed trades (100+) with a consistently green equity curve
An equity curve that outperforms buy & hold
A low % max drawdown compared to the Net Profit %.
Profit factor around 1.5 or above
In the chart below we are using the Trend Catcher feature from Signals & Overlays™ as a filter for standard Confirmation Signals + exits on a higher timeframe.
By filtering bullish signals only when the Trend Catcher is bullish, as well as bearish signals for when the Trend Catcher is bearish, we have a highly profitable strategy created directly from our flagship features.
While the Signals & Overlays features being used as built-in filters can generate interesting backtests, the provided External Sources can allow for even more creativity when creating strategies. This feature allows you to use many indicators from TradingView as filters or to trigger take-profit/stop-loss events, even if they aren't from LuxAlgo.
The chart below shows the HyperWave Oscillator from our Oscillator Matrix™ being used for take-profit exit conditions, exiting a long position on a profit when crossing 80, and exiting a short position when crossing 20.
🔶 Counter Trade Mode
Our thesis has always firmly remained to use Confirmation Signals within Signals & Overlays™ as a supportive tool to find trends & use as extra confirmation within strategies.
We included the counter-trade mode as a logical way to use the Confirmation signals as direct entries for longs & shorts within more contrarian trading strategies. Many traders can relate to using a trend-following indicator and having the market not respect its conditions for entries.
This mode directly benefits a trader who is aware that market conditions are generally not-so-perfect trends all the time. Acknowledging this, allows the user to use this to their advantage by introducing countertrend following conditions as direct entries, which tend to perform very well in ranging markets.
The big downfall of using counter-trade mode is the potential for very large max-drawdowns during trending market conditions. We suggest for making a strategy to consider introducing stop-loss conditions that can efficiently minimize max-drawdowns during the process of backtesting your creations.
Sensitivity Optimization
Within the Signals & Overlays™ toolkit, we allow users to adjust the Confirmation Signals with a Sensitivity parameter.
We believe the Sensitivity paramter is the most realistic way to generate the most actionable Confirmation Signals that can navigate various market conditions, and the Confirmation Signals algorithm was designed specifically with this in mind.
This script takes this parameter and backtests it internally to generate the most profitable value to display on the dashboard located in the top right of the chart, as well as an optimization table if users enable it to visualize it's backtesting.
In the image below, we can see the optimization table showing permutations of settings within the user-selected Sensitivity range.
The suggested best setting is given at the current time for the backtesting window that's customizable within the indicator. Optimized settings for technical indicators are not indicative of future results and the best settings are highly likely / guaranteed to change over time.
Optimizing signal settings has become a popular activity amongst technical analysts, however, the real-time beneficial applications of optimizing settings are limited & best described as complicated (even with forward testing).
🔶 Strategy Properties (Important)
We strongly recommend all users to ensure they adjust the Properties within the script settings to be in line with their accounts & trading platforms of choice to ensure results from strategies built are realistic.
🔶 How to access
You can see the Author's Instructions below to learn how to get access on our website.

ATR Trend FollowingThe script filters stocks on the basis of ATR. If the stock has moved above 7 times the ATR from the lows, the system generates buy signal and continues till the stock drops by 2 ATR. It is a good system in trending markets however in sideways consolidating markets, the system must be avoided. In trending markets it can generate good returns with significant Risk to Reward Ratio. Use it in confirmation with other trend depicting indicators is expected to generate better results.

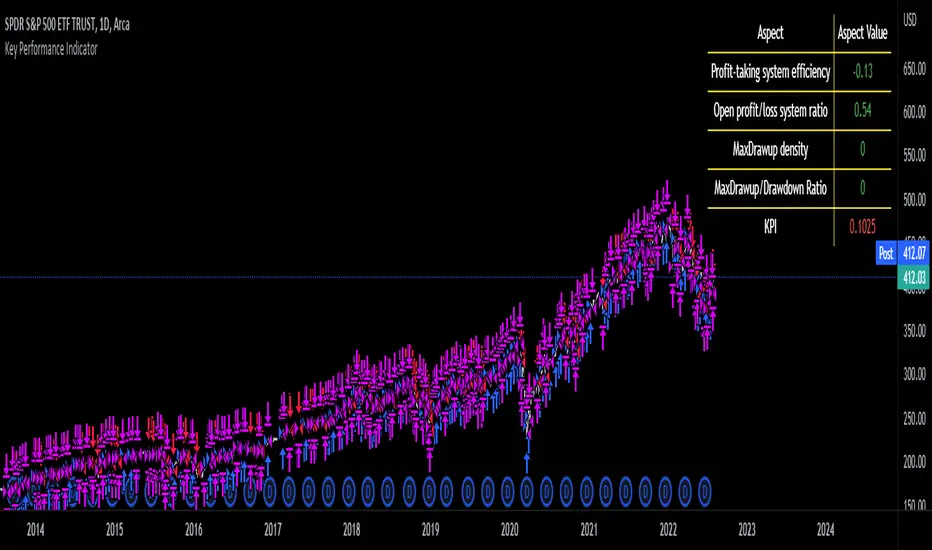
Key Performance IndicatorWe are happy to introduce the Key Performance Indicator by Detlev Matthes. This is an amazing tool to quantify the efficiency of a trading system and identify potential spots of improvement.
Abstract
A key performance indicator with high explanatory value for the quality of trading systems is introduced. Quality is expressed as an indicator and comprises the individual values of qualitative aspects. The work developing the KPI was submitted for the 2017 VTAD Award and won first prize.
Introduction
Imagine that you have a variety of stock trading systems from which to select. During backtesting, each trading system will deliver different results with regard to its indicators (depending on, inter alia, its parameters and the stock used). You will also get different forms of progression for profit development. It requires great experience to select the “best” trading system from this variety of information (provided by several indicators) and significantly varying equity progression forms. In this paper, an indicator will be introduced that expresses the quality of a trading system in just one figure. With such an indicator, you can view the results of one backtest at a glance and also more easily compare a variety of backtesting results with one another.
If you are interested in learning more about the calculations behind this indicator then I have included a link to the english version of his research paper.
Along with this, we now offer indicator development services. If you are interested in learning more then feel free to reach out to get a quote for your project.
**Please note that we have NOT inputted any real strategy into the code and therefore it is not producing any real value. Feel free to change the code as desired to test any strategy!**
drive.google.com
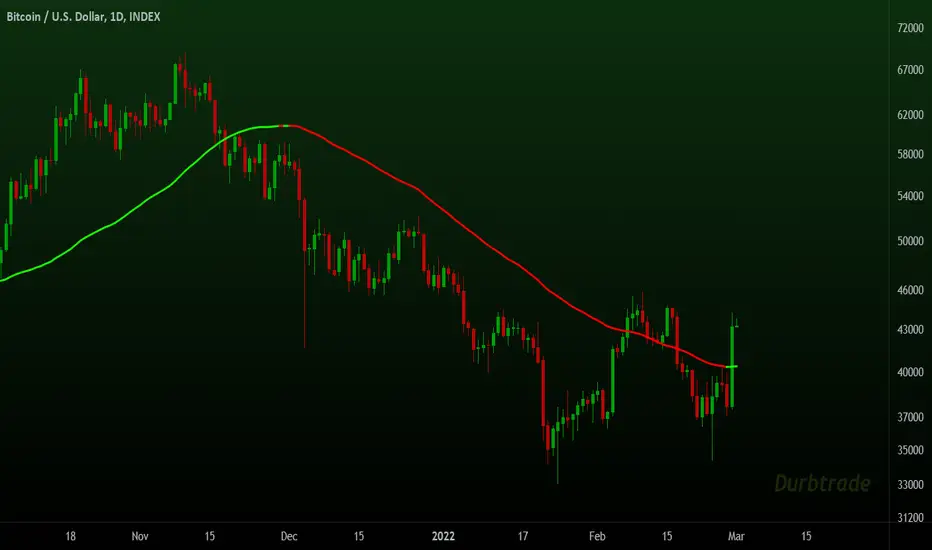
VWAP/EMA50/EMA200We script this one for combining VWAP , EMA50 and EMA200. The tool is fantastic if traders know how VWAP , EMA work? Just adding this script in your favorite and work like charm:
VWAP: How to trade with that
- One of the simplest uses of the VWAP is gauging support and/or resistance.
- A trader who is long a stock can use the VWAP as a target exit if its trading below.
- A stock trading over intraday VWAP may be bullish , while a stock trading under may be bearish .
EMA 50/EMA200: How to trade with that timeframe 50-day or 200-day period
- Identify the trend of market in longterm
- Golden-cross (short term EMA cross above longterm EMA ) is call golden-cross signals. It is opportunity for buying.
- Deal-cross ( short term EMA cross below longterm EMA ) is call dead-cross signals. It is opportunity for selling.
- Identify support levels
- Identify resistance levels
Let me know if you see anything else that should be added/changed.

Moving Averages System - DurbtradeMoving Averages System - Durbtrade
1 indicator... customizable.
Displays up to 4 independent Moving Averages (MA's) at once.
Each MA can be 1 of 6 "MA Types" : SMA, EMA, WMA, VWMA, HMA, or DEMA.
There are 7 individual fills...
4 "MA/Source Fills" and 3 "MA/MA Fills".
The "Source" is selectable,
and there is a "Source Plot" option
to display a plot of the source.
No max value for MA "Length".
Each MA has what I call a "Length Multiplier",
and each MA has its own "Offset".
The colors of each MA,
as well as the Source Plot,
can be up/down "Color-Changing", or solid.
"Line Thickness" is unlimited.
Each of the 3 "MA/MA Fills" allow you to select which 2 of the 4 MA's to fill between!
All 7 fills are customizable by above/below colors, and opacity.
All 7 fills include a "Color Swap" option,
in the case that you need to switch the display of the above-color to the below-color,
and the below-color to the above-color!
All plots are scripted to be drawn visually in front of all fills!
Lastly, you can turn off the display of the MA plots and the Source Plot...
allowing the display of only fills!
--------------------------------------------
--------------------------------------------
Let's take a more detailed look!
First, let's go through the settings, and how to use the Moving Averages System.
You can divide the Inputs tab of the indicator settings into 3 main sections...
1 - Moving Averages
2 - Source Plot, and MA/Source Fills
3 - MA/MA fills
Let's discuss the first section, which is where we set up our MA's.
Here, we see the parameters for our 4 Moving Averages :
All 4 MA's can be customized here in the following ways...
- Toggle ON/OFF by checking the checkbox
- Length
- Length Multiplier
- Type (SMA, EMA, WMA, VWMA, HMA, or DEMA)
- Up/Down Color Change ON/OFF
- Line Thickness
- Offset
(The Plot Styles, Up/Down/Solid Colors, and Opacities of all 4 MA's
are customizable under the Style tab of the indicator settings)
There are no maximum value limitations for Length, Line Thickness, and Offset.
Of note, the "Length Multiplier" multiplies the "Length" value by a chosen integer.
This can be used to incrementally scan a wide spectrum of lengths very quickly.
Or it can be used to maintain ratios while increasing the MA display lengths...
just multiply all lengths by the same number.
It can also be used to easily create a moving average ribbon
by using multiple Moving Average Systems all at once.
Or, it can be another method to set up higher-timeframe MA's on a lower-timeframe chart...
for example, if both the chart and indicator are on the 1Hour timeframe,
you can multiply all of your set lengths by 24
to see the 1Day MA's of those same lengths on the 1Hour chart.
Next, lets look at the second section of the Inputs tab of the indicator settings,
where we edit the "Source Plot" and "MA/Source Fills".
We can turn ON/OFF the "Source Plot" -
which plots a line of the "Source" that you have selected -
and edit the parameters :
Checking the "Source Plot" box turns the "Source Plot" ON/OFF.
You can turn Up/Down Color Change ON/OFF,
and adjust Line Thickness and Offset.
(The Plot Style, Up/Down/Solid Colors, and all Opacities of the Source Plot
are customizable under the Style tab of the indicator settings.)
Next is where you can turn ON/OFF and edit each "MA/Source Fill".
Checking the "MA#1/Source Fill" box turns on the fill between MA#1 and the source.
You can choose the color and opacity for the above-color and the below-color.
Need to switch the display of the two colors?... turn on "Color Swap" to easily do just that.
The remaining 3 MA/Source Fills work in the same exact way...
turning on a fill between the associated MA#, and the source.
In total, there are 4 MA/Source Fills... 1 for each MA.
Note that neither the Source Plot, nor any of the MA's, need to be turned on
in order to use the MA/Source Fills.
Finally, lets look at the third section of the Inputs tab of the indicator settings.
This is where we can edit the 3 "MA/MA Fills".
An MA/MA Fill allows you to select any 2 of the 4 MA's that you have set,
and fill the space between them with color :
Checking the MA/MA Fill box turns ON/OFF the associated MA/MA Fill.
Below each ON/OFF switch are 2 boxes where you can select the 2 MA's that you want to fill between.
Select the 2 MA's that you want to use according to their MA#'s.
Next, you have the Above/Below Color/Opacity for the associated MA/MA Fill,
and lastly, the Color Swap option.
The numerical order of the MA#'s that you select here is of no concern,
because each MA/MA Fill has that "Color Swap" option...
and, as before, this swaps the display of the above-color and the below-color.
Note that the MA's do not need to be turned on
in order to use the MA/MA Fills.
--------------------------------------------
Additional Notes :
All colors and opacities of this indicator can be customized.
All fills can have above/below colors, and all plots can have up/down colors.
All fills and plots can be one static color, too.
All plots can be 1 of 10 plot styles:
Line, Line with Breaks, Step Line, Step Line with Diamonds, Histogram,
Cross, Area, Area with Breaks, Columns, or Circles.
All plots use the same single "Source", which is selectable.
And don't forget... you can try applying this indicator to other indicators!
--------------------------------------------
Now, let's take a look at some examples of the Durbtrade Moving Averages System in action!
All 4 MA's plots on, MA Type is SMA, color-changing on, lengths 50, 100, 150, and 200 :
Add the Source Plot, and all 4 MA/Source Fills :
Add the 3 MA/MA fills :
Turn off candles visibility, and turn off MA color-change :
Turn off the MA plots :
Turn off the Source Plot :
...
Here are some other images using the Multi Moving Average Tool :
Here it is on the 1Second :
Here it is on the 3Day :
Here is your 1Day SMA DeathCross :
Use 3 Moving Average Systems at once to build your own EMA Ribbon :
Compare 4 different MA types, all with the same length :
--------------------------------------------
Script Stats :
Pinescript Version : 5
Code Length : 149 Lines
Total Plots : 16
- Visible Plots : 5 (4 MA Plots, 1 Source Plot)
- Invisible Plots : 11 (4 MA Plots, 1 Source Plot, 6 MA/MA Fill Plots)
Total Fills : 7 (4 MA/Source Fills, 3 MA/MA Fills)
Total Colors/Opacities : 29
Total Unique Variables : 92
- Input Variables : 69
- Unique Output Variables : 23
--------------------------------------------
Final Thoughts :
I'm excited to share the Durbtrade Moving Averages System!
I think that this indicator has a wide range of MA-related applications,
an easy-to-use interface with maximum customization, and unique fill features...
all in one indicator.
I feel that it is a quick and useful tool
whether you are just plotting a few moving averages...
or you are creating intense kaleidoscopic tidal waves of colored data!
Either way, I think it is pretty awesome,
and so, I wanted to share it with you...
I hope that you enjoy it and find it useful!
- Please feel free to comment your thoughts, critiques, or suggestions. They are all very helpful!
- Also, please feel free to comment any positive feedback, or awesome screencaps/ideas of the indicator in action!
- Check out my other Pinescript indicators if you like this one... they work well together.
- I hope that you find this script useful.
- Enjoy!
--------------------------------------------
// Durbtrade
Strategy - Cryptosystem NNFX wayFirst script done!
This is my version of the No-Nonsense Forex (NNFX) Strategy
This strategy shows you the entry and exit signal with a standard 1.5 x ATR for Stop Loss and 1 x ATR for Taking Profit. You can adjust the settings to your needs.
This strategy uses 5 indicators:
1. Average True Range for SL and TP placement, there is a nuance where you can add the 1XATR Rule;
2. SMA used to filter longs and shorts;
3. SSL Channel for 1st Confirmation;
4. DPO for 2nd Confirmation;
5. Waddah Attar Explosion as a volume indicator.
There is no exit indicator because I coded 2 trades (2x0.5). TP1 will be at 1xATR and TP2 will automatically trail behind with 1.5XATR. You can see the red trailing line on the charts.
Other exits can be: When SSL gives opposite signal or when price crosses and closes your baseline.
I used this system for 1D timeframe.
Hopefully this can be usefull for your tradingstyle.
Would be great if you guys leave a like.
Thanks!

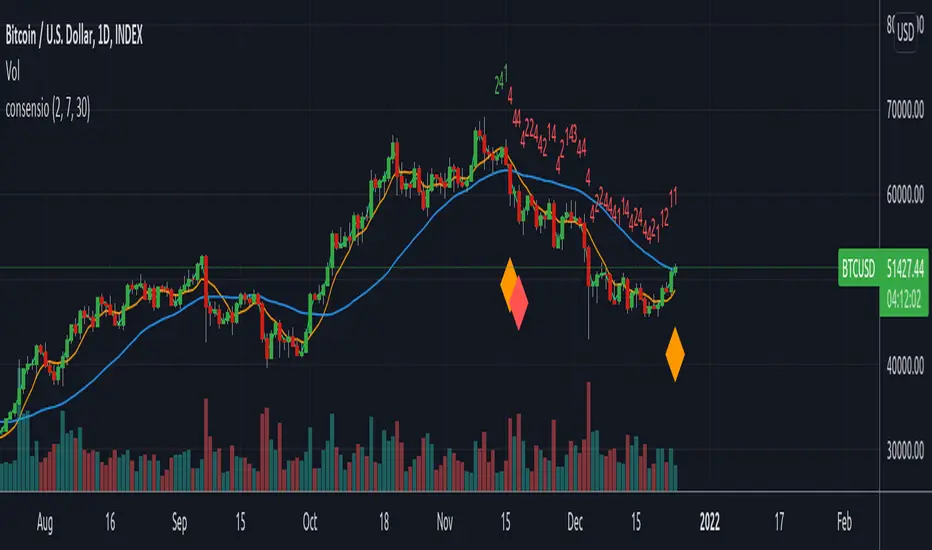
ConsensioThis indicator is based on Consensio strategy.
Green = 100% Bullish,
Yellow = 75%-90% Bullish,
Orange = 30%-75% Bullish,
Red = 100% Cash Position
1-4 Green candles = Bullish trend momentum (4 is stronger)
1-4 Red candles = Bearish trend momentum (4 is stronger)
INDIGO - Cloud System ©INDIGO Cloud System ©
This script shows the monthly dip and peak zones and the daily highs & lows.
The green zone is the dip zone. It's the place to enter a long position if you think there is or will be a reversal.
The red zone is the peak zone. It's the place to enter a short position if you think there is or will be a reversal.
The script uses the INDIGO Cloud System ©, the Ultimate RSI and the Market Direction Indicator to find an entry at the most optimal point in space and time.
The exit for the long trade is on the purple line and the exit for the short trade is on the blue line.
It also has an RSI exit to minimize the risk of a sudden reversal in the wrong direction while in trade.
You can set TP and SL to see the effects of it on the chart. Be aware that these change a lot of trades so use it wisely.
The labels are connected to alerts to notify you of a possible entry or exit.
This script uses the Ultimate RSI by ChrisMoody, thanks for creating this Chris !
This script also uses the Market Direction Indicator by LazyBear, great script !
You can use the MD Filter to filter out some bad trades. It decreases losses but also some profits.
Experiment with the settings, each pairing needs different settings.
--> Use this script at your own risk. Do your own research, never invest money you're not willing to lose and never put your trust in one indicator !
To my best knowledge this script doesn't repaint. I never use the close and only use high/low when value can't be untrue again. If you find repainting in this script PLEASE let me know !
Feel free to contact me for questions or feedback.
Enjoy the script :)

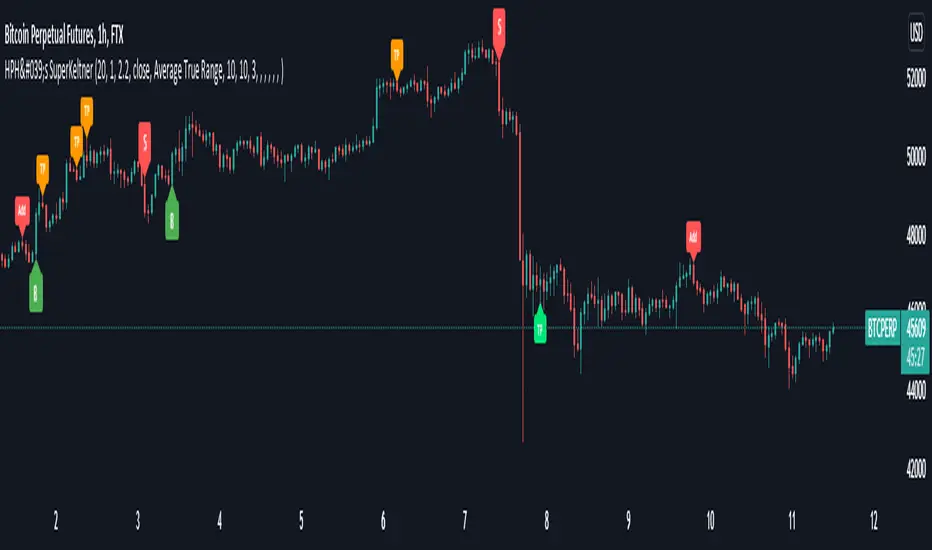
HPH's SuperKeltnerThis indicator combines the Supertrend (to determine the main trend direction) with two Keltner channels (used for add and take profit signals) to construct a trend trading system.
These are the available settings:
General
UseTrendChange ➞ toggle trend change alerts and labels
UseAdds ➞ toggle add to position alerts and labels
UseTakeProfits ➞ toggle take profit alerts and labels
PrematureAdds ➞ toggle adding to position as soon as the add channels are left (default is false, so the add signal will only fire once the channels are re-entered)
PrematureTakeProfits ➞ toggle taking profit as soon as the tp channels are left (default is false, so the tp signal will only fire once the channels are re-entered)
Visualization
Show Add Keltner ➞ toggle display of the channels used for adding to the position
Show TP Keltner ➞ toggle display of the channels used for taking profit
Show SuperTrend ➞ toggle display of the Supertrend
Keltner
Standard Keltner channels settings except for the fact that there are two different multipliers. The Keltner TP Multiplier should generally be bigger than the Keltner Add Multiplier , as the channels are hit differently in trending markets. I recommend you to use the visualization settings to show the channels and adjust the settings to your liking.
Supertrend
Standard Supertrend settings, nothing to add here.
Alerts
Use the alert messages to customize what alert text the indicator will send. This makes it possible to use the script to automate trading bots.
By default, the alerts are sent after the candle has closed. This ensures that no repainting is happening. If you like the risk, you can toggle the corresponding WaitFor Confirmation if you wish to receive the signals earlier (max. once per bar).
Enjoy!

NVME TP & SL systemNVME TP and SL system is an ATR based risk management tool that is designed to identify possible stop loss and take profit points for you to follow depending on the volume generated by the average true range. Sometimes, they zones may be really close together and this often occurs during a ranging period of the market where there is little movement and this can be fixed if you increase the values on the settings. Moreover, you can input your entry price and what position you are looking for such as a short or a long and then the indicator will generate some zones for you to follow too. The zones will not update after every bar close but instead follow the main setting of bar reset period where the indicator will generate new zones if x bars has passed, default is 20.
Features:
3 Take profit zones ( all customisable: colour, atr multiplier, display toggle on and off )
1 Stop Loss Zone ( all customisable: colour, atr multiplier, display toggle on and off )
Custom Position (Long or Short)
Custom Entry Point (Up to 9 decimal places)

Impact Zones - Skylyne InvestingWhat is the Impact Zone system:
The creation of Impact Zones started with our love for trading the Bond Market. Impact Zones were originally specifically tailored for the Bond market and now have been mastered to capture most of the Asset Classes out in the market today (Please look at Impact Zone Settings section for asset classes covered by this script). The Impact Zone system is a zone break (or market level break) following system with specific take profit points already established for you on the open of the market day (depending on your asset timing will vary).
*This script was designed for Intraday Trading, Long term or Swing Trading is not recommended with this system
The script will create buy and sell signals on the break of the Impact Zones when specific criteria is met along with the break of the zone. You do not have to use only our signals provided, you can also create your own trading rules based on our script.
Items to highlight:
Skylyne Upper Zone: Green Zone
Skylyne Middle: Yellow Line
Skylyne Lower Zone: Red Zone
Skylyne Take Profit Lines: Purple Lines
Skylyne Average: Orange Line (dynamic support/resistance)
Skylyne Overnight Session: Dark Blue (No Trade Zones)
Skylyne Signals: Buy / Sell
You can think of the Upper Zone as a bull zone and Lower zone as a bear zone, when price enters these zones we want to start watching price action to determine direction the market will take on the break or specified zone, whether it be a break and reversal or a break and run. This can be confirmed with either our signals (buy & sell) or the use of the dynamic support and resistance line (Skylyne Average).
Our script is written to capture market zones and place then on your screen with ease, we also have programmed in specific take profits and stop loss levels we have found the market respects on the intraday trading based on the Impact Zone captured.
The Impact Zones and Take Profit Levels change at Market open everyday. The levels provided will stay on your chart until the next Market open where the Impact Zones and Levels will change to accommodate that trading Day.
We recommend only using that trading days levels, however; using past levels can help trades depending on the case
The three Trades we want to highlight are:
1. Break of Impact Zones
a. This trade is taken when a break of the impact zone happens either in the positive or negative direction and traded to the next zone or take profit line (stop losses can be set with zones or the dynamic skylyne average crossovers)
2. Break of Skylyne Average
a. This trade is taken when price action confirms a bullish or bearish bias on the break of the average line (we would close this trade on the reverse break of the Skylyne Average using the zones as targets)
3. Break of the Skylyne Mid:
a. This trade is taken when a break of the Skylyne Mid level occurs and we use the upper and lower bounds of the Impact Zones as take profit and stop losses
Impact Zone Settings:
*Trading Category and Overnight Category must match the Asset Class being viewed on chart for accurate signals
1. Trading Category
a. Bonds
b. Corn/Wheat
c. Stocks
d. Index Futures
e. Euro/Dollar
f. Gold/Silver
2. Overnight Category
a. Bonds
b. Corn/Wheat
c. Stocks
d. Index Futures
e. Euro/Dollar
f. Gold/Silver
3. Chart Aggregation Limit (Default Value is 25 minutes)
Impact Zone Overnight Trading:
Impact Zone Overnight sessions are highlighted in a dark blue color and we use these highlighted time sessions as a NO TRADE session. Our system was built to be traded during normal market trading hours and overnight sessions tend to be less predictive in terms of direction and or zone reliance. If you choose to trade overnight sessions with Impact Zones, make sure you make a very in depth trading plan and stick to the rules set for yourself.
Impact Zone Signals:
1. Signals for buy or sell of the asset class happen on breaks of the Impact Zones, and when specific criteria are met that we determined necessary to evaluate the overall trend of the market
2. Not every break of the Impact Zones will trigger a signal
3. No signal will be generated during overnight sessions, we recommend studying overnight sessions before beginning to create your own overnight trading session plans based on Impact Zones
4. When a signal is generated you will use the next take profit line (purple line) in the direction of your trade you are in. Other trading signals were discussed above
5. If while you are in a trade and the skylyne average (orange line) is broke in the opposite direction of your trade you will take this as a dynamic stop, and in some cases a dynamic take profit
Impact Zone Charting Timeframes:
1. Recommendation of using the 1 minute chart aggregation bars to maximize profits and limit losses
2. The script has a default charting aggregation limit of 25 minutes, adjustments to the input (in the settings) to increase the aggregation limit need to be made in order to use higher than 25 minute timeframes
Charting Example:
First note is to notice how our publish example uses the 1-minute timeframe aggregation, this is because our script was written to maximize profit on the 1 minute time frame. The script can be used on any time frame, however; make sure that you increase the aggregation limit input when using timeframes above 25 minutes.
From the chart included in the script post, you can notice that buy and sell signals happen only when specified criteria is met, and not every time there is a crossover of the Impact Zones there is a signal. You do not only have to trade the buy and sell signals that our system provides, however; our team believes that these signals are one of the best ways to trade the Impact Zone script. If you deviate from only using signals provided and choose to use the Impact Zones differently, we recommend using the next level, or zone, in the direction of your trade as your take profit (As described in trade we want to highlight section)

Basic SMA 200 StrategyThe SMA 200 basic strategy will be more than familiar to most traders.
This strategy is to stay with the programming language so to say the "Hello World" of trading.
The SMA 200 basic strategy is also one of the simplest strategies in trading. All that is required is the price and a 200 period moving average. Usually the strategy is used in the daily chart.
The rules are as follows:
Entry: A position is opened when the price crosses the moving average 200 from the bottom to the top.
Exit: The position is closed when the price crosses the moving average from top to bottom.
This is a trend following system and was originally used for trading stocks.
In my opinion, trading with the strategy is recommended to every beginner. There are strategies with better performance, but they are much more complicated to implement. And that's where the big advantage of the strategy can be seen.
Beginners are more than overwhelmed at the beginning of their trading career. Often beginners trade in the 5 min chart with 6 different indicators some signals that they have seen in a Youtube video.
Comparable to a beginner driver who immediately gets into a Porsche as his first car.
Beginners should follow simple rules and avoid intraday charts. Above all, you should do the actual work of a trader.A trader does not just press the mouse twenty times a day and then has easily earned 2000 $. A trader tests systems down to the smallest detail, optimizes and tests again, until he has found an almost " waterproof " trading system. The 200 SMA basic strategy is excellent for gaining experience, learning to follow the rules of a system and not to burn your money right away.
With this script you can test how successful the "simplest strategy in the world" would have been in the past.
Small tip: Do not trade Forex with it it will never work. The strategy is made for long trends and you can find them for example in the stock market.
Have fun with it! About a positive feedback I would be very happy of course.
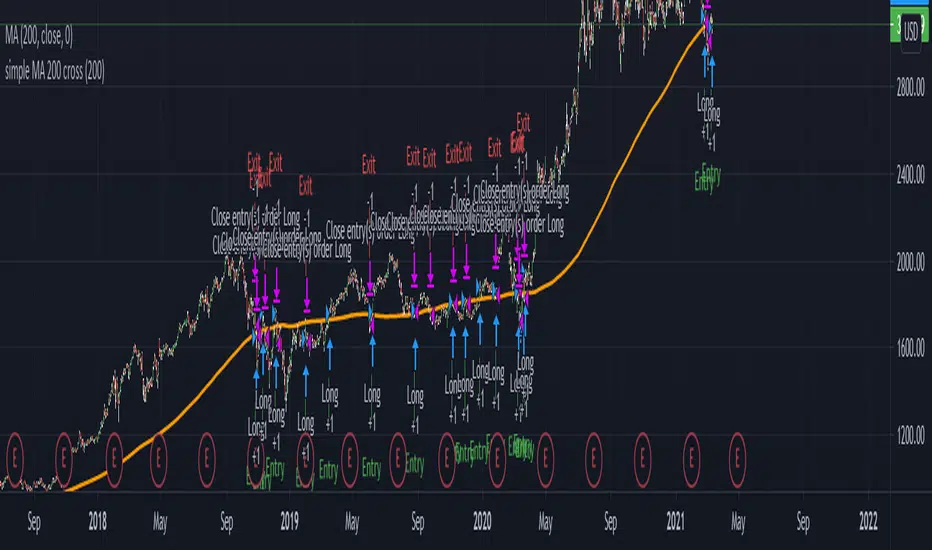
ACD - Fisher's Methodology(Manual Sessions & Values)ACD - Fisher's Methodology(Manual Sessions & Values)
Version 1.00
Created by TWA_TradeWithAmir(TWA_PriceActionTips)
Updated 10/14/2020
Based On Mark B. Fisher's ACD Methodology
* Open the Indicator only in GMT+0(UTC+0)
* You Can Change the Session with First Parameter in input
* Run Indicator with Session Breaks for better view
* Do not change the Session Values(Session Periods)
* Enjoy!
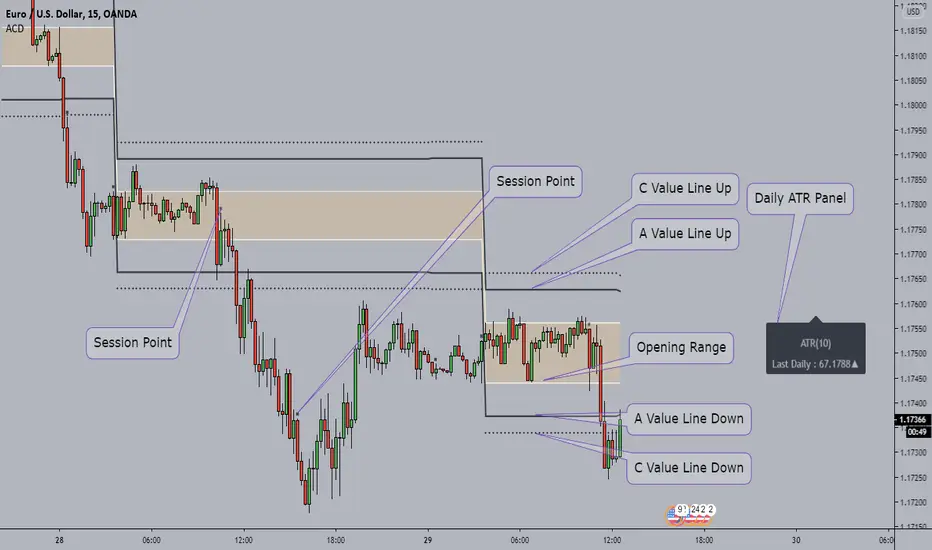
Fractal Trend Trading System [DW]This is an advanced utility that uses fractal dimension and trend information to generate useful insights about price activity and potential trade signals.
In this script, my Advanced FDI algorithm is used to estimate the fractal dimension of the dataset over a user defined period.
Fractal dimension, unlike spatial or topological dimension, measures how complexity or detail in an "object" changes as its unit of measurement changes, rather than the number of axes it occupies.
Many forms of time series data (seismic data, ECG data, financial data, etc.) have been theoretically shown to have limited fractal properties.
Consequently, we can estimate the fractal dimension from this data to get an approximate measure of how rough or convoluted the data stream is.
Financial data's fractal dimension is limited to between 1 and 2, so it can also be used to roughly approximate the Hurst Exponent by the relationship H = 2 - D.
When D=1.5, data statistically behaves like a random walk. D above 1.5 can be considered more rough or "mean reverting" due to the increase in complexity of the series.
D below 1.5 can be considered more prone to trending due to the decrease in complexity of the series.
In this script, you are given the option to apply my Band Shelf EQ algorithm to the dataset before estimating dimension.
This enables you to transform your data and observe how its newly measured complexity changes the outputs.
Whether you want to give emphasis to some frequencies, isolate specific bands, or completely alter the shape of your waveform, EQ filtration makes for an interesting experience.
The default EQ preset in this script removes the low shelf, then attenuates low end and high end oscillations.
The dominant cyclical components (bands 3 - 5 on default settings) are passed at 100%, keeping emphasis on 8 to 64 sample per cycle oscillations.
The estimated dimension is then used to calculate the High Dimension Zone and the Error Bands.
Both of these components are great for analyzing trends and for estimating support and resistance values.
The High Dimension Zone is composed of a high line, low line, and midline that update their values when D is at or above the user defined zone activation threshold.
The zone is then averaged over a user defined amount of updates and zone width is multiplied by a user defined value.
The Error Bands are composed of a high, low, and middle band that are calculated using an error adjusted adaptive filter algorithm that utilizes dimension as the smoothing constant modulator.
The basis filter for the error bands has two calculation types built in:
-> MA - Calculates the filters as adaptive moving averages modulated by D.
-> WAP - Calculates the filters as adaptive weighted average prices modulated by D.
The WAP starting point can be based on the High Dimension Zone being moved or a user defined interval.
You can also define the WAP's minimum and maximum periods for additional control of the initial and decayed sensitivity states.
The alpha (smoothing constant) modulator can be fine tuned using the designated dimension thresholds.
When D is at or below the low dimension threshold, the filter is most responsive, and vice-versa for the high dimension threshold.
Alpha is then multiplied by a user defined amount for additional control of sensitivity.
Band width is then multiplied by a user defined value.
A Hull transformation can be optionally performed on the zone averaging and band filter algorithms as well, which will alter the frequency and phase responses at the cost of some overshoot.
This transformation is the same as a typical Hull equation, but with custom filters being used instead of WMA.
The calculated outputs are then used to gauge the trend for signal and color scheme calculations.
First, a dominant trend indication is selected from its designated dropdown tab.
The available built in indications to choose from are:
-> Band Trend (Outer) - Detects band breakouts and saves their direction to gauge trend.
-> Band Trend (Median) - Uses disparity between source and the band median to gauge trend.
-> Zone Trend (Expansion) - Detects when the high fractal zone expands and saves its direction to gauge trend.
-> Zone Trend (Outer Levels) - Detects zone breakouts and saves their direction to gauge trend.
-> Zone Trend (Median) - Uses disparity between source and the zone median to gauge trend.
Then the trend output is optionally filtered before triggering signals.
There are multiple trend filtration options built into this script that can be used individually or in unison:
-> Filter Trend With High Fractal Zone - Filters the trend using the specified zone level or combination of levels with either disparity or crossover conditions.
There is a set of options for bullish and bearish trends.
-> Filter Trend With Error Bands - Filters the trend using the specified band level or combination of levels with either disparity or crossover conditions.
There is a set of options for bullish and bearish trends.
-> Filter Trend With Band - Zone Disparity Condition - Filters the trend using the specified band level, zone level, and disparity direction.
There is a set of options for bullish and bearish trends.
-> Filter By Zone That Moves With The Trend - Filters the specified trend by detecting when the high fractal zone’s direction correlates.
-> Filter By Bands That Move With The Trend - Filters the specified trend by detecting when the error bands’ direction correlates.
-> Filter Using Wave Confirmation - Filters the specified trend by detecting when source is in a correlating wave with user defined length.
You can also choose separate lengths for bullish and bearish trends.
-> Filter By Bars With Decreasing Dimension - Filters the specified trend by detecting when fractal dimension is decreasing, suggesting source is approaching more linear movement.
The filtered trend output is then used to generate entry and exit signals.
There are multiple options included to fine tune how these signals behave.
For entries, you have the following options built in:
-> Limit Entry Dimension - Limits the range of dimensional values that are acceptable for entry with user defined thresholds.
This can be incredibly useful for filtering out entries taken when price is moving in a more complex pattern,
or when price is approaching a peak and you’re a little late to the party.
-> Enable Position Increase Signals - Enables more entry signals to fire up to a user defined number of times when a position is active.
This is helpful for those who incrementally increase their positions, or for those who want to see additional signals as reference.
-> Limit Number Of Consecutive Trades - Limits the number of consecutive trades that can be opened in a single direction to a user defined maximum.
This is especially useful for markets that only trend for brief durations.
By limiting the amount of trades you take in one direction, you have more control over your market exposure.
There is a set of these options for both bullish and bearish entries.
For exits, you have the following options built in:
-> Include Exit Signals From High Fractal Zone - Enables exit signals generated from either crossover or disparity conditions between price and a specified zone level.
-> Include Exit Signals From Error Bands - Enables exit signals generated from either crossover or disparity conditions between price and a specified zone level.
-> Include Inactive Trend Output For Exits - Triggers exit signals when the filtered trend output is an inactive value.
-> Dimension Target Exit Method - Triggers exit signals based on fractal dimension hitting a user defined threshold.
You can either choose for the exit to trigger instantly, or after dimension reverts from the target by a user specified amount.
-> Exit At Maximum Entry Dimension - Triggers exit signals when dimension exceeds the maximum entry limit.
-> Number Of Signals Required For 100% Exit - Controls the number of exit signals required to close the position.
You can also choose whether or not to include partial exits.
Enabling them will fire a partial signal when an exit occurs, but the position is not 100% closed.
Of course, there is a set of these options for bullish and bearish exits.
In my opinion, no system is complete without some sort of risk management protocol in place.
So in this script, bullish and bearish trades come equipped with optional protective SL and TP levels with signals.
The levels can be fixed or trailing, and are calculated with a user defined scale.
The available scales for SL and TP distances are ticks, pips, points, % of price, ATR, band range, zone range, or absolute numerical value.
Now what if you have some awesome signals of your own that you’d like to use in conjunction with this script?
Well good news. You can!
In addition to all of the customizable features built into the script, you can integrate your own signals into the system using the external data inputs and linking your script.
This adds a whole new layer of customization to the system.
With external signals, you can use your own custom dominant trend indication, filter the dominant trend, and trigger exits and protective stops using custom signals.
The signal input is an integer format. 1=Bull Signal, -1=Bear Signal, 2=Bull Exit, -2=Bear Exit, 3=Bull SL Hit, -3=Bear SL Hit, 4=Bull TP Hit, -4=Bear TP Hit.
You can also use the external input as a custom source value for either dimension or global sources to further tailor the system to your liking.
The color scheme in this script utilizes two custom gradients that can be chosen for bar and background colors:
-> Trend (Dominant or Filtered) - A polarized gradient that shows green scaled values for bullish trend and red scaled values for bearish trend.
The colors are brighter and more vibrant as perceived trend strength increases.
-> Dimension - A thermal gradient that shows cooler colors when dimension is higher, and hotter colors when dimension is lower.
Both color schemes are dependent on the designated dimension thresholds.
The script comes equipped with alerts for entries, additional entries, exits, partial exits, and protective stops so you can automate more and stare at your charts less.
And lastly, the script comes equipped with additional external outputs to further your analysis:
-> Entry And Exit Signals - Outputs in the same format as the external signal input with these additions: 5=Bull Increase, -5=Bear Increase, 6=Bull Reduce, -6=Bear Reduce.
You can use these to send to other scripts, including strategy types so you can backtest your performance on TV’s engine.
-> Dominant Trend - Outputs 1 for bullish and -1 for bearish. Can be used to send trend signals to another script.
I designed this tool with individuality in mind.
Every trader has a different situation. We trade on different schedules, markets, perspectives, etc.
Analytical systems of basically any type are very seldom (if ever) “one size fits all” and usually require a fair amount of modification to achieve desirable results.
That’s why this system is so freely customizable.
Your system should be flexible enough to be tailored to your analytical style, not the other way around.
When a system is limited in what you can control, it limits your experience, analytical potential, and possibly even profitability.
This is not your typical pre-set system. If you're looking for just another "buy, sell" script that requires minimal thought, look elsewhere.
If you’re ready to dive into a powerful technical system that allows you to tailor the experience to your style, welcome!
-----------------------------------------------------------------------------------------------------------------------------------------------------------------
This is a premium script, and access is granted on an invite-only basis.
To gain access, get a copy of the system overview, or for additional inquiries, send me a direct message.
I look forward to hearing from you!
-----------------------------------------------------------------------------------------------------------------------------------------------------------------
General Disclaimer:
Trading stocks, futures, Forex, options, ETFs, cryptocurrencies or any other financial instrument has large potential rewards, but also large potential risk.
You must be aware of the risks and be willing to accept them in order to invest in stocks, futures, Forex, options, ETFs or cryptocurrencies.
Don’t trade with money you can’t afford to lose.
This is neither a solicitation nor an offer to Buy/Sell stocks, futures, Forex, options, ETFs, cryptocurrencies or any other financial instrument.
No representation is being made that any account will or is likely to achieve profits or losses of any kind.
The past performance of any trading system or methodology is not necessarily indicative of future results.
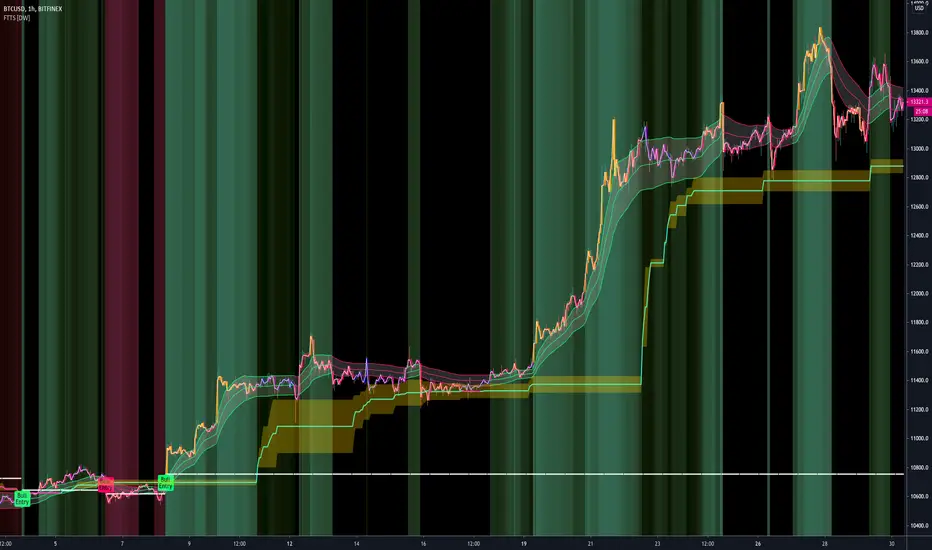
Full strategy AllinOne with risk management MACD RSI PSAR ATR MAHey, I am glad to present you one of the strategies where I put a lot of time in it.
This strategy can be adapted to all type of timecharts like scalping, daytrading or swing.
The context is the next one :
First we have the ATR to calculate our TP/SL points. At the same time we have another rule once we enter(we enter based on % risk from total equity, in this example 1%, at the same time, lowest ammount for this example is 0.1 lots, but can be modified to 0.01), so we can exit both by tp/sl points, or by losing 1% of our equity or winning 1% of our total equity. It's dinamic.
The strategy is made from
Trend direction :
PSAR
First confirmation point :
Crossover between 10EMA and Bollinger bands middle point
Second confirmation
MACD histogram
Third confirmation
RSI overbought/oversold levels
For entries : we check trend with psar, then once ema cross bb middle point, we confirm together with rsi level for overbought/oversold and macd histogram ( > 0 or <0).
We exit, when we have opposite sign, like from buy to sell or sell to buy, or when we reach tp/sl points, or when we reach % basaed equity points.
It can be changed to be fixed lots, or fixed tp/sl , you just have to uncomment the size from entries, and tp/sl lines.
At the same time, it has the possibility if one desires, to trade only concrete forex session like european, asian and so on for intraday trading.
Hope you enjoy it.
Let me know how it goes.

NN Trading SystemThis indicator is an attempt to be all-in-one solution that follows the structure of NNFX Youtube channel. The components may vary from trader to trader. This is my compilation. If you have any ideas to make it better, let me know.
Brief Info about the structure:
The trader chooses best indicators for the positions described below; enters and exits positions strictly based on the consensus of the indicators. Here are components:
1. Baseline (trend line): I usually use "Regression Line" indicator that can be found in the public library. If the price is above the baseline, look for longs; if the price is below the baseline, look for shorts. This part cannot be included in this indicator since it needs the indicator to be an overlay indicator. So choose and couple with your own.
2. Entry Signal: This is the main indicator that signals opening positions. I tested lots of indicators and finally chose LazyBear's MACD Leader Indicator. This is the modified version of it. When the signal line crosses over the zero line, it's a long signal. When the signal line crosses under the zero line, it's a short signal. You may also use the peaks of the hills it creates as a signal if you think it performs better. It's up to you. I have added dots for the possible peaks using "alma" cross algorithm.
3. Confirmation Signal #1: To open a position both the confirmation signals need to give a green signal. otherwise you are not allowed to open the position. Chosen indicator for this job is ATR. Set your minimum ATR value on the settings box and if the current ATR on the current timeframe is below the ATR value, a gray line will be drawn over the entry signal line and you should not take the trade. If you are already have a position, this doesn't mean that you should close the position though. It just informs you that momentum is low. YOU NEED TO ADJUST THIS ATR LIMIT FOR EVERY ASSET AND TIMEFRAME YOU TRADE. For BTC 1min, my example limit value is 8. Find your best value.
4. Confirmation Signal #2: I have chosen Aroon indicator for trend confirmations. If the background of the indicator is green, it's suitable for longs, if it's red, it's suitable for shorts. If the color is brighter, that means the signal is stronger. Aroon is a very powerful indicator but you need to find the best settings for the timeframe you are using.
5. Exit Signal: This one is the hardest role to find an indicator for. The one i ended up choosing is "Relative Vigor Index". It doesn't give good entry signals but with the right settings, it works as an exit signal in my experience. This signal is drawn as a green and red boxes and the top and the bottom of the indicator area. If it changes color while you have a position, it's time to close the position. Find the right settings for it so that every time it signals reversal, you obey the rule and close the position.
To summarise, the components are:
* ATR
* MACDL
* ALMA CROSSOVER
* AROON
* RVGI
plus
* a trend line indicator of your choice added seperately to your chart.
My recommendation is to turn all the indicators off on the settings box and enable on by one finding the best values individually. If you found the best settings for an asset and timeframe, please share in the comments for others.
You may leave a comment for bug reports, feedback and suggestions.
Hope it works for you.
Cheers.
