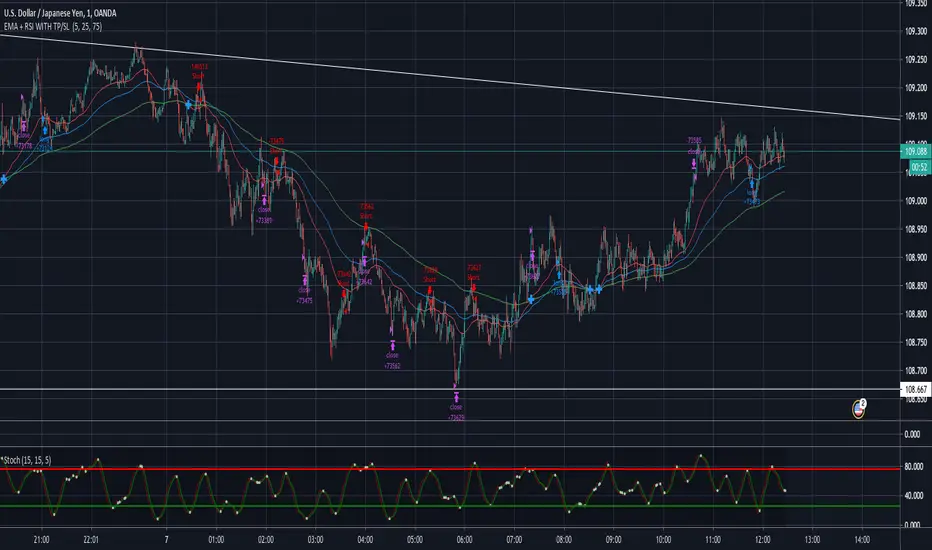
EMA + RSI WITH TP/SL 1 Minute scalping strategy
EMA 50 & EMA 200 dictate direction of entry
EMA 50 above EMA 200 = Long
EMA 50 below EMA 200 = Short
If Long and RSI crossover 25 = Long entry
If Short and RSI crossunder 75 = Short entry
Each trade is currently 1:1.3 risk to reward ratio.
15 pip TP
12 PIP SL
Any suggestions on further improvements /variations are more then welcome.
Trend
Fianchetto v1Hello, I created this script last year I decided I would release it to the public. This script uses Moving Averages to attack or defend price action given the current conditions of the market. This strategy is ONLY for currencies I would NOT recommend using on any other markets. This strategy is wrong about 55% of the time so use at your own risk. This strategy has 2 main focuses, 1. Catching trends and riding trends 2. Defending Profits from a Trend, as a trend starts to form you want to make sure you can get the most juice out of the trend while also ensuring profit taking throughout the trend. This algorithm uses moving averages in a more creative way than just trading crossover's, we use a small MA to use it's direction of travel as a traffic light while using a bigger MA as a filter for our trade bias (bear or bull). Our Traffic light or small MA is what ensures we are defending profits as when the traffic light switches colors we close our trade even if our filter is still the same bias. This however does not mean we are done trading the current trend wave, We wait for our traffic light to switch back to the same bias as our filter to re-enter the trade. I will be updating this system as time goes on, if you have any questions or problems please pm me, QuantsGambit

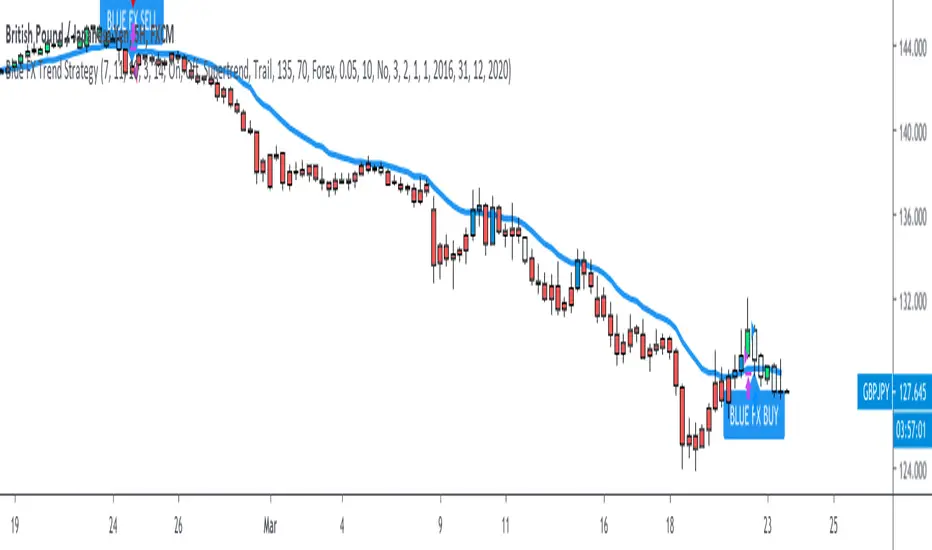
Blue FX Trend StrategyHi, welcome to the Blue FX Trend Strategy Script.
What does it do?
Our strategy will help you identify the current trend in the markets and highlight when this is changing. The strategy itself is based upon 4 indicators lining up in total confluence to increase the probability of the trade being a success, this is specifically an EMA, MACD settings, Supertrend criteria and also Momentum.
Absolutely no technical analysis is needed to trade this successfully - this can be used on all time frames and all pairs - obviously with varying profitability as all pairs work differently - this can be reviewed quickly in 'Strategy Tester' to hone in on your own desired settings.
When all criteria is in alignment the strategy will convert all candles to the relevant colour - Green for an uptrend and Red for a downtrend; a candle that is printed normally simply shows that no current trend is in place to warrant a colour change. A normal coloured candle could possibly indicate a change in current market direction or the market consolidating before a further move in the initial direction. When a new signal is valid 'Blue FX Buy'' or 'Blue FX Sell' will be displayed and the small arrow shown on candle open for entry.
How do I use it?
Our strategy is invite only - upon joining our group we will allow you access to the script. This will then simply display on your device ready for you to start trading from. There is substantial functionality within the strategy, you can;
See the success of the default settings in the past using the 'Strategy Tester' Function for numerous settings
1. Following the settings 'Trail'
2. Changing your TP function with the other criteria listed
3. Using a Fixed TP or SL function
Upon changing the Script to 'Fixed' you will see numerous trades on the chart displayed differently.
Scaling into a profitable position is also possible - this is ideally done when the candle colour confirms the trend is continuing after rejection/support from the EMA; we show this below;
You could also enter here if you missed the initial sell signal, we have MA rejection and a red printed candle indicating all confluences are in play and we have high probability for the move to continue.
How do I know its profitable?
We have built numerous customisable settings into the strategy for you to see that this is profitable - you can visually see this too. The settings are also customisable to find the right criteria for the right pair on the right time-frame. Ultimately, with the strategy confluences in place, you are putting probability in your favour and can quickly determine the trend in place if there is one. Within the customisable settings there is a compound function too, so if you were to compound your profit the results can be exceptional.
We have also added an H4 confluence, so you can ensure if trading on a lower time-frame you are in the overall direction of the H4 trend too, a useful setting for more confluence again.
Where do I set my Stop loss or Take Profit?
There is no right or wrong to this and we have attempted to build numerous ways of doing this into the strategy for reference.
For setting a SL you could;
1. Use a fixed SL.
2. Place the SL below the last high or low in the trend.
3. Use an ATR function.
4. Place the SL 5 pips below the last 3 candles.
5. Or, trail the price if you are on screen until the next signal is given and a new trend starts - although unless a big trend, you may miss out on some profit by the time price has pulled back.
For placing a Take Profit, you could;
1. Use a fixed TP.
2. Look for the next supply/demand area on the chart (if it breaks and candle colour supports direction - you could enter again).
3. Use an ATR function.
5. Or, trail the price if you are on screen until the next signal is given and a new trend starts - although unless a big trend, you may miss out on some profit by the time price has pulled back.
6. Secure multiple TPs - 20/50/100 pips with Stop loss to entry after the first target is hit.
Here are some examples of the Buy and Sell signals in action;
Will also work on Commodities and Indices as shown below too;
Our recommended visual settings are below;
1. Set to'Trail' Strategy
2. Under 'Style' tab, select Trades on Chart, but un-select both Signal Labels and Quantity to clean up the chart - these settings are useful when testing to see where the trades are opened and closed.
3. We like the candles changing colour to the trend and criteria set however, these can be turned off to display normal bullish and bearish candles.
When reviewing profitability you can do this by selecting 'Overview' 'Performance Summary' and 'List of Trades'.
Please consider that the settings based into the strategy could differ to your own money management rules and your management of your SL and TP as outlined above - we have tried to cover as many bases as possible here.
We look forward to you using this strategy to profit from the market, please share your feedback and results with us.
Kind regards
Blue FX Team
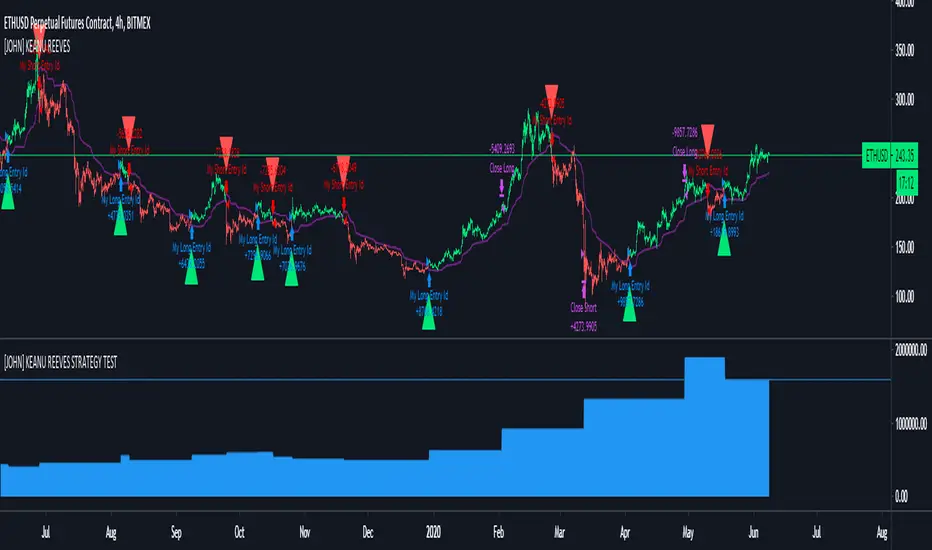
Trend Trader Strategy with MACDThis is plots the indicator developed by Andrew Abraham in the Trading the Trend article of TASC September 1998
The strategy I use has already been published explicitly by HPotter, you can review the core code from there.
I have converted the existing strategy codes that have been published into the strategy and the result looks great but I noticed that the indicator performed too much in short periods like 1 minute and I thought it would be healthier to get MACD approval. MACD approval will come selected by default. When the indicator reaches the buy status, if the macd histogram is positive, it enters the long process. By removing this confirmation from the settings window, you can see the normal signal frequency of the indicator.
This strategy is mainly based on trend signals. In fact, I am publishing this strategy to use in alternating trading for Bear-Bull crypto coins.
What does the bear-bull comparison mean?
You can open the same chart in the ETHBEAR / USDT symbol as opposed to the ETHBULL / USDT symbol that appears on the chart. When BUY signal comes in bull symbol, SELL will come in bear symbol. When BUY signal comes in bear symbol, SELL will come in bull symbol. In this way, very fast and very high profit can be obtained by alternating operation.

Trend StrategyThis is plots the indicator developed by Andrew Abraham in the Trading the Trend article of TASC September 1998
The strategy I use has already been published explicitly by HPotter, you can review the core code from there.
I have converted the existing strategy codes that have been published into the strategy and the result looks great.
This strategy is mainly based on trend signals. In fact, I am publishing this strategy to use in alternating trading for Bear-Bull crypto coins.
What does the bear-bull comparison mean?
You can open the same chart in the ETHBEAR / USDT symbol as opposed to the ETHBULL / USDT symbol that appears on the chart. When BUY signal comes in bull symbol, SELL will come in bear symbol. When BUY signal comes in bear symbol, SELL will come in bull symbol. In this way, very fast and very high profit can be obtained by alternating operation.

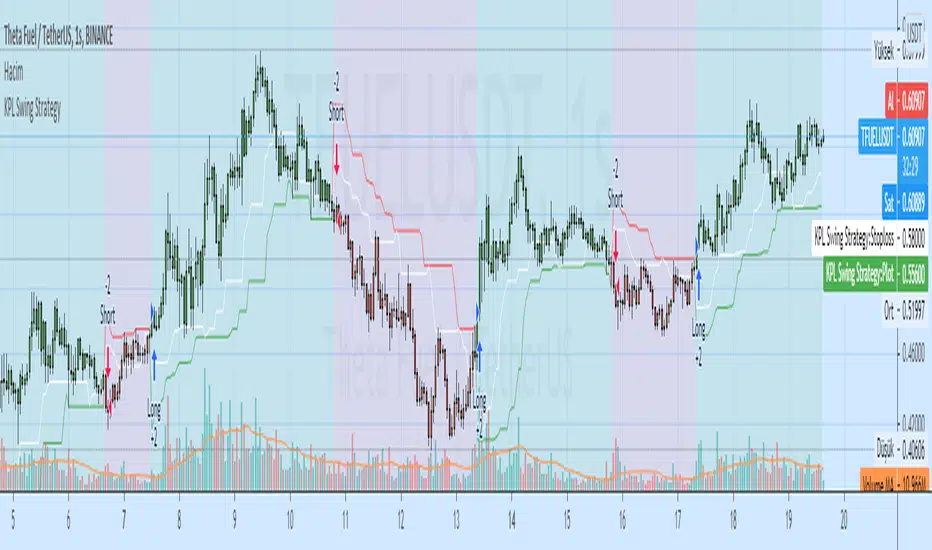
KPL Swing StrategyThe KPLSwing indicator is a simple trend following mechanical trading system which automates the entry and exit.
The trading system is extremely simple and easy to use and removes emotions from trading.
The trading or investing logic is simple.... buy on close above 20 days high and sell on close below 20 days low.
No targets are given as profits are unknown and is whatever the market gives. Losses are limited via position sizing.
FRAMA - Supertrend strategyFRAMA Strategy
I found this strategy on internet, in a well-known forex forum.
I have translated the two indicators mentioned in that strategy (originally in mq4) in pine script.
Thanks to Fractured and Shizaru for the FRAMA snippets, to mejialucas for Supertrend snippet, to JayRogers for trade management snippet and to Trost for backtesting snippet.
I also added some code to have FRAME with a deiiferent timeframe
Indicators set-up:
FRAMA period 24 (it was originally 25 but it's better to use an even number)
FRAMA timefarme lower then chart timeframe (e.g. daily chart and weekly FRAMA)
Supertrend indicator as it is.
Of course, it is better to adapt above setting to traded instrument.
Long/Buy rules:
1 - Enter at crossover between FRAMA and its signal
2 - Option to filter entries based on supertrend signal
3 - Exit when Supertrend change direction;
4 - Exit long when short signal occurs;
Short/Sell rules:
1 - Enter at crossunder between FRAMA and its signal
2 - Option to filter entries based on supertrend signal
3 - Exit when Supertrend change direction;
4 - Exit short when long signal occurs;
VERY IMPORTANT NOTE: this is a trend following strategy, so the target is to stay in the trade as much as possible (drawdown my be high). If your trading style is more focused on scalping and/or pullbaks, this strategy is not for you.
Credits to who developed this startegy (google it).
Thanks to all pinescripters mentined in the code for their snippets.
I have also a study with alerts.
Please use comment section for any feedback or contact me if you need support.

Trend Balance Point System by Welles WilderThis is the original Trend Balance Point System created by Welles Wilders in 1978, rules can be found in his book New Concepts in Technical Trading Systems.

Forex Daily Trading - NNFX StyleHere is my implementation of the No Nonsense Forex way of trading.
I've tried to apply most of VP's rules to the best of my coding abilities. As of now, with default settings, the strategy does not perform exceptionally well - however I'm pretty confident there is a combination of settings that will make it profitable across all pairs, and maybe even commodities.
If anyone can find some good performing settings for this strategy please let me know and I'll provide the full logic and all indicators within the strategy. Also, if you have any suggestions of any indicators you feel could improve this strategy let me know and I'll update.
If anything doesn't make sense/doesn't work, or if you just need some more information please just let me know. Enjoy!

Grover Llorens Activator Strategy AnalysisThe Grover Llorens Activator is a trailing stop indicator deeply inspired by the parabolic SAR indicator, and aim to provide early exit points and reversal detection. The indicator was posted not so long ago, you can find it here :
Today a strategy using the indicator is proposed, and its profitability is analyzed on 3 different markets with the main time frame being 1 hour, remember that lower time frames involve lower absolute price changes, therefore we are way more affected by the spread, and we can require a larger position sizing depending on our investment target, trading higher time-frames is always a good practice and this is why 1 hour is selected. Based on the result we might make various conclusions regarding the indicator accuracy and might have ideas on future improvements of the indicator.
I'am not great when it comes to strategy design, i still hope to share correct and useful information in this post, let me know your thoughts on the post format and if i should make more of these.
Setup And Rules
The analysis is solely based on the indicator signals, money management isn't taken into account, this allow us to have an idea on the indicator robustness and resilience, particularly on extremely volatile markets and ones exhibiting a chaotic structure, altho it is normally good practice to close any position before a market closure in order to avoid any potential major gaps.
The settings used are 480 for length and 14 for mult, this create relatively mid term signals that are suited for a trend indicator such as the Grover Llorens Activator, unfortunately we can't infer the indicator optimal settings, thats how it is with any technical indicator anyway.
Here are the rules of our strategy :
long : closing price cross over the indicator
short : closing price cross under the indicator
We use constant position sizing, once a signal is triggered all the previous positions are closed.
Description Of The Statistics Used
Various statistics are presented in this post, here is a brief description of the main ones :
Percent Profitability (higher = better): Percentage of winning trades, that is : winning trades/total number of trades × 100
Maximum Drawdown (lower = better) : The highest difference between a peak and a valley in the balance, that is : peak - valley , in percentage : (peak - valley)/peak × 100
Profit Factor (higher = better) : Gross profit divided by gross loss, values under 1 represent gross losses superior to the gross profits
Remember that more volatility = more risk, since higher absolute price changes can logically cause larger losses.
EURUSD
The first market analyzed is the Forex market with the EURUSD major pair with a position sizing of 1000 units (1 micro lot). Since October EURUSD is not showing any particular strong trend but posses a discrete rising motion, fortunately cycles can be observed.
The equity was rising until two trades appeared causing a decline in the equity. Before October a bearish market could be observed.
We can see that the equity is rising, the trend still posses various retracements that affect our indicator, however we can see that the indicator totally nail the end of the trend, thats the power of converging toward the price.
In short :
$ 86.63 net profit
340 closed trades
37.65 % profitable (thats a lot of loosing trades)
1.19 profit factor
$ 76.67 max drawdown
Applying a spread would create negative results (in general the average spread is used), not a great start...
BTCUSD
The cryptocurrency market is relatively more volatile than others, which also mean potentially higher returns, we test the indicator using certainly the most traded cryptocurrency, BTCUSD. We will use a position sizing of 1 unit.
In the case of BTCUSD the strategy balance is relatively stationary around the initial capital, with of course high dispersion.
from september to december the market is bearish with various ranging periods, no apparent cycles can be observed, except maybe in the ranging period of october, this ranging period is followed by a non linear trend (relatively parabolic) that the indicator failed to capture in its integrity (this is a recurrent problem and it is starting to piss me off xD).
In short :
$ 2010.64 net profit (aka how i bet the crypto market)
395 closed trades
38.23 % profitable
1.036 profit factor
$ 5738.01 max drawdown (aka how i lost to the crypto market)
AMD
AMD stand for Advanced Micro Devices and is a company focused on the development of computer technology, i love the microprocessor market and i really like AMD who start this year in a pretty great way with a net bullish trend.
The performance of the indicator on AMD is decent (at last !) with the equity producing many new higher highs. The indicator performance still drop in the middle end of 2019 with a large equity drawdown of 17$ caused by the gap of august 8. Unfortunately AMD, like lot of well behaving stocks can only tells us that the indicator has good performances on heavily trending markets with no excess of noise or chaotic structures.
In short :
$ 17.86 net profit (Enough for a consistent lunch)
295 closed trades
36.27 % profitable
1.414 profit factor
$ 10.37 max drawdown.
Conclusion
A strategy using the recently proposed Grover Llorens activator has been presented. We can easily conclude that the indicator can't possibly generate long term returns under chaotic and volatile markets, and could even produce unnecessary trades in trending markets without much parasitic fluctuations such as noise and retracements (think about a simple linear trend) since the indicator converge toward the price and would therefore automatically cross over/under the trend, thus guaranteeing a false signal.
However we have seen its ability to provide accurate early reversal detection shine from time to time, thus over performing lagging indicators in this aspect, however the duration of price fluctuations isn't fixed at a certain period, the rate of convergence should be way faster during volatile fluctuations, of moderate speed during more cyclic fluctuations, and really slow with apparent long term trends, this could be achieved by making the indicator adaptive, but it won't really make it necessarily perform better.
That said i still believe that converging trend indicators are really interesting and aim to capture the non lasting behavior of price fluctuations, they shouldn't receive so much hate (think about the poor p-sar).
Thanks for reading !

UT Bot Strategy with Backtesting Range [QuantNomad]UT Bot indicator was inially developer by @Yo_adriiiiaan
Idea of original code belongs @HPotter
I can't update my original UT Bot Strategy so I publishing new strategy with backtesting range included.
I just took code of Yo_adriiiiaan, cleaned it, deleted all useless pieces of code, transformet to v4 and created a strategy from it.
Also I added an input that allows you to swich to signals from Heiking Ashi. I saw that author uses HA for the indicator and on HA it look much nices then on real candles.
Do not add this strategy to HA candles, use usual candles and this checkbox.
Original script:
UT Bot

Donchian Breakout StrategyThis strategy buys when the Donchian Channel is broken to the upside and uses the lower Donchian Channel line as a trailing stop. You can also choose to use a moving average as a filter to keep you out of trades that are counter trend.
You can also configure which dates you want to backtest, so you can see how this behaves over specific time frames and market cycles.

UT Bot StrategyUT Bot indicator was inially developer by @Yo_adriiiiaan
Idea of original code belongs @HPotter
I just took code of Yo_adriiiiaan, cleaned it, deleted all useless pieces of code, transformet to v4 and created a strategy from it.
Also I added an input that allows you to swich to signals from Heiking Ashi. I saw that author uses HA for the indicator and on HA it look much nices then on real candles.
Do not add this strategy to HA candles, use usual candles and this checkbox.
Original script:

Market Structure Finder [Dzenis]This indicator is designed to help you visualize the high timeframe market structure breaks and shifts in trend.
It finds local swing highs and lows, and defines the market structure based on them.
Break above the blue line = market structure is bullish, look for long/buy
Break below the red line = market structure is bearish, look for short/sell
I wrote it as a strategy so it can be easily backtested, giving a more complete picture of its effectiveness for catching larger swings.
It works best in trending markets such as Bitcoin.
This specific backtesting strategy and buy/sell signals on the chart are meant for trading the spot markets.
Buy signal triggers the entry with 70% of the trading capital (can be adjusted in the indicator menu and backtested with different percentages).
Sell signal exits the position.
The results assume 0.1% trading fees by default (adjustable in the menu as well).
It does not repaint.
If trading the futures markets it can be used purely as an indicator to help you form a HTF bullish/bearish bias and look for trade setups accordingly.
Although it's not designed for intraday moves, it can be used on lower timeframes as well.
8h timeframe for swing trades.
1h timeframe for intraday setups.
Daily timeframe is still the suggested and main use of this indicator (forming high timeframe bias).
For any questions and inquiries, feel free to DM me.

[BERA] POWER STRATEGYHey below my new strategy test, hope you like.
Work better with BTC
H1 and H4 timeframe.
How this work?
RSI based script.
-Modified length and different metrics for long and short.
Moving Averages.
-RSI panel below with color labels to identify the rsi levels.
-Simple trailing stop included.
Entry orders and exit orders for both -long and -short.
The default setup is the best perfomance i've find testing it.
If you are interest in the script contact me.

DH: (Strategy) Super SmartSuper Trend: Backtest VersionSUPER SMART SUPERTREND (Strategy Version w/ Backtesting)
Across all time frames and assets I've tested, this indicator gives me better results... Better entries, better exits and well defined trends. In comparison with a STANDARD Supertrend, it is not radically different, but when it does differ "Super Smart SuperTrend" is almost always better.
This is the STRATEGY version of "Super Smart SuperTrend" ready for your backtesting. There is also a STUDY version with ALERTS which might be better for live trading if you want Alerts.
STUDY VERSION WITH ALERTS IS HERE
##################################
##################################
ABOUT THIS INDICATOR
As the name suggests, 'Supertrend' is a trend-following indicator that is notably popular here on Tradingview and elsewhere. It does a remarkably great job of recognizing a trend (in progress) and it will signal you to initiate a position when the trend is clear. Perhaps the greater value of Supertrend is that it helps keep you in your position until that trend is over.
WHAT'S THE BEST ATR PERIOD AND MULTIPLIER?
There are two important data points we must enter for Supertrend to work, namely the 'period (ATR number of candles or days)' and the 'multiplier (value by which ATR is multiplied)' BTW, in case you don't know, ATR signals the degree of price volatility. A common default setting is 10 for the ATR period and 3 for the multiplier.
SORRY, BUT THE MOVIE STARTED HALF HOUR AGO...
Unfortunately Supertrend has a couple of big weaknesses. Generally, it fails in a sideways-moving market and when it does detect a trend, the signal to get in (or out) comes rather late. It's like someone telling you about a great movie they're watching, but by the time you start watching, one-third of the movie is over... bummer, right?
HOW TO IMPROVE SUPERTREND
One solution is to combine Supertrend with other indicators such as MACD, Parabolic SAR, RSI, etc. And another solution is to experiment (backtest) with the Period and Multiplier settings for the asset and timeframe you are considering for trade.
For the STANDARD SETTINGS in this "Super Smart SuperTrend" indicator, I have set 9 for the ATR and 2.2 for the multiplier as default after backtesting on Bitcoin and other crypto (mostly in the 15 minute to 6 HOUR timeframe). Of course you can change this easily to any ATR period and Multiplier you like.
BUT... WHY NOT GET SMART?
I started thinking, it might be best if we let the market determine candle-by-candle what the settings should be. If everyone says that Supertrend works best in conjunction with other indicators, why not do our "conjuncting" programmatically (ie: automatically) sorta like artificial intelligence!
HOW IT WORKS
So here's what I did. Using data from other indicators I came up with a SMART SUPERTREND that auto-adjusts as the market changes. It still has settings so you can fine tune it for specific assets and timeframes, but once the settings are entered, it auto-adjusts as the market and prices evolve.
With "Super Smart SuperTrend" there is no ATR period setting (that is determined programmatically) and now there are TWO multipliers you can experiment with... (a lower one set at 1.7 default and a higher one at 2.5). These multiplier settings create a multiplier range that can be used programmatically to adjust the multiplier as the market and prices evolve.
THE RESULTS
Across all time frames and assets I've tested, I generally get better results. Better entries, better exits and well defined trends. In comparison with a STANDARD Supertrend, it is not radically different, but when it does differ "Super Smart SuperTrend: is almost always better. All this is substantiated by backtesting of course.
SAMPLE BACKTEST RESULTS (BTC/USD)
*Using Indicator Defaults*
TIMEFRAME STANDARD RESULTS SUPER SMART RESULTS
% Profitable | Profit Factor % Profitable | Profit Factor
DAY 58.33% 9.38 75.00% 10.77
4 HOUR 78.43% 18.22 80.95% 21.78
1 HOUR 74.11% 8.98 70.13% 9.34
15 MIN 58.10% 6.10 71.43% 9.48
Keep in mind that "Profit Factor" is key. It basically tells you what you'd make for every ONE DOLLAR invested by consistently trading with the backtested parameters.
SUPER SMART SUPERTREND FEATURES
• There is a STUDY VERSION w/Alerts
• There is a STRATEGY VERSION for Backtesting
• Standard 'Current Time Frame' SuperTrend Line
• Standard 'Higher Time Frame' SuperTrend Line
• Auto-Adjusting Dynamic Optimized SuperTrend Line
> Most Signals Are Same or Better than Standard
> Refine Results w/Sensitivity Inputs (2 Multipliers)
> Impressive Comparison Backtests
• Both Standard and Smart Signals and Alerts
• Toggle Any Line/Signal (On/Off)
• Toggle Backtest
> Standard vs. "Smart Auto-Adjust"
> Backtest Higher Timeframe Only
WHAT MORE COULD YOU ASK FOR?
So glad you asked. Actually, there is more... Super Smart SuperTrend is incorporated into my premier indicator set called: STONEHENGE PLUS: SUPERTREND TRADING TOOLKIT.
By combining Super Smart SuperTrend with dozens of other indicators plus the predictive "Stones" of Stonehenge, you'll be in Trader's Heaven.
That's it. Get "SMART" Today!
STONEHENGE PLUS:
The Complete SuperTrend Trading Toolkit
#################################
#################################
SUPER SMART SUPERTREND ALSO WORKS WITH:
STONEHENGE BASIC: Double Stone Version (Study w/Alerts):
PLEASE HIT THE LIKE BUTTON (and follow me... lots of great stuff in the works!)
As always, I appreciate your support. Please share with others.
ENJOY!
Dan Hollings
Master Crypto Grid Trader
Stonehenge Master Mason
Host of the "High Leverage Lounge"
Please Explore My Other Indicators, Scripts, Grids and Educational Ideas.
@DanHollings on Tradingview.
Additional Links Below...

Strategy based on the principles of Price ActionIt is considered the percentage of candles with low and high closure for a certain period. Then, a moving average is built from these values. When the moving average of the ratio of tall candles to low candles is greater than the ratio of low candles to high, then long (that is, when the green line crosses the red). And vice versa - a condition for short. It also works on crypto with other settings. Idea for improvement: you can make partial exit by taking, at certain profit levels, the chart will be more stable. Result with a commission of 0.004% You can create an optimizer, and use this strategy on any liquid asset. (Sorry for google translator)

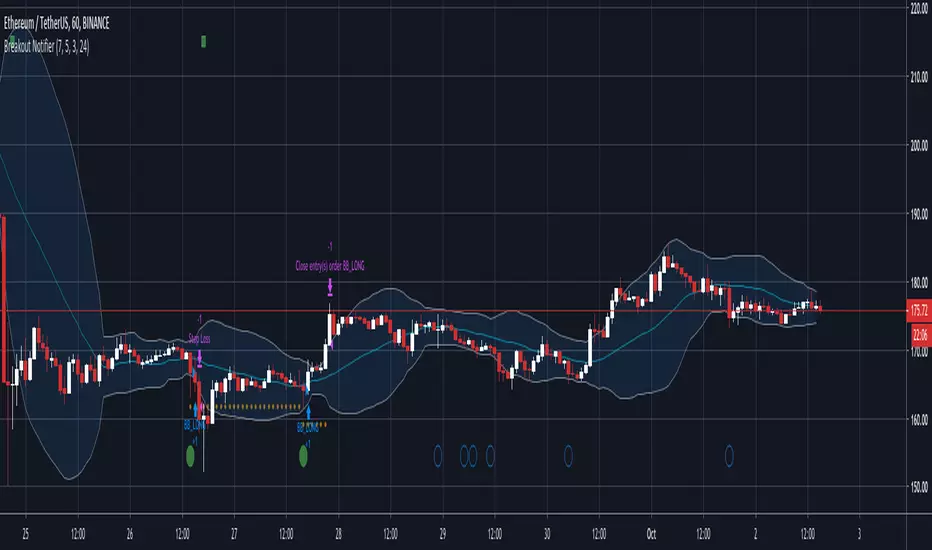
Breakout Notifier LONGLong trades based on our breakout logic, params you can configure are Stop Loss and breakout % to track
IDrawCharts 6HR Pivot StratThis is a pretty basic script, designed to work on the 6HR XBTUSD chart. Nothing special, but it does a decent job of catching mid-term (1-2 week) trends. It is not optimized to be profitable on other timeframes by itself, but can be used as a confluence indicator.

QuarryLake v4As some of you requested, I will make the code for QuarryLake Open for you all.
I have also updated the script in version 4.
This strategy consists of 3 indicators that I found works quite well together.
Keltner Channel, Waddah Attah Explosion, and Volatility Stop .
KC Period = 200
KCATR = 5
Vstop Period = 3
Vstop Mult = 1.5
Long when close > KC, close > Vstop, WAE trendUp
Short when close < KC, close < Vstop, WAE trendDown
Works well on BTCUSD XBTUSD , as well as other major liquid Pair.
This strategy utilized a modified Kelly position sizing for BTCUSD Bitstamp , feel free to modify it to your needs.
And lastly,
Save Hong Kong, the revolution of our times.

SELO Triangular WaveBased on master indicator creator @AlexGrovers scripts i just combined some of his work.
Result depends on settings and pairs and is not forward tested yet although the backtest can give some good results.

GetTrend Strategy (modified & ported to PS4)This is a port to PS4 of an amazingly simple solution that may have good prospects as a standalone indicator, an add-on or an integral part of a trading system. Many thanks to its authors and contributors.
