Heikin Ashi + Price Action Crypto LONG StrategyThis is a simple and efficient crypto strategy, designed for big timeframes like 12/24h.
On history it beats buy and hold strategy in many ocasions, and because of a low DD, pyramid can be used to elevate our winnings while still keeping a low DD < 40% avg.
For the purpose of this example, I used 100% of the capital on each trades, together with a comission of 0.1%
Warning : THERE IS NO STOP LOSS ON THIS STRATEGY ,USE IT AT YOUR OWN RISK
This strategy is made with inside Heikin Ashi candles , together with some price actions logics like for long Close > High and green candle and High > High .
We exit when we have a red candle and the current close is lower than the previous Low
If you have any questions, message me in private !
Trend Analysis

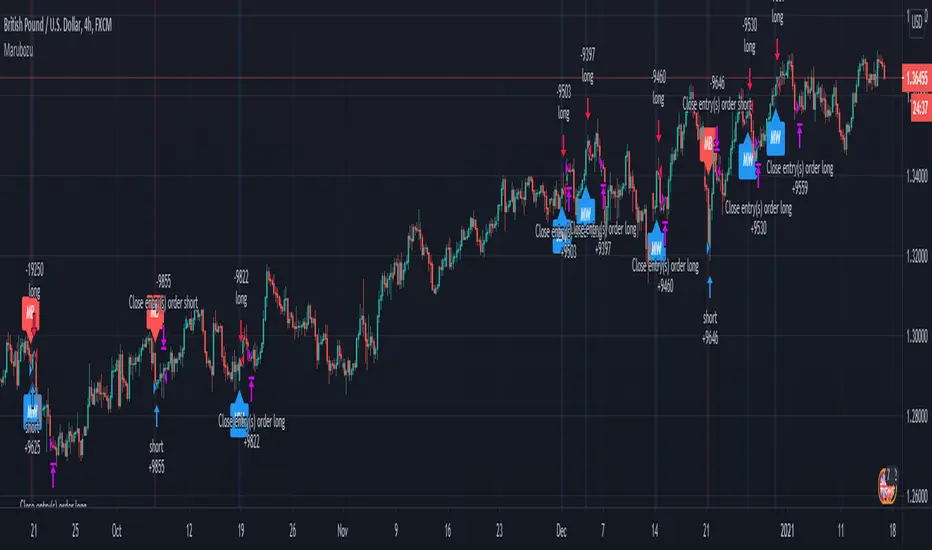
Marubozu Forex Price actionHi, today I bring you a price action strategy/indicator for Forex, made out for Marubozu candle type.
For the entries of it check if we have a long or a short marubozu.
For exit we have for long when the actual candle is green and the last previous two were red.
For exit we have for short, when the actual candle is red and the last previous two were green.
If you have any questions private message me !
London Breakout/Session GBP/USD Forex DaytradeThis is a forex strategy suited for day traders, specialized in the london breakout session
The key elements for this strategy are the specific london time session, together with an exit time(before asian trade/at the end of new york session).
At the same time, as logic elements we only use price action inside like :
For long we have 3 ascending candles, and for short we have 3 descending candles.
For exit we have both TP/SL based on price percentage movement, or we exit if we reach the end of the day.
If you have any questions message me in private !

Heikin-Ashi Change Strategy/ Indicator
Today I bring you a simple and efficient indicator/strategy based only on HA.
Can be used together with other TA tools or alone.
The idea behind is simple :
We have to forms to calculate the candle, using inner HA candles or normal candles. Once we have that we apply certain rules to get the max high, min low, open and close(ohlc)
With that then we check for changing in the patters like for example
For long close is higher than open and the previos close is lower than open. For short is going to be the opposite of long condition.
For the purpose of this example, I only use long direction and exit once we have the short signal.
If you have any questions, please let me know in private chat !

Strategy - Profit Maximizer by PMaxIt is a small modification to the "Profit Maximizer Max" script to make it a strategy by date range.

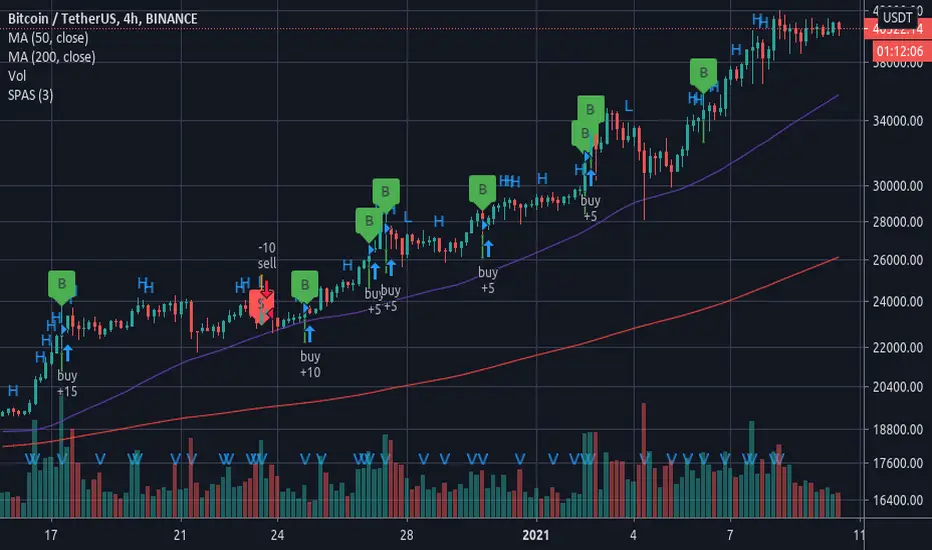
SPAS - Single Price Action StrategyThis strategy is based on a single price action analysis, where volume and price changes will trigger buy and sell orders. This strategy also can be used in combination with alerts to trigger orders in other exchanges or systems.
Best performance is currently achieved using 4H timeframe.
Ultimate Oscillator [Long] StrategyAfter I published Short Selling strategy with RSIofUO , I have been working for Long side strategy with same indicator.
but for Long strategy , I have used only the Ultimate Oscillator ... (Not the RSI of UO)
Logic behind this is , when UO goes below oversold level , high chance of possible reversal from there ...
Ultimate Oscialltor values , I have used are 5, 10 and 15
Signal Line 9
Above values are best/defaulted based on testing the strategy multiple symbols
BUY
when UO crossing up buyLine and close > open ( if the cross over is already done , it will wait for 3 candles to see a green bar i.e close>open )
Note when the bar color changes to orange , that means startegy is ready to take LONG position on next bar. But dont jump here , waith for the startegy take the Long Position :-)
Add
Signal appears when there is divergence (marked in yellow color ) ... strategy doesnt add the position , it is ony indicating you could add to existing OR if you missed the BUY signal you could enter here
Partial Exit
when UO crossing down partial exit level
Exit
When UO crossing down sell line
StopLoss
stop loss defaulted to 3%
Please note , I have slightly modified stop loss exit in this strategy.
Even though price hits 3% stoploss , strategy wont wind up the position ...
First , it will check if RSIofUO is above 30 , then it will hold on to the Long position.
Very reason behind this is , price is falling down and UO is going up ... That means there is bullish divergence here .. so it might turn this losing position to profitable one or will exit you with less than 3% loss.
Tested with SPY , QQQ , TSLA on 30mins to 4hrs. Though winning rate is average , net profit is exponential ...
Best working on 30 mins and 1 HR chart for QQQ
Warning
For the eductional purposes only ...
This is not a financial advise , before taking trading decission please do your own research

Follow the Trend - Trade PullbacksKindly follow the rules stated below for entry, exit and stop loss. Not every Buy / Sell signal will be profitable.
Timeframe of the chart acts as current timeframe. You need to choose 2 more as middle and higher timeframes.
This indicator is based on candlesticks, ATR and CCI indicators and the logic provides buy / sell signals at the pullbacks of the trend depicted by higher timeframe, that must be respected throughout.
Enter the long / short trade respectively when the indicator gives buy / sell signal after price has gone below the green / above the red line for higher timeframe.
Stop loss shall be low / high of recent swing. Exit when the price closes below / above the middle timeframe, to be used as trailing target.
Use it for any instrument for any timeframe of your choice.
For example, check the shared chart. It is a 1 min intraday, but the indicator can be used for short or long term positional trades as well.
Enter long at 14102, with stop loss 14077. Trailing target is achieved at 14156 giving a Risk:Reward ratio of 1:2.
Another Buy signal is observed around same level and uptrend continues till day end, again for a Risk:Reward ratio of approx. 1:2.
Rules to follow for Long trades -
Enter long position at Buy signal given after price has moved below green line of higher timeframe.
Exit the position when price closes below orange / blue line of middle timeframe.
Stop loss must be at low of recent swing, appearing just before the Buy signal.
Rules to follow for Short trades -
Enter short position at Sell signal given after price has moved above red line of higher timeframe.
Exit the position when price closes above orange / blue line of middle timeframe.
Stop loss must be at high of recent swing, appearing just before the Sell signal.

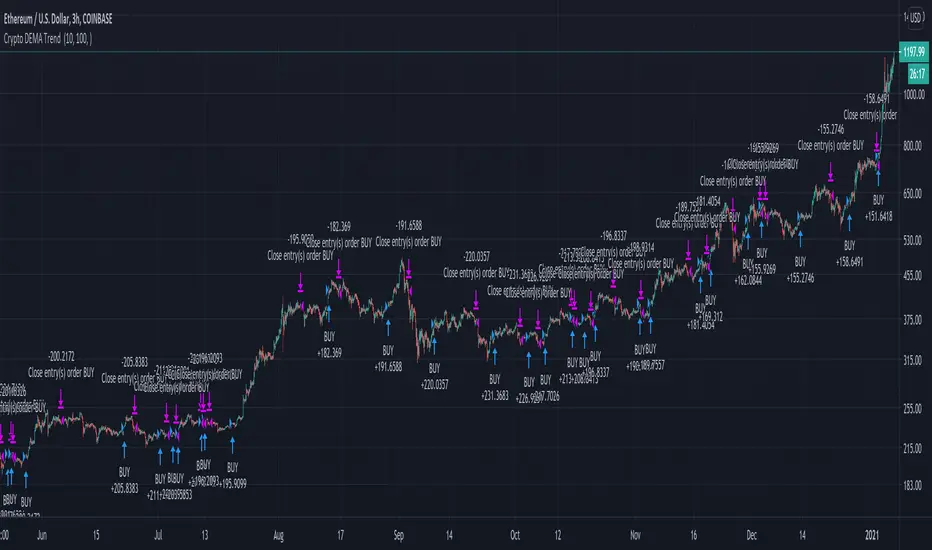
Best Crypto DEMA Strategy Long onlyThis is a crypto strategy suited for big time frames like 3h+.
THIS IS A LONG ONLY STRATEGY , SUITED TO BEAT BUY AND HOLD !
It's a very risky strategy because it has no stop loss at all, so be extremely careful with it.
This strategy is made of 2 DEMA a fast and a slow one.
We have two rules : entry it's when we have a crossunder between the slow DEMA and the fast DEMA. We exit when the opposite happens, in this case, when the slow is above fast.
For this example I used an initial capital of 1000 eur, using 100% of it always, and a commission of 0.2% per each deal.
Crypto Long only Strategy 3h+ timeframeToday I bring another crypto strategy that works greatly with pairs like BTCEUR, ETHEUR, for 3h+ time frames.
Its a risky strategy because we have a hard stop loss of 25% of our capital which can be modified.
The idea behind its simple, we have a candle which is made from open+high+low+close / 4 , and we make the decision based on this one.
We only go long with this strategy .
For entry: if we have 5 ascending candles we enter, and we exit when we have 4 descending candles.
For this example, I used 100% of the initial capital(1000 EUR/USD), with a commission of 0.1% per each deal.
At the same time, the max capital that can be lost in a trade is going to be the equity risk, in this example 25% .
Overall we can see that's more or less around the same level as buy and hold strategy

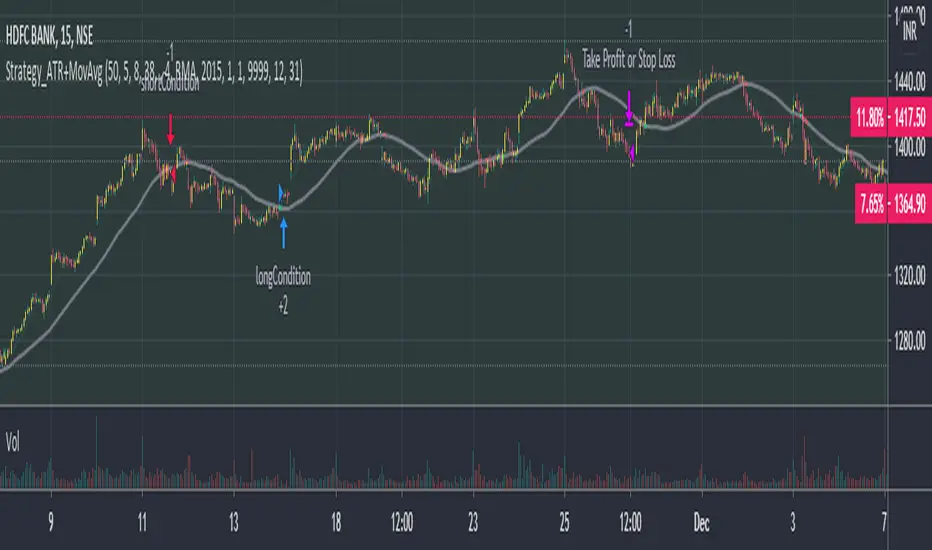
Phoenix085-Strategies==>MTF - Average True Range + MovAvgFIRSTLY, Here are a few who have influenced my pinescripting immensely recently:
@JustUncleL
@BigBitsIO
@TheArtofTrading
@QuantNomad
@SquigglesNiggles and many many many more.
Overview:
> This indicator is a simple crossover of Moving Averages.
> In addition I am using ATR rising as an indication for Trending Price.
> The entry is made once the smaller moving average crosses the bigger moving average, and also the Closes above the Smaller moving average.
> but the only twist here is,
- the ATR source is One timeframe Higher(In this case same as the session).whereas the source for the Moving averages is one Timeframe Lower.
>i.e., if the Session is 1D, the Indicator checks if the ATR is rising in the DAILY TIMEFRAME,
*_* the trade entry is made once the MOVING AVERAGE crossover happens on ONE TIME FRAME lower, as per example, ATR --> 1D = MA -->4H.
> Moving Average ->
- Thick -> Bigger MA,
- Thin and Transparent -> Smaller MA,
> Also, the Color of the Thicker MOVING AVERAGE Changes as Below:
- When LongCondition is satisfied --> Color=Lime
- When ShortCondition is satisfied --> Color=Red
- When neither condition is satisfied --> Color=Gray
NOTE:
1) There is a limitation in using the Securities function for FREE USERS --> Only 500 bars are allowed. So to use the indicators with more data, you need an upgraded TV account.
2) Strategy still needs Fine tuning, but for now, use the Thicker moving average color LIME FOR LONG ENTRIES and RED FOR SHORT ENTRIES.
This is Free for Use and share
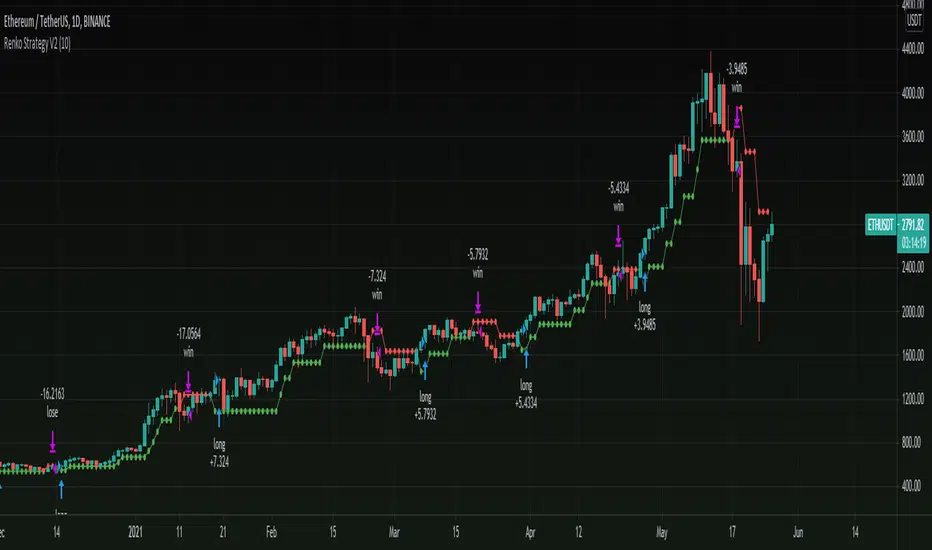
Renko Strategy V2Version 2.0 of my previous renko strategy using Renko calculations, this time without using Tilson T3 and without using security for renko calculations to remove repaint!
Seems to work nicely on cryptocurrencies on higher time frames.
== Description ==
Strategy gets Renko values and uses renko close and open to trigger signals.
Base on these results the strategy triggers a long and short orders, where green is uptrending and red is downtrending.
This Renko version is based on ATR, you can Set ATR (in settings) to adjust it.
== Notes ==
Supports alerts.
Supports backtesting time ranges.
Shorts are disabled by default (can be enabled in settings).
Link to previous Renko strategy V1:
Stay tuned for version V3 in the future as i have an in progress prototype, Follow to get updated:
www.tradingview.com
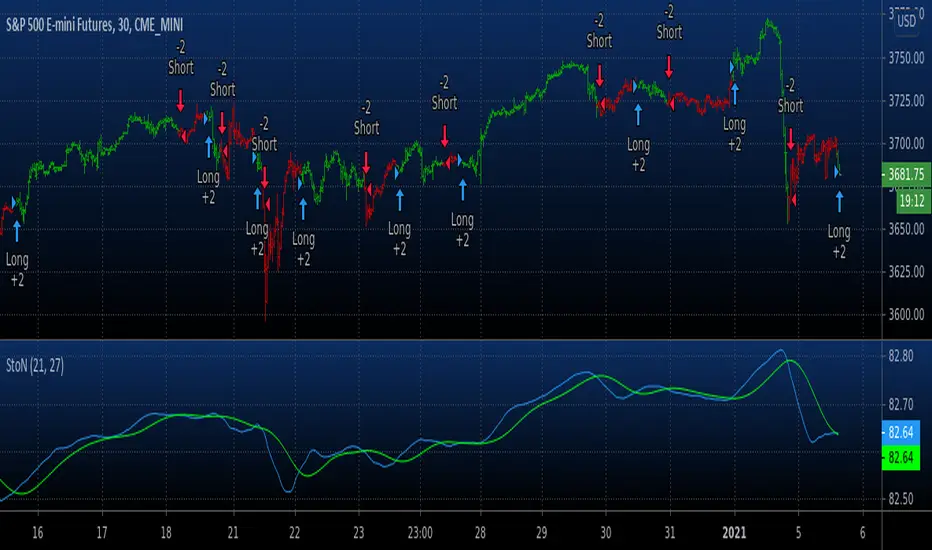
Backtest Signal To Noise This source code is subject to the terms of the Mozilla Public License 2.0 at mozilla.org
© HPotter 05/01/2021
The signal-to-noise (S/N) ratio.
And Simple Moving Average.
Thank you for idea BlockchainYahoo
WARNING:
- For purpose educate only
- This script to change bars colors.
Buy - Take Profit OR Stop Loss % BasedScript looks back for a certain period of time and than enter when price close above that look back period ema. Once enter it does not care for how many times price cross above or below. Once entered, it will either hit percenatage based take profit of stop loss.

OBV Pyrthe pyramide strategy based on coinrule script
the strategy is based on OBV scalper that i publish in past
seems very proftible for btc but the question is if this is because it bullish now
if i remove the filter then it will lose but the filter make it very profitable
wish all members best new year
this script work best for 1-5 min chart

Relative Returns StrategyLooks like an ultimate strategy for buy and hold investors.
This is designed based on the indicator :
Converting that into strategy with little optimization yield this. One change here is, instead of using the return percentage directly, we are using moving averages on both of them.
Buy condition : Moving Average on stock return crosses over that of index return.
Sell condition : Moving Average on stock return crosses under that of index return.
