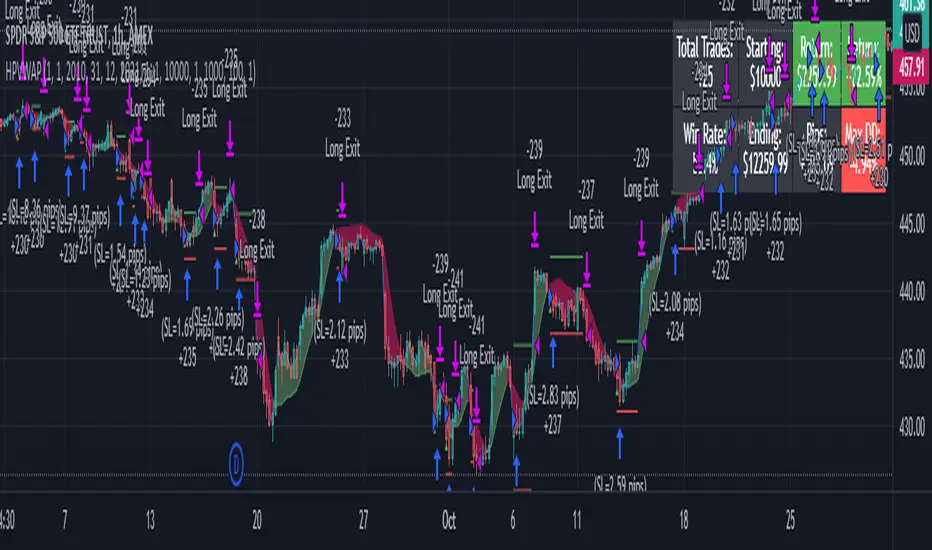
One of the questions hobbyist traders more often ask is: what is the perfect trading indicator? Every indicator is just a tool, so its efficiency is proportional to your ability to read its signals and translate them into an actionable trading strategy. The RSI is likely the most flexible and easy to use among the technical indicators. This trading strategy...
Strategy used in the CDI community that consists of having as a signal to enter long when it crosses the entire Ichimoku cloud . It is recommended to use the strategy in one hour candles and the profit / loss ratio is 2 to 1 for swing trading, however it can be used at any time frame. The purpose is to perform a bakctesting quickly by setting the limit and stop...
Started with the Basic Ichimoku strategy from Mizuki32. Added Take Profit, Stop Loss (for both long and short), and a toggle to wait for confirmation from the cloud.
This startegy uses Fib level (0.618) of Bollinger Band for long entry. I find this is the only strategy which gives similar results on the different time frames. I have tested QQQ for 1H, 2H , 3H and 4H charts , all showed over 70% winning rate. BB settings 50 , mult 1.5 (or you can use 2.5 or 3 ) Note: for the basis I have used VWMA instead of SMA...
This strategy uses the tradingview built in candlestick recognition.
This strategy combines Kaufman's Adaptive Moving Average for entry with optional KAMA, PSAR, and Trailing ATR stops for exits. Kaufman's Adaptive Moving Average is, in my opinion, a gem among the plethora of indicators. It is underrated considering it offers a solution that intuitively makes a lot of sense. When I first read about it, it was a real 'aha!'...
Doncian Channels is a trend tracking indicator developed by Richard Doncian. The upper line of the channel is determined by the highest value seen by the price in the defined period, the lower line of the channel is determined by the lowest value seen by the price in the defined period. The middle line takes the average value of the lower and upper channels. ...
Hello Traders As most of you know, I'm a member of the PineCoders community and I sometimes take freelance pine coding jobs for TradingView users. Off the top of my head, users often want to: - convert an indicator into a strategy, so as to get the backtesting statistics from TradingView - add alerts to their indicator/strategy - develop a generic strategy...
The core idea of this grid tool is that you have to concentrate less on the trade entries (this happens automatically time-independent but price-dependant) but rather on the validity of the macro trend. Exiting a trend when it is no longer valid is more important than entering a trade. But as long as the trend is valid, the trader participates exponentially in the...
Abstract This script points out the positions a lagging span leaves a Bollinger Band. This script does not plot a lagging span but moves the Bollinger Band forward. You can find profit opportunities by combining this script and risk management. Introduction Bollinger Bands is a popular indicator. It contains a moving average, an upper band and a lower band. The...
This strategy uses the RSI on MACD indicator. BUY ==== When RSI indicator crossing over 30 or 35 line and price above slow ema Note: when the position already taken, you may reenter on the purple candle Partial Exit ========== Partial profit taking option is available in settings. If this is selected , 1/3 position exited when RSI indicator crossing...
Hi! :) This strategy is made for intraday trades, especially on 5 sec - 5 min charts to follow the trend. I have not tested on higher timeframes, but feel free to play with the values. I have set a basic value for the 3 SMA at -200 -400 -600 We will use an oscillator for entries which is not mine. Link -> The oscillator mentioned above is just for...
The proposal of this script is to show the possible trading points of BUY and SELL based on the 15-minute chart of the Nasdaq Future Index. The start point of the strategy was schedule for 2021/01/01 and until the time of this publication (2021/01/31), for 1 index contract the results presented area a Gross Profit of 2.97% with a Net Profit of 1.35%. █ FEATURES...
This is combo strategies for get a cumulative signal. First strategy This System was created from the Book "How I Tripled My Money In The Futures Market" by Ulf Jensen, Page 183. This is reverse type of strategies. The strategy buys at market, if close price is higher than the previous close during 2 days and the meaning of 9-days Stochastic Slow...
This script uses KC and a T3 moving average A red background is a bear market A bull market is when the background is green The main idea is the average of the bend and KC channel breakthrough 这个脚本使用了KC以及T3均线 背景为红色时是熊市 背景为绿色时是牛市 主要思路是均线的拐头以及KC通道的突破
This is the initial version of the Heikein Ashi Strategy. It calculates the Heiken Ashi values for the candlestick charts displayed on the screen and generates alerts/trades based on the actual value in the candlestick chart.
This is combo strategies for get a cumulative signal. First strategy This System was created from the Book "How I Tripled My Money In The Futures Market" by Ulf Jensen, Page 183. This is reverse type of strategies. The strategy buys at market, if close price is higher than the previous close during 2 days and the meaning of 9-days Stochastic Slow...