Sen Regression ChannelSen Regression Channel
OVERVIEW
The Sen Regression Channel is a trend-structure visualization tool built on the Theil–Sen estimator, a median-based regression method designed to reduce sensitivity to price outliers. Unlike traditional least-squares regression channels, this approach anchors trend using the most representative slope across the lookback period, resulting in a more stable and noise-resistant structure.
TECHNICAL LOGIC & ORIGINALITY
To protect the proprietary implementation of the median-slope engine and adaptive band construction, this script is published as Protected.
Median Slope Engine
Calculates the Theil–Sen slope by evaluating the median rate of change across the lookback window, producing a trendline less distorted by extreme candles or transient volatility.
Adaptive Volatility Bands
Channel width can be derived from either Standard Deviation or ATR, allowing the envelope to adjust dynamically to changing volatility regimes.
Multi-Reference Context (Optional)
VWAP and EMA/SMA overlays can be enabled to compare the median regression structure against commonly used price and volume-weighted references.
HOW TO USE (EDUCATIONAL)
This tool is designed to help analyze trend quality and market structure, not to generate trade signals.
Trend Direction & Stability
A sustained upward or downward slope of the median regression line indicates directional structure with reduced noise sensitivity.
Volatility Expansion Zones
Price closing outside the channel bands highlights volatility expansion relative to the median trend and may signal regime change.
Mean-Reversion Context
Price oscillation between the median line and bands reflects balanced conditions; movement toward the outer bands indicates relative extension.
VWAP Confluence
Alignment between the regression midline and VWAP may highlight areas of consensus value.
USER INPUTS
Lookback Period – Sets the window for the median slope calculation
Band Multiplier – Scales the channel width
Band Method – Standard Deviation or ATR-based envelope
Visual Overlays – Toggle VWAP, midline, and cloud transparency
NOTES
This script is a historical charting and visualization tool for educational purposes only.
It does not provide trade signals, alerts, or financial advice.
All values are calculated in real time using available chart data.
Trendchannels
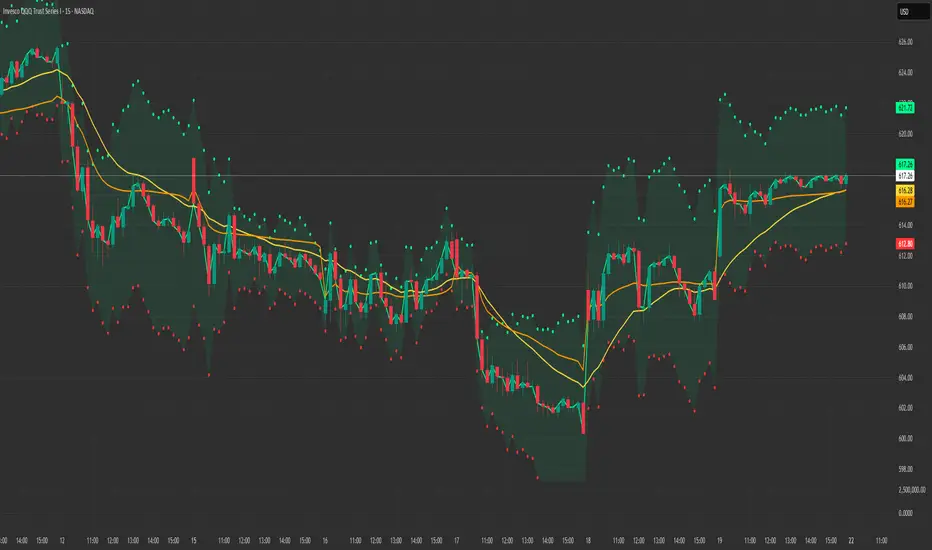
Trend Impulse Channels (Zeiierman)█ Overview
Trend Impulse Channels (Zeiierman) is a precision-engineered trend-following system that visualizes discrete trend progression using volatility-scaled step logic. It replaces traditional slope-based tracking with clearly defined “trend steps,” capturing directional momentum only when price action decisively confirms a shift through an ATR-based trigger.
This tool is ideal for traders who prefer structured, stair-step progression over fluid curves, and value the clarity of momentum-based bands that reveal breakout conviction, pullback retests, and consolidation zones. The channel width adapts automatically to market volatility, while the step logic filters out noise and false flips.
⚪ The Structural Assumption
This indicator is built on a core market structure observation:
After each strong trend impulse, the market typically enters a “cooling-off” phase as profit-taking occurs and counter-trend participants enter. This often results in a shallow pullback or stall, creating a slight negative slope in an uptrend (or a positive slope in a downtrend).
These “cooling-off” phases don’t reverse the trend — they signal temporary pressure before the next leg continues. By tracking trend steps discretely and filtering for this behavior, Trend Impulse Channels helps traders align with the rhythm of impulse → pause → impulse.
█ How It Works
⚪ Step-Based Trend Engine
At the heart of this tool is a dynamic step engine that progresses only when price crosses a predefined ATR-scaled trigger level:
Trigger Threshold (× ATR) – Defines how far price must break beyond the current trend state to register a new trend step.
Step Size (Volatility-Guided) – Each trend continuation moves the trend line in discrete units, scaling with ATR and trend persistence.
Trend Direction State – Maintains a +1/-1 internal bias to support directional filters and step tracking.
⚪ Volatility-Adaptive Channel
Each step is wrapped inside a dynamic envelope scaled to current volatility:
Upper and Lower Bands – Derived from ATR and band multipliers to expand/contract as volatility changes.
⚪ Retest Signal System
Optional signal markers show when price re-tests the upper or lower band:
Upper Retest → Pullback into resistance during a bearish trend.
Lower Retest → Pullback into support during a bullish trend.
⚪ Trend Step Signals
Circular markers can be shown to mark each time the trend steps forward, making it easy to identify structurally significant moments of continuation within a larger trend.
█ How to Use
⚪ Trend Alignment
Use the Trend Line and Step Markers to visually confirm the direction of momentum. If multiple trend steps occur in sequence without reversal, this typically signals strong conviction and trend persistence.
⚪ Retest-Based Entries
Wait for pullbacks into the channel and monitor for triangle retest signals. When used in confluence with trend direction, these offer high-quality continuation setups.
⚪ Breakouts
Look for breakouts beyond the upper or lower band after a longer period of pause. For higher likelihood of success, look for breakouts in the direction of the trend.
█ Settings
Trigger Threshold (× ATR) - Defines how far price must move to register a new trend step. Controls sensitivity to trend flips.
Max Step Size (× ATR) - Caps how far each trend step can extend. Prevents runaway step expansion in high volatility.
Band Multiplier (× ATR) - Expands the upper and lower channels. Controls how much breathing room the bands allow.
Trend Hold (bars) - Minimum number of bars the trend must remain active before allowing a flip. Helps reduce noise.
Filter by Trend - Restrict retest signals to those aligned with the current trend direction.
-----------------
Disclaimer
The content provided in my scripts, indicators, ideas, algorithms, and systems is for educational and informational purposes only. It does not constitute financial advice, investment recommendations, or a solicitation to buy or sell any financial instruments. I will not accept liability for any loss or damage, including without limitation any loss of profit, which may arise directly or indirectly from the use of or reliance on such information.
All investments involve risk, and the past performance of a security, industry, sector, market, financial product, trading strategy, backtest, or individual's trading does not guarantee future results or returns. Investors are fully responsible for any investment decisions they make. Such decisions should be based solely on an evaluation of their financial circumstances, investment objectives, risk tolerance, and liquidity needs.

Curved Trend Channels (Zeiierman)█ Overview
Curved Trend Channels (Zeiierman) is a next-generation trend visualization tool engineered to adapt dynamically to both linear and non-linear market behavior. It introduces a novel curvature-based channeling system that grows over time during trending conditions, mirroring the natural acceleration of price trends, while simultaneously leveraging adaptive range filtering and dual-layer candle trend logic.
This tool is ideal for traders seeking smooth yet reactive dynamic channels that evolve with market structure. Whether used in curved mode or traditional slope mode, it provides exceptional clarity on trend transitions, volatility compression, and breakout development.
█ How It Works
⚪ Adaptive Range Filter Foundation
The core of the system is a volatility-based range filter that determines the underlying structure of the bands:
Pre-Smoothing of High/Low Data – Highs and lows are smoothed using a selectable moving average (SMA, EMA, HMA, KAMA, etc.) before calculating the volatility range.
Volatility Envelope – The range is scaled using a fixed factor (2.618) and further adjusted by a Band Multiplier to form the primary envelope around price.
Smoothed Volatility Curve – Final bands are stabilized using a long lookback, ensuring clean visual structure and trend clarity.
⚪ Curved Channel Logic
In Curved Mode, the trend channel grows over time when the trend direction remains unchanged:
Base Step Size (× ATR) – Sets the minimum unit of slope change.
Growth per Bar (× ATR) – Defines the acceleration rate of the channel slope with time.
Trend Persistence Recognition – The longer a trend persists, the more pronounced the slope becomes, mimicking real market accelerations.
This dynamic, time-dependent logic enables the channel to "curve" upward or downward, tracking long-standing trends with increasing confidence.
⚪ Trend Slope
As an alternative to curved logic, traders can activate a regular Trend slope using:
Slope Length – Determines how quickly the trend line adapts to price shifts.
Multiplicative Factor – Amplifies the sensitivity of the slope, useful in fast-moving markets or lower timeframes.
⚪ Candle Trend Confirmation
A robust second-layer trend detection method, the Candle Trend System evaluates directional pressure by analyzing smoothed price action:
Multi-tier Smoothing – Trend lines are derived from short-, medium-, and long-term candle movement.
█ How to Use
⚪ Trend Identification
When the Trend Line direction and Candle Colors are in agreement, this indicates strong, persistent directional conviction. Use these moments to enter with trend confirmation and manage risk more confidently.
⚪ Retest
During ongoing trends, the price will often pull back into the dynamic channel. Look for:
Support/resistance interactions at the upper or lower bands.
█ Settings
Scaled Volatility Length – Controls the historical depth used to stabilize the volatility bands.
Smoothing Type – Choose from HMA, KAMA, VIDYA, FRAMA, Super Smoother, etc. to match your asset and trading style.
Volatility MA Length – Smoothing length for the calculated range; shorter = more reactive.
High/Low Smoother Length – Additional smoothing to reduce noise from spikes or false pivots.
Band Multiplier – Widens or tightens the band range based on personal preference.
Enable Curved Channel – Toggle between curved or regular trend slope behavior.
Base Step (× ATR) – The starting point for curved slope progression.
Growth per Bar (× ATR) – How much the slope accelerates per bar during a sustained trend.
Slope – Reactivity of the standard trend line to price movements.
Multiplicative Factor – Sensitivity adjustment for HyperTrend slope.
Candle Trend Length – Lookback period for trend determination from candle structure.
-----------------
Disclaimer
The content provided in my scripts, indicators, ideas, algorithms, and systems is for educational and informational purposes only. It does not constitute financial advice, investment recommendations, or a solicitation to buy or sell any financial instruments. I will not accept liability for any loss or damage, including without limitation any loss of profit, which may arise directly or indirectly from the use of or reliance on such information.
All investments involve risk, and the past performance of a security, industry, sector, market, financial product, trading strategy, backtest, or individual's trading does not guarantee future results or returns. Investors are fully responsible for any investment decisions they make. Such decisions should be based solely on an evaluation of their financial circumstances, investment objectives, risk tolerance, and liquidity needs.

Weighted Regression Bands (Zeiierman)█ Overview
Weighted Regression Bands is a precision-engineered trend and volatility tool designed to adapt to the real market structure instead of reacting to price noise.
This indicator analyzes Weighted High/Low medians and applies user-selectable smoothing methods — including Kalman Filtering, ALMA, and custom Linear Regression — to generate a Fair Value line. Around this, it constructs dynamic standard deviation bands that adapt in real-time to market volatility.
The result is a visually clean and structurally intelligent trend framework suitable for breakout traders, mean reversion strategies, and trend-driven analysis.
█ How It Works
⚪ Structural High/Low Analysis
At the heart of this indicator is a custom high/low weighting system. Instead of using just the raw high or low values, it calculates a midline = (high + low) / 2, then applies one of three weighting methods to determine which price zones matter most.
Users can select the method using the “Weighted HL Method” setting:
Simple
Selects the single most dominant median (highest or lowest) in the lookback window. Ideal for fast, reactive signals.
Advanced
Ranks each bar based on a composite score: median × range × recency. This method highlights structurally meaningful bars that had both volatility and recency. A built-in Kalman filter is applied for extra stability.
Smooth
Blends multiple bars into a single weighted average using smoothed decay and range. This provides the softest and most stable structural response.
⚪ Smoothing Methods (ALMA / Linear Regression)
ALMA provides responsive, low-lag smoothing for fast trend reading.
Linear Regression projects the Fair Value forward, ideal for trend modeling.
⚪ Kalman Smoothing Filter
Before trend calculations, the indicator applies an optional Kalman-style smoothing filter. This helps:
Reduce choppy false shifts in trend,
Retain signal clarity during volatile periods,
Provide stability for long-term setups.
⚪ Deviation Bands (Dynamic Volatility Envelopes)
The indicator builds ±1, ±2, and ±3 standard deviation bands around the fair value line:
Calculated from the standard deviation of price,
Bands expand and contract based on recent volatility,
Visualizes potential overbought/oversold or trending conditions.
█ How to Use
⚪ Trend Trading & Filtering
Use the Fair Value line to identify the dominant direction.
Only trade in the direction of the slope for higher probability setups.
⚪ Volatility-Based Entries
Watch for price reaching outer bands (+2σ, +3σ) for possible exhaustion.
Mean reversion entries become higher quality when far from Fair Value.
█ Settings
Length – Lookback for Weighted HL and trend smoothing
Deviation Multiplier – Controls how wide the bands are from the fair value line
Method – Choose between ALMA or Linear Regression smoothing
Smoothing – Strength of Kalman Filter (1 = none, <1 = stronger smoothing)
-----------------
Disclaimer
The content provided in my scripts, indicators, ideas, algorithms, and systems is for educational and informational purposes only. It does not constitute financial advice, investment recommendations, or a solicitation to buy or sell any financial instruments. I will not accept liability for any loss or damage, including without limitation any loss of profit, which may arise directly or indirectly from the use of or reliance on such information.
All investments involve risk, and the past performance of a security, industry, sector, market, financial product, trading strategy, backtest, or individual's trading does not guarantee future results or returns. Investors are fully responsible for any investment decisions they make. Such decisions should be based solely on an evaluation of their financial circumstances, investment objectives, risk tolerance, and liquidity needs.

Trend Channels (MTF) | Flux Charts💎 GENERAL OVERVIEW
Introducing our new Trend Channels (MTF) indicator! Latest trends play an important role for traders and sometimes it can be hard to spot trends in other timeframes. This indicator can plot latest trend channels across different timeframes, so you can spot trends and their channels easier. More info about the process in the "How Does It Work" section.
Features of the new Trend Channels (MTF) indicator :
Plot Trend Channels Across Up To 3 Different Timeframes
Broad Customizability Of Trend Detection
Variety Of Trend Invalidation Options
High Visual Customizability
🚩UNIQUENESS
While the detection of trend channels is a common concept among traders, trend channels across different timeframes can be as crucial as the ones in the current timeframe. This indicator can find them from up to 3 different timeframes. While the general settings will perform well enough most of the time, the indicator also provides fine-tuning options for trend detection and trend invalidation for more experienced traders.
📌 HOW DOES IT WORK ?
Trend channels occur when the price of an asset starts making a strong movement in a bullish or a bearish direction. This indicator detects trend channels using the Simple Moving Average (SMA). When the slope of the SMA line exceeds the user-defined size, a trend channel will occur.
To understand how individual settings work, you can check the "⚙️SETTINGS" section.
⚙️SETTINGS
1. General Configuration
SMA Length -> Determines the length used in the SMA function. Higher values mean that an average of a longer timespan will be taken into account when spotting trends.
Slope Length -> Used while finding the slope of the trend channel. Check this example for slope length :
ATR Size -> This setting is taken into calculation while checking if a trend channel is worth plotting. The higher this setting is, the higher the slope of the trend channel must be to get rendered. You can take a look at the chart provided above for a visual explanation.
Channel Expander -> When a trend channel occurs, the top and the bottom of the channel are initally determined by the latest highest highs / lowest lows. This setting expands the channel vertically by X times Average True Range (ATR). Check this example :
Trend Invalidation -> The trend channel gets invalidated when the bar closes / wicks above the top of the channel, or below the bottom of the channel. With this setting, you can switch the behaviour between bar close / bar wick.
Avoid False Invalidation -> This setting makes it harder for trend channels to get invalidated to prevent false invalidations.
Retries : The trend channel will have 5 chances for invalidation. First 4 invalidations will not invalidate the channel. The trend channel will only invalidate once the 5th invalidation occur.
Volume : The bar that invalidates the trend channel must have a volume higher than 1.5x the average bar volume of the current chart. Otherwise the trend channel will not be invalidated.
None : The trend channel will invalidate at the first invalidation.

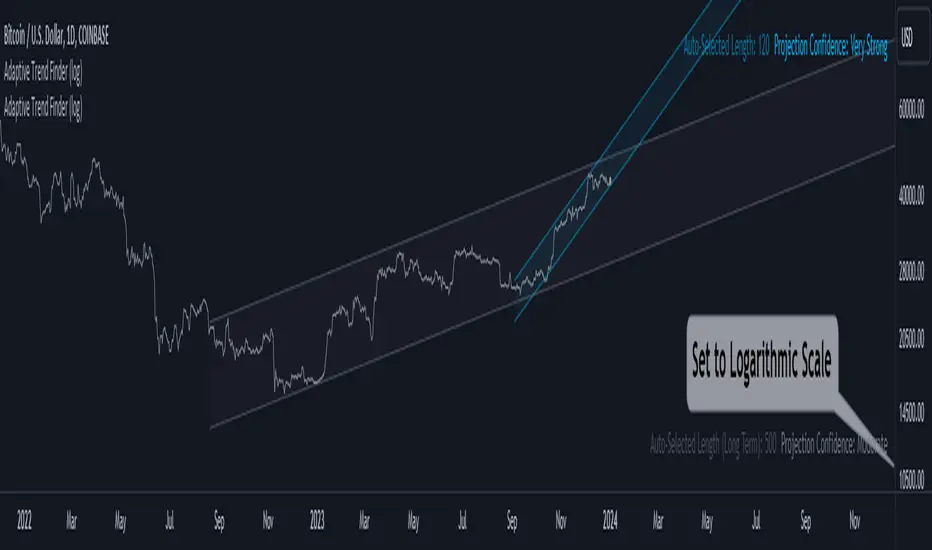
Adaptive Trend Finder (log)In the dynamic landscape of financial markets, the Adaptive Trend Finder (log) stands out as an example of precision and professionalism. This advanced tool, equipped with a unique feature, offers traders a sophisticated approach to market trend analysis: the choice between automatic detection of the long-term or short-term trend channel.
Key Features:
1. Choice Between Long-Term or Short-Term Trend Channel Detection: Positioned first, this distinctive feature of the Adaptive Trend Finder (log) allows traders to customize their analysis by choosing between the automatic detection of the long-term or short-term trend channel. This increased flexibility adapts to individual trading preferences and changing market conditions.
2. Autonomous Trend Channel Detection: Leveraging the robust statistical measure of the Pearson coefficient, the Adaptive Trend Finder (log) excels in autonomously locating the optimal trend channel. This data-driven approach ensures objective trend analysis, reducing subjective biases, and enhancing overall precision.
3. Precision of Logarithmic Scale: A distinctive characteristic of our indicator is its strategic use of the logarithmic scale for regression channels. This approach enables nuanced analysis of linear regression channels, capturing the subtleties of trends while accommodating variations in the amplitude of price movements.
4. Length and Strength Visualization: Traders gain a comprehensive view of the selected trend channel, with the revelation of its length and quantification of trend strength. These dual pieces of information empower traders to make informed decisions, providing insights into both the direction and intensity of the prevailing trend.
In the demanding universe of financial markets, the Adaptive Trend Finder (log) asserts itself as an essential tool for traders, offering an unparalleled combination of precision, professionalism, and customization. Highlighting the choice between automatic detection of the long-term or short-term trend channel in the first position, this indicator uniquely caters to the specific needs of each trader, ensuring informed decision-making in an ever-evolving financial environment.
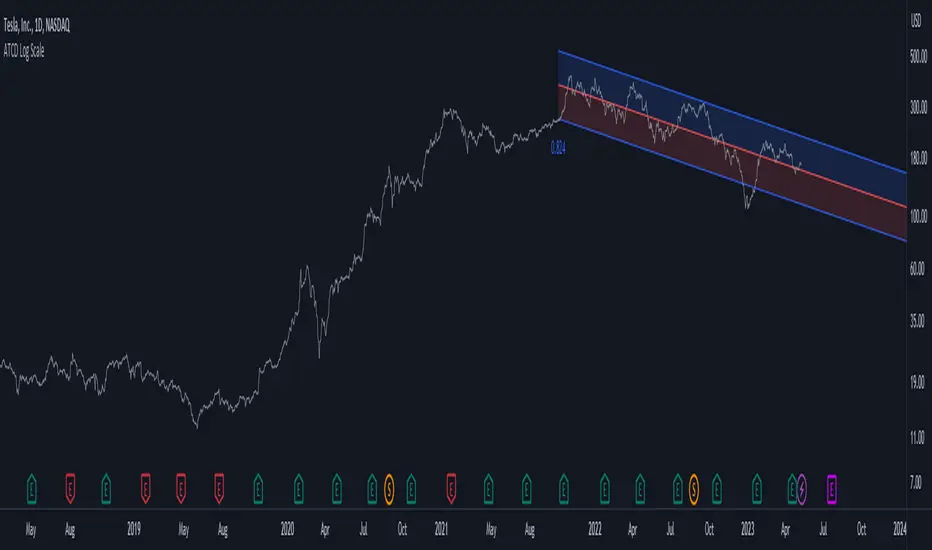
Advanced Trend Channel Detection (Log Scale)The Advanced Trend Channel Detection (Log Scale) indicator is designed to identify the strongest trend channels using logarithmic scaling. It does this by calculating the highest Pearson's R value among all length inputs and then determining which length input to use for the selected slope, average, and intercept. The script then draws the upper and lower deviation lines on the chart based on the selected slope, average, and intercept, and optionally displays the Pearson's R value.
To use this indicator, you will need to switch to logarithmic scale. There are several advantages to using logarithmic scale over regular scale. Firstly, logarithmic scale provides a better visualization of data that spans multiple orders of magnitude by compressing large ranges of values into a smaller space. Secondly, logarithmic scale can help to minimize the impact of outliers, making it easier to identify patterns and trends in the data. Finally, logarithmic scale is often utilized in scientific contexts as it can reveal relationships between variables that may not be visible on a linear scale.
If the trend channel does not appear on the chart, it may be necessary to scroll back to view historical data. The indicator uses past price data to calculate the trend channel, so if there is not enough historical data visible on the chart, the indicator may not be able to identify the trend channel. In this case, the user should adjust the chart's timeframe or zoom out to view more historical data. Additionally, the indicator may need to be recalibrated if there is a significant shift in market conditions or if the selected length input is no longer appropriate.
CryptoverseThis Indicator dynamically generates and charts Pivot Points, Support and Resistance Lines, Trend Channels and even Rsi Divergences in every market and every time period.
While it helps you identify your entry points, stop loss and take positions, it certainly does not include trading signals and trading strategy.
Bonus: the indicator contains ema21, ema50, ema100 and ema200 to support the lines created. If you wish, you can change the EMA values in the settings.
Recommendation: RSI is included in the indicator codes in order to detect divergences dataally, but it is not displayed on the chart. I recommend adding an additional RSI indicator to keep track of past and current potential divergences.
USER MANUAL:
----------------------------------------------
General Settings:
Pivot Period: This field determines how many candles before and after a candle should be controlled in order to be able to determine the top and bottom points on the chart.
Support and Resistance Lines and Trend Channels formed on the chart are created by calculating the Pivot points formed according to the period determined here. (Default value: 6)
Pivot Source: Determines the pivot points to be created according to the value of the relevant candle.
(Default and Recommended: closing)
----------------------------------------------
Support And Resistance Settings:
Custom Bars Back: This area allows you to specify how many pivot points from the current candle to the previous candle to create support resistance lines on the Chart. The default value is the last 500 candles.
*Note: The more old candles are checked, the more support and resistance lines will appear. This may prevent you from making sound determinations on the chart.*
Current Bar Decrease: This field works integrated with Custom Bars Back. By subtracting the current candle by the specified number, it provides the formation of lines without including those candles.
Default value: It is set to 0 to include current data.
Example: If Custom Bars Back: 500 and Current Bar Decrease: 10, Support and Resistance lines are created by considering 500 candles before the last 10 candles without including the last 10 candles on the chart.
Show S/R Lines: This field allows you to show or hide the Support and Resistance lines at any time.
Auto Simplification: This field is marked by default. It allows the Simplification Steps value to be determined automatically within the code according to the time period and current volatility of the relevant parity. (It is recommended to use the default version.)
Simplification Steps: This field allows you to get more understandable lines by simplifying the Support and Resistance lines based on Pivot points. If a simplification is not done, the lines to be formed with only the pivot points will be too many and this creates a dirty and useless appearance on the chart.
Each 1 digit you enter as a step combines the lines that are close to each other at a value of 0.01% and creates a common line.
Example: If you enter the number 10 as Steps, it will form a single common line from lines close together, starting at 0.01% respectively. It will continue to increase by 0.02%, 0.03%, 0.04% in its next steps. For the number 10, it will complete its loop by combining lines within the last remaining lines that are as close as 0.1% to each other and creating new lines from their midpoints.
The deafult value is 14. (Max. simplifies lines with closeness up to 1.4%.)
Important Note: If Auto Simplification is on, the entered value has no meaning. The Indicator performs simplification operations automatically. If you want to manage these steps manually, you can turn off Auto Simplification and enter your own value.
S/R Lines Color: Allows you to specify the color of the lines.
Label Location: Allows you to determine how many candles ahead the information label formed for each line will be positioned.
Line Label Descriptions:
Line: It is the price value that the line coincides with.*
Distance: Shows the percentage distance of the line from the current price.
▲ : Shows the percentage distance from the line above it.
▼ : Shows the percentage distance from the line below it.
Strength: Indicates the total number of steps the process has taken during the simplification process. The height of the number indicates the strength of resistance and support in the close price range.
C. Width: stands for Channel Width. It shows the percentage value between the highest price and the lowest price on the past candle as many candles specified by Custom Bars Back.
S. Steps: stands for Simplification Steps. Indicates the number of simplification steps applied. A value of 150 in the image indicates that a 1.5% simplification range has been applied.
----------------------------------------------
Trend Channels Settings:
Show All Trend Lines: Allows you to show and hide trend channels.
Hide Old Trend Lines: If you enable it, it will hide channels created in the past except for Current Trend channels.
Helper Line Format: Allows the auxiliary line that converts a trendline to a channel to be drawn based on percentage or price.
Note: There may be cases where the auxiliary lines do not provide full parallelism when using large time intervals by preferring a percentage.
Up Trend Color: Indicates the color of the Up Trend channel.
Down Trend Color: Specifies the color of the Downtrend channel.
Show Up Trend Overflow, Show Down Trend Overflow:
When the price closes above or below the trend channels, it provides awareness with the help of a text on the chart. Colors can be adjusted according to preference.
----------------------------------------------
RSI Divergences Settings:
This indicator gives you information about 4 different divergences. You can customize the divergence views with the show and hide options.
Bullish Regular, Bullish Hidden, Bearish Regular and Bearish Hidden.
Green divergences from the bottom of the graph represent bullish, and red divergences above the graph represent bearish.
Important note: Seeing a mismatch label definitely indicates that there is a mismatch between prices and rsi, but a mismatch does not always indicate a change in price.
Potential Divergence:
The indicator not only shows you past divergences, but also informs you of potential divergences based on the current status of the chart.
A potential divergence may not turn into a true one if the price flow continues to increase or decrease in the same direction. But all divergences seen in the past must have been shown as potential divergences beforehand.
Rsi Length, Rsi Source: Allows you to change settings for RSI values typically embedded within the indicator.
Note: Pivot Source and RSI Source using the same type of candle data ensures that divergences are displayed correctly.
----------------------------------------------
EMA Settings:
The indicator allows you to use 4 different EMA data in addition to Support and Resistance lines, Trend Channels and RSI divergences. By default, 21, 50, 100 and 200 are used. You can change the EMA values and colors in the Settings section, or you can use the show hide options in the Style section.

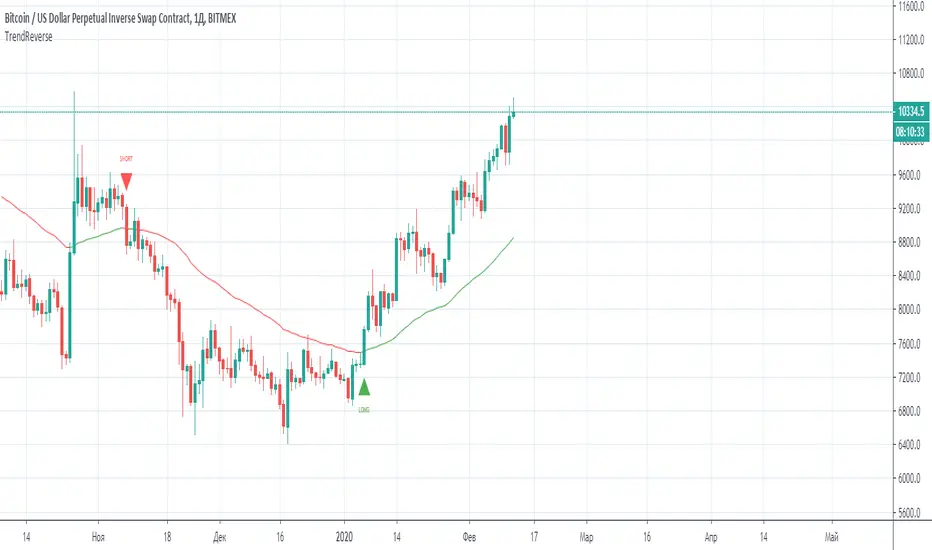
Easy TrendCurrent script displays trend channel, which makes it easy to see reversal signals
Note:
- If price goes above the channel it might be an early sell signal
- If price falls from channel it might be a sell signal, better to enter position on retest
Plan for future development:
- Alerts
- Trend angle

HAP Auto Trend Line [PRO]Hello Traders!
The trend line is among the most important tools used by technical analysts. Instead of looking at past business performance or other fundamentals, technical analysts look for trends in price action. A trend line helps technical analysts determine the current direction in market prices. Technical analysts believe the trend is your friend, and identifying this trend is the first step in the process of making a good trade, and it can tell Support/resistance is very good.
But when drawing Trend Lines, sometimes we're not sure where to start. From where is the starting point? And sometimes it can be drawn multiple lines with different support/resistance lines over time. This itself can be confusing, so I tried to create a tool that allows it to draw lines automatically. According to price movement.
Let's take a look at the variables you need to understand from our indicators.
For this indicator it works in two main parts:
Section of Trend Line
Trend Reversal section
Therefore, these two parts have separate functions. To be used as a component for easier decision-making.
Trend Line, as I said before, what it is. Next is Trend Reversal. I will simply say it is. A period of time when the candle tries to pump and dump. This will help point out the potential price reversal. And if there is a trend line area, it is an interesting point to consider. To identify possibilities.
Some variables from the settings page
Number of Bars to Check : It is the number of past candlesticks to consider. To identify the start of the Trend Line, if it meets the condition, it will automatically draw the Trend Line for you.
Trend Line Depth : It is the frequency. Of identifying the starting point Trend Line. If the value is large, it will find a low Trend Line, and if it is low, it will find more Trend Line. This is flexible. So you have to try it yourself. On demand.
Overview
You can turn it on or off. Support/resistance position either.
Select Emoji Support/resistance. Freely
Line style you want
your favorite color
customizable line intensity
the script is fast enough to run on 1sec chart:
fun !

Kirill ChannelThis indicator shows overbought and oversold zones. Can be used on all time frames. I personally use 15m - 30m.
How to apply ?:
- There can be many strategies for use! I use this indicator to buy an asset in the green zone and then sell it in the middle of the channel or in the red zone.
- I strongly advise against entering counter-trend positions in a growing market if you have little trading experience and understanding of price action.
How do I place orders ?:
- I place orders in a grid.
- If the price is very close to the edge, but it is difficult to reach it, then it is better to open a position on the market and place orders deep into the grid.
- If the price is at the edge of the channel for a very long time, then you need to look at a higher timeframe.
Algorithm composition:
- ALMA
- Keltner Channel
- Fibonacci Retracement
- Custom price percent offset calculations and manipulations.
Settings:
- I strongly do not recommend changing ALMA. These numbers have been specially calculated.
- It's better not to change Borders either. The current algorithm dynamically changes the width of the extreme channels depending on the price movement.
- The Keltner Channel was specially selected.
- Fibonacci Retracement can be changed. This part of the algorithm can be modified to suit your needs. At the moment, there are settings for aggressive trading.
Channel type:
- Conservative: Fibonacci Retracement settings (100 ma, 100 atr, 8 mult, 100 smooth)
- Aggressive: Fibonacci Retracement settings (25 ma, 25 atr, 3.5 mult, 100 smooth)
Сonservative channel does not allow a large number of points to enter positions, however, it is more straightforward and safer for very large movements.
I prefer aggressive settings because they allow me to make more profit on the number of trades.
Try to use both modes and choose what is preferable for you.

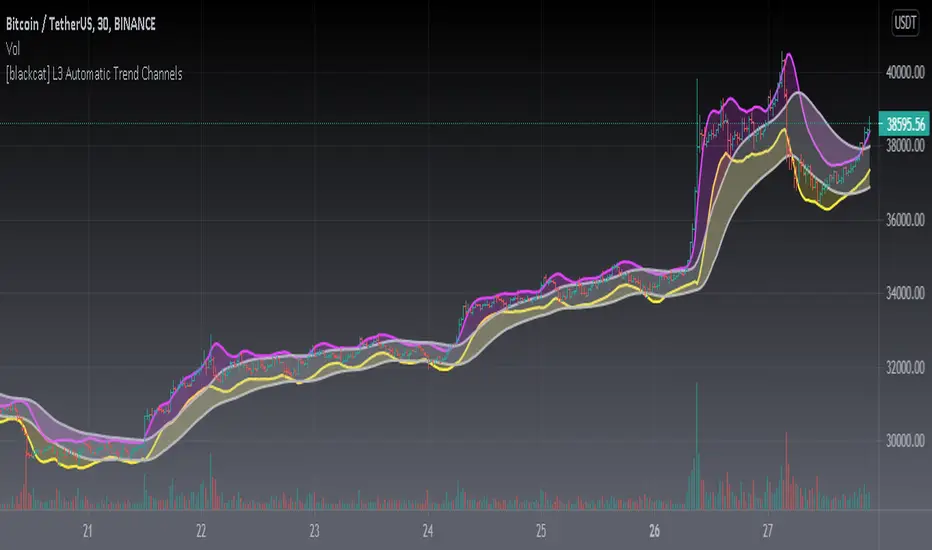
[blackcat] L3 Automatic Trend ChannelsLevel: 3
Background
Trend channels, also sometimes called price channels or trading channels, are a popular tool in technical analysis used by investors to determine good places to buy or sell. Trend channels consist of at least two trend lines that connect the swing highs and the swing lows of a trending or a sideways moving market. It’s important to note that trend channels don’t have to be perfectly parallel lines, but more on that later!
Function
Unlike many other authors who are eager to draw automatic trend lines, I made a trade-off between trend lines based channels and moving averages. As a result, it is more clear to see the trend change and price positions with overbought and oversolder zones highlighted in fuchsia and yellow colors, respectively. Same to trend lines, there are 3 main types of trend channels.
Ascending channel or Rising channel (higher highs and higher lows, which would break out sliver color trend channel and run into fuchsia color overbought band)
Descending channel or Falling channel (lower highs and lower lows, which would break out sliver color trend channel and run into yellow color oversold band)
Sideways or horizontal channel (ranging, which will keep oscillating within silver color trend channel)
Inputs
Algo Lookback (Smaller for Less Computing Power) --> This indicator is very computing-power consuming and if you failed to load it properly and try to input a smaller integer value here.
Algo Nested Period (Smaller for Faster Response) --> This indicator is very computing-power consuming and if you failed to load it properly and try to increase the number here.
Key Signal
Silver channel --> trend channel to identify sideways.
fuchsia band --> overbought band and sell after price cross under the fuchsia lines (Note, the second crossunder is more meaningful)
yellow band --> oversold band and buy after price break out and cross over the yellow lines (Note, the second crossover is more meaningful)
Remarks
This indicator algorithm is very computing-power consuming and it may fail to load in small time frame.
This is a Level 3 free but closed source indicator.
Feedbacks are appreciated.
MM Auto Trend ChannelThe Auto Trend Channel is a simple indicator that automatically plot a trend channel based on the length you set from Up to Downtrend. and changes automatically when the trend is broken.
changes from red"downtrend to green "uptrend" and also has auto fib lines.
I use it set at the 50 period and work from there
works on any time frame
and set alerts for broken channel
Use link below or PM us for access you this indicator Happy Trading

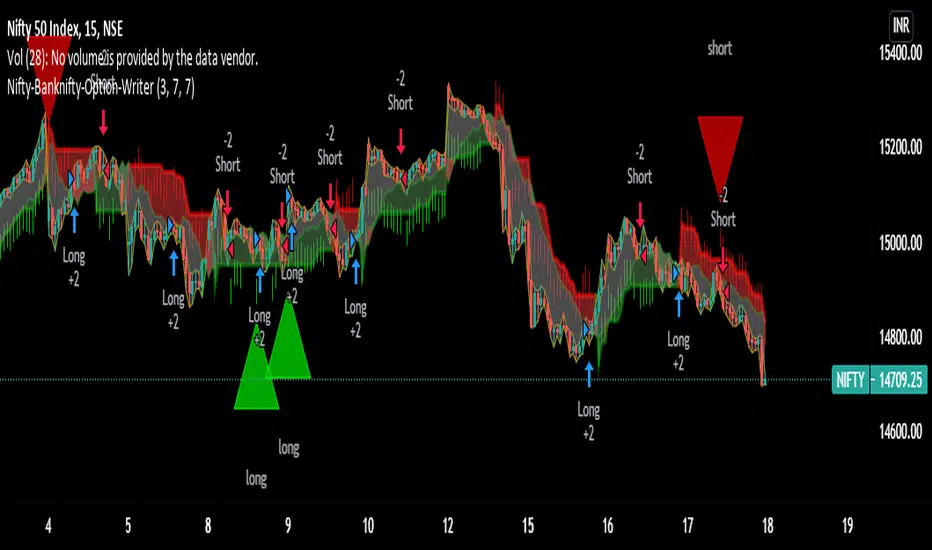
Nifty-Banknifty-Option-WriterNifty-Banknifty-Option-Writer tool is having signals like below
1) Bullish signal for taking long trade
2) Bearish signal for taking short trade
3) Triangle UP signal for trend change Long trade
4) Triangle Down signal for trend change Short trade
5) Big Arrow down signal for closing long trade if u have any short trades
6) Big Arrow UP signal for closing Short trade if i have any long trades
7) This tool is having three zone GREEN, RED and GRAY
8) small red arrow and small green arrow
===========================================================================================
How to use this tool:-
You should take long trade in index call option or sell put option when you will get Bullish signal or Big green Triangle and book the profit when you get any red signal either Its Big red triangle or Bearish signal or big downward red arrow close long trade or small red arrow.
Similarly you can take long trade for Index put option or sell call option for Short trade when you get Bearish signal or Big red triangle and book the profit when you will get close long big green arrow signal or small green arrow or Bullish signal or Big green triangle.
-If candle formation is having above GREEN and GRAY zone then it signifies strength is bullish and remain in Long trade till you are not getting close long trade signal or small red downward arrow signal.
-If candle formation is happening below RED and GRAY zone then it signifies strength is bearish and remain in short trade till you are not getting close short trade signal or small green upward arrow signal.
I have taken combination of ATR, Super trend and RSI to get the trend and trend change of underlying.
this tool i have created for any underlying not specific to Nifty or Banknifty though I have used this name so Indian can take benefit for Index trading.
Still didn't understand then ping me or give me call on my number given in signature i will make zoom call with you so will understand how to use this script.
=============================================================
I have taking consideration of Bullish and Bearish trade for strategy and its giving its optimal result in 1 hr time frame.
I have added commission/slippage for trade so actual result can be displayed in strategy tester.
Ping me or DM me to subscribe this indicator.
I have given all my indicator details below link (Signature URL). You can check indicators and call me on given number or email me on given email to access the scripts and indicators. Telegram link is also given you can ping me there.
--------------------------------------------------------------------------------------------------------------------------------------
Disclaimer : Past performance of the indicator is not giving guarantee for future performance as well, it may change as per market condition.
-------------------------------------------------------------------------------------------------------------------------------------
Trend Lines Pro for IndicatorsHello Traders!
We need to make things better & better to solve the puzzle and I try to do my best on this way. now I am here with my new Trend Lines Pro for Indicators script.
As you know, Trend Lines is very subjective and many people (even professionals) draw different Trend Lines on the same chart. This is confusing and there must be an automation to make the life easer. with this tool I tried to automate it.
The idea in this script is different from my previous trend lines scripts. In this, I use channel idea so it can check number of pivot points it contains. it also checks the angle while choosing trend lines. then we get stronger and useful Trend Lines automatically.
There are some option in the script, let see one by one:
Indicator: the indicator on which you want to see Trend lines, Predefined Indicators are: RSI, CCI(Commodity Channel Index), OBV(On-Balance Volume), Momentum, MACD, CMF(Chaikin Money Flow), External Indicator
External Indicator: with this option you can use other indicators as input and get trend lines for them.
- First add an indicator (such as MFI)
- in "Indicator" option select "External Indicator"
- click "External Indicator" option
- and choose the indicator from the list
Pivot Period: The Length to calculate Pivot Highs/Lows
Threshold Rate: This rate is used for channel width. it you give bigger numbers then you get bigger channels. it's 4 by default
Minimum Angle Rate for new Trendline: if there are different trend lines , there must be an angle between them to choose best trend lines . you can set the angle with this option.
Minimum Strength: there can be many trend lines but we need to choose/use stronger ones. with this option you can set the number of pivot points a trend channel have to contains. default value is 2
Maximum Loopback Length : by default the script can check 40 pivot highs and 40 pivot lows but to make the script faster and useful I needed to add a limitation for the number of bars that the script can go back.
Show Trendlines as: you can see trend lines as "Trendline", "Channel", "Trend Channel". you can see examples below.
Enable Weak Trend Lines : if there is no trend lines strong enough (as defined in "Minimum Strength" option) you have option to see a weak trend line . that is useful sometimes. if you enable this option weak lines are shown as dotted lines.
Show Price Labels on Trendlines: the script can show the price levels to break trend lines . the example
Line Style: trend lines can be Solid or Dashed as you wish
Color theme: colors of the Up/Down Trend lines can be set. Red, Lime, Blue, White, Black, Olive, Gray
Indicator color: colors of the Up/Down Trend lines can be set. Red, Lime, Blue, White, Black, Olive, Gray and Yellow
and last options are for length options for RSI, CCI, Momentum, MACD, CMF
There are many alerts such: Support/Resistance Broken, Price in Support/Resistance channel, Support/Resistance line broken but still in a channel that means it broke S/R but there is another trend lines to break.
Below an example how the script uses external indicator as input and draws trend lines on it. in this example chaikin ossilator was added to the chart and get trend lines for it. (I am going to make a short video about it)
An example of Trend Channel is below. when you use trend channel option you can get "big picture" of whats going on
An example for trend lines in channels, that is the idea behind this trend lines script
An axample for trend lines for CCI:
Trend lines on OBV:
Trend lines on Momentum:
Trend lines on MACD:
Trend lines on CMF:
Different colors and line styles:
Please send me message for access and do not hesitate to ask your questions about this tool.
Enjoy!
DISCLAIMER: No sharing, copying, reselling, modifying, or any other forms of use are authorized for our documents, script / strategy, and the information published with them. This informational planning script / strategy is strictly for individual use and educational purposes only. This is not financial or investment advice. Investments are always made at your own risk and are based on your personal judgement. I am not responsible for any losses you may incur. Please invest wisely.
Paid script

Trend Lines ProHello Traders!
We need to make things better & better to solve the puzzle and I try to do my best on this way. now I am here with my new Trend Lines Pro script.
As you know, Trend Lines is very subjective and many people (even professionals) draw different Trend Lines on the same chart. This is confusing and there must be an automation to make the life easer. with this tool I tried to automate it.
The idea in this script is different from my previous trend lines scripts. In this, I use channel idea so it can check number of pivot points it contains, it checks H/L/C in the channels as well. it also checks the angle while choosing trend lines. then we get stronger and useful Trend Lines automatically.
There are some option in the script, let see one by one:
Pivot Period: The Length to calculate Pivot Highs/Lows
Source : Option to use "High/Low" or "Close" as the source for Pivot Points
Threshold Rate : This rate is used for channel width. it you give bigger numbers then you get bigger channels. it's 4 by default
Minimum Angle Rate for new Trendline: if there are different trend lines, there must be an angle between them to choose best trend lines. you can set the angle with this option.
Minimum Strength: there can be many trend lines but we need to choose/use stronger ones. with this option you can set the number of pivot points a trend channel have to contains.
Maximum Loopback Length: by default the script can check 40 pivot highs and 40 pivot lows but to make the script faster and useful I needed to add a limitation for the number of bars that the script can go back.
Show Trendlines as: you can see trend lines as "Trendline", "Channel", "Trend Channel". you can see examples below.
Enable Weak Trend Lines: if there is no trend lines strong enough (as defined in "Minimum Strength" option) you have option to see a weak trend line. that is useful sometimes. if you enable this option weak lines are shown as dotted lines.
Show Price Labels on Trendlines: the script can show the price levels to break trend lines. the examples are below
Line Style: trend lines can be Solid or Dashed as you wish
Color theme: colors of the Up/Down Trend lines can be set. 'Red', Lime, Blue, White, Black, Olive, Gray
you can see the Trend Lines as channels:
you can see Trend Channels to see the big picture.also there is dotted trend line as weak trend line defined above.
you can set color/width of trend lines as you wish.
the script is fast enough to run on 1sec chart:
you can use this script on any chart, fx pairs, stocks, indices etc
I made a short video to explain how to use it and some options:
Please PM for access.
Enjoy!
DISCLAIMER: No sharing, copying, reselling, modifying, or any other forms of use are authorized for our documents, script / strategy, and the information published with them. This informational planning script / strategy is strictly for individual use and educational purposes only. This is not financial or investment advice. Investments are always made at your own risk and are based on your personal judgement. I am not responsible for any losses you may incur. Please invest wisely.
Paid script

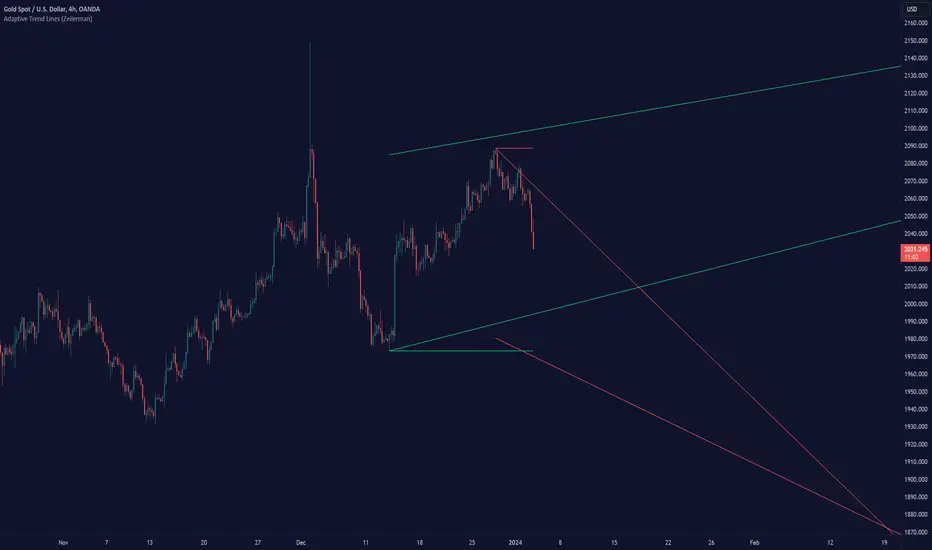
Adaptive Trend Lines (Expo)Adaptive Trend Lines (Expo) identifies the current trend direction within the selected lookback period. The idea behind the indicator is that the trend lines should self adjust to the constantly changing market. The indicator adjusts itself to the market by using tr (true range) and stdev (standard deviation) as dynamic variables.
The indicator displays positive- and negative trend channels.
HOW TO USE
1. Use the indicator to identify the trend direction.
I hope you find this indicator useful , and please comment or contact me if you like the script or have any questions/suggestions for future improvements. Thanks!
I will continually work on this indicator , so please share your experience and feedback as it will enable me to make even better improvements. Thanks to everyone that has already contacted me regarding my scripts. Your feedback is valuable for future developments!
-----------------
Disclaimer
Copyright by Zeiierman.
The information contained in my scripts/indicators/ideas does not constitute financial advice or a solicitation to buy or sell any securities of any type. I will not accept liability for any loss or damage, including without limitation any loss of profit, which may arise directly or indirectly from the use of or reliance on such information.
All investments involve risk, and the past performance of a security, industry, sector, market, financial product, trading strategy, or individual’s trading does not guarantee future results or returns. Investors are fully responsible for any investment decisions they make. Such decisions should be based solely on an evaluation of their financial circumstances, investment objectives, risk tolerance, and liquidity needs.
My scripts/indicators/ideas are only for educational purposes!
Extremes (Expo) Extremes (Expo)
DESCRIPTION
This Extreme (Expo) indicator identifies areas where the market is extreme. The length of the extreme calculation can be changed and gives you the flexibility to choose how sensitive the indicator should be. A longer length means that the indicator only identifies bold extremes. A shorter length is more sensitive and thus identifies all extremes in the market.
When the market is in an extreme mode, keep your trade until the extreme mode ends.
Postive extreme is when the price is above the positive extreme lines. (Keep your long trade until the positive extreme ends).
Negative extreme is when the price is below the negative extreme lines. (Keep your short trade until the negative extreme ends).
The Extremes (Expo) can be used to visualize the trend. Price crossing indicates a directional change. Price can also bounce off the extremes lines, which can act as dynamic support and resistance. It is often used in combination with other signals and analysis techniques.
TREND
The indictor has a Trend- feature that can be switched on which identifies trend shifts as well as trend direction.
A positive trend is when all three trendlines are green, and when the price is at least above one of these three lines.
A Negative trend is when all three trendlines are red, and when the price is at least under one of these three lines.
When the color of the trend lines changes color it indicates that the trend might shift direction. When all three trendlines have shifted color a trend is established.
PULLBACK
A bonus feature that is added to the trend-setting is that it can detect pullbacks in trends. This is visualized by that one of the three trendlines change color. For instance, say that all 3 lines are red (negative trend) and one of these lines changes color to green it can be regarded as a pullback in the negative trend.
HOW TO USE
1. Use the indicator to identify extreme areas.
2. Use the indicator to identify trends.
3. Use the indicator to identify trend shifts.
4. Use the indicator to identify pullbacks in trends.
INDICATOR IN ACTION
EXTREMES
BTCUSD
BTCUSD
TESLA
WALL STREET
TREND & PULLBACK
WALL STREET
EURUSD
I hope you find this indicator useful , and please comment or contact me if you like the script or have any questions/suggestions for future improvements. Thanks!
I will continue to work on this indicator, so please share your experience and feedback with me so that I can continuously improve it. Thanks to everyone that have contacted me regarding my scripts. Your feedback is valuable for future developments!
ACCESS THE INDICATOR
• Contact me on TradingView or use the links below
-----------------
Disclaimer
Copyright by Zeiierman.
The information contained in my scripts/indicators/ideas does not constitute financial advice or a solicitation to buy or sell any securities of any type. I will not accept liability for any loss or damage, including without limitation any loss of profit, which may arise directly or indirectly from use of or reliance on such information.
All investments involve risk, and the past performance of a security, industry, sector, market, financial product, trading strategy, or individual’s trading does not guarantee future results or returns. Investors are fully responsible for any investment decisions they make. Such decisions should be based solely on an evaluation of their financial circumstances, investment objectives, risk tolerance, and liquidity needs.
My scripts/indicators/ideas are only for educational purposes!

Auto Trend Channel by Atilla YurtsevenHi traders,
I have coded this "Auto Trend Channel" script to help myself to draw a perfect trend. I usually use "Open / Close" as source. Play around with the "Lookback" period to find the best fit. Hope you enjoy it.
Note: This indicator repaints as highs and lows changed.
Remember to follow me and drop some comments below.
Disclaimer: This is not financial advice
Trade safe,
Atilla Yurtseven
Linear Regression Trend ChannelThis is my first public release of indicator code and my PSv4.0 version of "Linear Regression Channel", as it is more commonly known. It replicates TV's built-in "Linear Regression" without the distraction of heavy red/blue fill bleeding into other indicators. We can't fill() line.new() at this time in Pine Script anyways. I entitled it Linear Regression Trend Channel, simply because it seems more accurate as a proper description. I nicely packaged this to the size of an ordinary napkin within 20 lines of compact code, simplifying the math to the most efficient script I could devise that fits in your pocket. This is commonly what my dense intricate code looks like behind the veil, and if you are wondering why there is no notes, that's because the notation is in the variable naming. I excluded Pearson correlation because it doesn't seem very useful to me, and it would comprise of additional lines of code I would rather avoid in this public release. Pearson correlation is included in my invite-only advanced version of "Enhanced Linear Regression Trend Channel", where I have taken Linear Regression Channeling to another level of fully featured novel attainability using this original source code.
Features List Includes:
"Period" adjustment
"Deviation(s)" adjustment
"Extend Method" option to extend or not extend the upper, medial, and lower channeling
Showcased in the chart below is my free to use "Enhanced Schaff Trend Cycle Indicator", having a common appeal to TV users frequently. If you do have any questions or comments regarding this indicator, I will consider your inquiries, thoughts, and ideas presented below in the comments section, when time provides it. As always, "Like" it if you simply just like it with a proper thumbs up, and also return to my scripts list occasionally for additional postings. Have a profitable future everyone!
Trend Channel [Gu5]SMA 200 determines the trend
Bullish trend, green candles. Down trend, red candles.
If the market value is narrow to the SMA200 channel, yellow candles.
Setting recommended for SMA Range
BTCUSD = 100
EURUSD = 1000
SPX = 100
ETHUSD = 10
