Market Structure Double BOS Confirm
🔥 Overview
🎯 This Double BOS(Break Of Structure) Confirm indicator combined ma-based BOS and classic BOS
to achieve a more credible BOS signal . it works well in most symbols with 2 parameters finetune.
🎯 It's a enhanced version compare with previous script.
🎯 at the same time, I keep D-BOS and BOS separately, you can use them in combination freely.
🔥 Indicator design logic
🎯 there are 3 parts in this indicator.
Part 1: MA-Based BOS
1. use close-in EMA's highest/lowest value mark as SWING High/Low when EMA crossover/under,
not use func ta.pivothigh()/ta.pivotlow()
2. once price reaching EMA’s SWING High/Low, draw a line link High/Low to current bar, labled as BOS
3. more MA-Based BOS details can get from my previous script.
Part 2: Classic BOS
1. use pivothigh/low function to find pivot (decided by left/right swing length)
2. when get new pivothigh, compare with previous high, calculate HH/LH/HL/LL result
3. once bar closed and break pivothigh then labed as BOS
Part 3: Double BOS Confirms
1. when MA-Based BOS and Classic BOS occured at the same bar closed signed as D-BOS
2. when two BOS events one bar apart, signed as D-BOS
🔥 Settings
🎯 there are 13 input properties in script, 4 properties(Bold field) have an impact on the results and the other 9 show display effects.
GRP1
MA_Type : MA type you can choose(EMA/RMA/SMA/HMA/WMA/VWMA), default is HMA
short_ma_len : MA length of your current timeframe on chart, default 30
show_ma_bos_line: whether show ma-based BOS line, default false
GRP2
left_swing_len : pivothigh(source, left,right), it‘s left swing length
right_swing_len : right swing length
show_pivot_bos_line: whether show pivot-based BOS line, default false
GRP3
show_double_bos_line: show double_bos_line, default true
double_bos_linewidth: linewidth, default 2 (Bold line)
double_bos_linestyle: default Dashed
🔥 Usage
🎯 BOS signal usually worked fine in high volatility market, low volatility is meaningless.
🎯 D-BOS will filtered much more signals than ma-based BOS and classic BOS
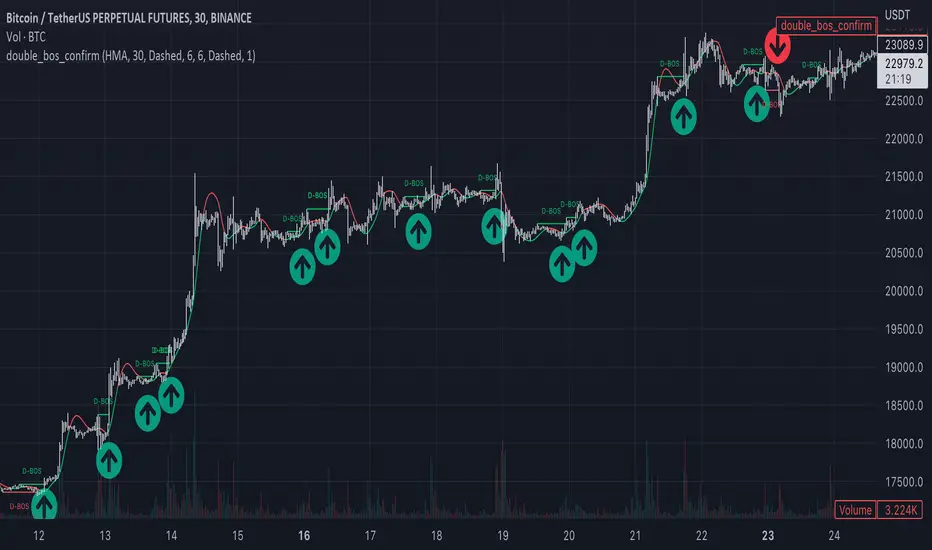
We can see that it performs well in trending market of different symbols, and BOS is an opportunity to add positions,
D-BOS will filtered much more signals
Double-BOS Confirm : BINANCE:BTCUSDTPERP 30m
MA-Based BOS : BINANCE:BTCUSDTPERP 30m
🎯 Support classic HH/HL label, MA-Based Zigzag
🎯 You can use only D-BOS, MA-BOS or Classic-BOS alone, or D-BOS and one of the other, it's up to you,
but my personal preference is to use D-BOS and MA-BOS in combination
🎯 any questions or suggestion please comment below, I would appreciate it greatly.
Additionally, I plan to publish 20 profitable strategies in 2023; indicatior not one of them,
let‘s witness it together!
Hope this indicator will be useful for you :)
enjoy! 🚀🚀🚀
Pine Script® indicator