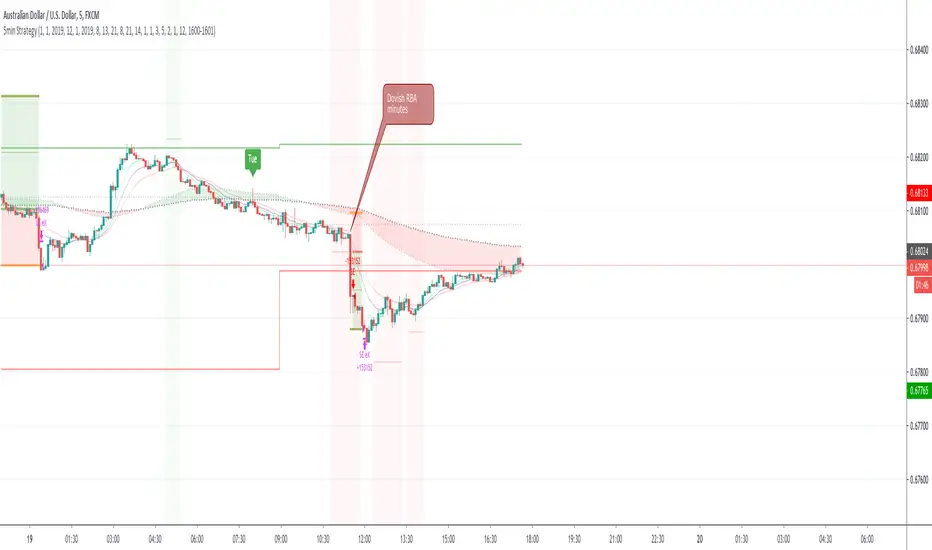
First time coding - a 5min forex Scalping strategy This is my first attempt at producing a strategy in Pine Script.
I am NOT a professional coder. I'm not even a good coder at that. I've only started Pine Script coding since September 2019. I am teaching myself.
This script is far from finished. I need to tweak a number of things about this script. Namely:
Add a validity window to the 'trigger bar' condition. Ie, I want to shut down the condition when the price closes above EMA21
Change the order entry so they are stop orders, using the stop entry price derived from the signals
Make changes to lot sizing
Add a trailing stop condition
Comments welcome, but do not expect me to reply to any questions or requests. In fact, don't expect any replies from me. I consider myself notoriously bad at replies.
I do welcome any feedback from any seasoned coders out there, as I am still a novice coder, and have so much to learn!
As to anyone who wants to criticise me - constructive and helpful criticism are most welcome, criticism to make yourself feel superior to me - you kind can eat a dk.
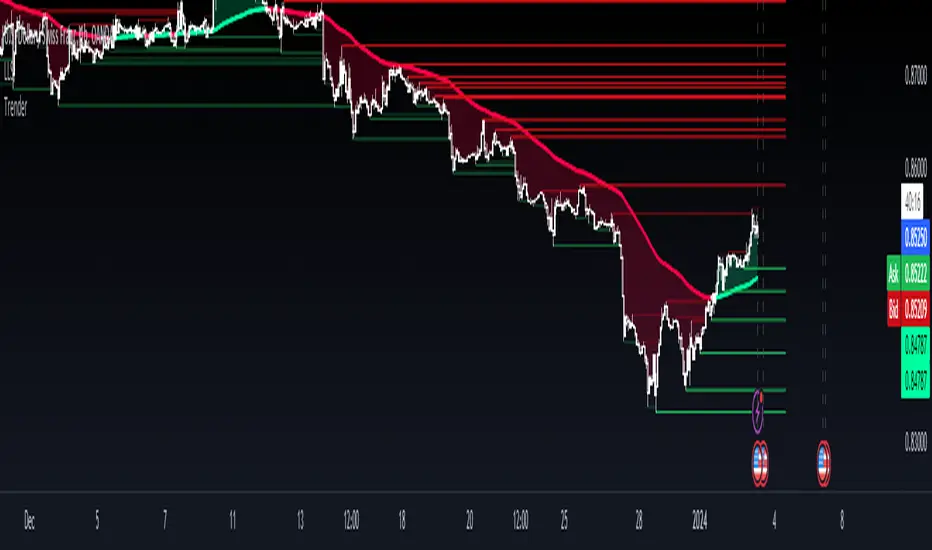
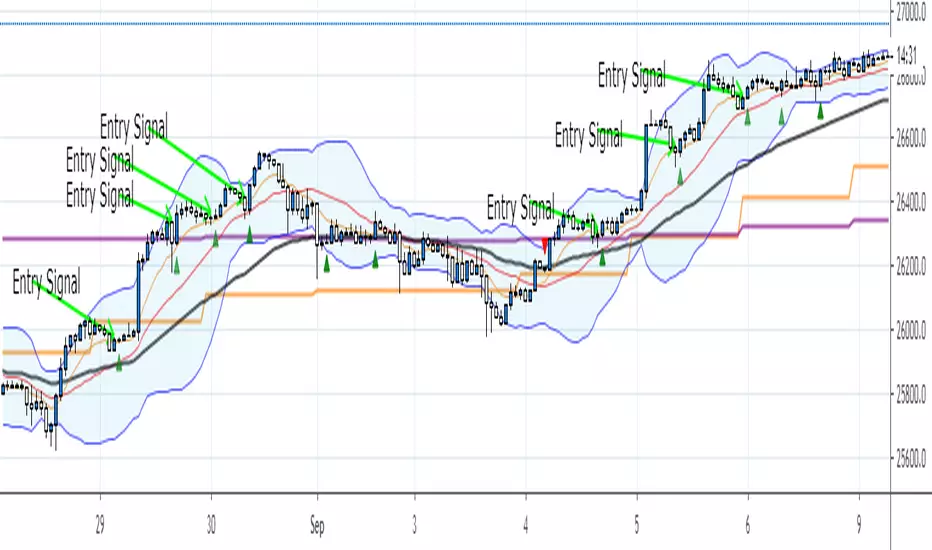
For the strategy rules, google the user ForexSignals TV account and look for the video "SIMPLE and PROFITABLE Forex Scalping Strategy".
Share, learn, prosper
Peace to y'all
Serialhenry
6/11/19
Pine Script® strategy