Expansion Triangle [TradingFinder] MegaPhone Broadening🔵 Introduction
The Expanding Triangle, also known as the Broadening Formation, is one of the key technical analysis patterns that clearly reflects growing market volatility, increasing indecision among participants, and the potential for sharp price explosions.
This pattern is typically defined by a sequence of higher highs and lower lows, forming within two diverging trendlines. Unlike traditional triangles that converge to a breakout point, the expanding triangle pattern becomes wider over time, leaving no precise apex for a breakout to occur.
From a price action perspective, the pattern represents a prolonged tug-of-war between buyers and sellers, where neither side has taken control yet. Each aggressive swing opens the door to new opportunities whether it's a trend reversal, range trading, or a momentum breakout. This dual nature makes the pattern highly versatile across market conditions, from exhausted trend ends to volatile consolidation zones.
The custom-built indicator for this pattern uses a combination of smart algorithms and detailed analysis of swing dynamics to automatically detect expanding triangles and highlight low-risk entry points.
Traders can use this tool to capitalize on high-probability setups from shorting near the upper edge of the structure with confirmation, to trading bearish breakouts during trend continuations, or entering long positions near the lower boundary during bullish reversals. The chart examples included in this article demonstrate these three highly practical trading scenarios in live market conditions.
A major advantage of this indicator lies in its structural filtering engine, which analyzes the behavior of each price leg in the triangle. With four adjustable filter levels from Very Aggressive, which highlights all potential patterns, to Very Defensive, which only triggers when price actually touches the triangle's trendlines the indicator ensures that only structurally sound and verified setups appear on the chart, reducing noise and false signals significantly.
Long Setup :
Short Setup :
🔵 How to Use
The pattern typically forms in conditions of heightened uncertainty and volatility, where price swings generate a series of higher highs and lower lows. The expanding triangle consists of three key legs bounded by diverging trendlines. The indicator intelligently analyzes each leg's direction and angle to determine whether a valid pattern is forming.
At the core of the indicator’s logic is its leg filtering system, which controls the quality of the pattern and filters out weak or noisy setups. Four structural filter modes are available to suit different trading styles and risk preferences. In Very Aggressive mode, filters are disabled, and the indicator detects any pattern purely based on the sequence of swing points.
This mode is ideal for traders who want to see everything and apply their own discretion.
In Aggressive mode, the indicator checks whether each new leg extends no more than twice the length of the previous one. If a leg overshoots excessively, the structure is invalidated.
In Defensive mode, the filter enforces a minimum movement requirement each leg must move at least 2% of the previous one. This prevents the formation of shallow, weak patterns that visually resemble triangles but lack substance.
The strictest setting, Very Defensive, combines all previous filters and additionally requires the price to physically touch the triangle’s trendlines before issuing a signal. This ensures that setups only appear when real market interaction with key structural levels has occurred, not based on assumptions or geometry alone. This mode is ideal for traders seeking maximum precision and minimal risk.
🟣 Bullish Setup
A bullish setup within the Expanding Triangle pattern occurs when price revisits the lower support boundary after a series of broad swings typically near the third leg of the formation. This area often represents a shift in momentum, where sellers begin to lose strength and buyers prepare to take control.
Ideally, the setup is accompanied by a bullish reversal candle (e.g. doji, pin bar, or engulfing) near the lower trendline. If the Very Defensive filter is active, the indicator will only issue a signal if price makes a confirmed touch on the trendline and reacts from that level. This significantly improves signal accuracy and filters out premature entries.
After confirmation, traders may choose to enter a long position on the bullish candle or shortly afterward. A logical stop-loss is placed just below the recent swing low within the pattern. The target can be set at or near the upper trendline, or projected using the full height of the triangle added to the breakout point. On higher timeframes, this reversal often marks the beginning of a strong uptrend.
🟣 Bearish Setup
A bearish setup forms when price climbs toward the upper resistance trendline, usually as the third leg completes. This is where buyers often begin to show exhaustion, and sellers step in with strength providing an ideal low-risk entry point for short positions.
As with the bullish setup, if the Candle Confirmation filter is enabled, the indicator will only show a signal when a bearish reversal candle forms at the point of contact. If Defensive or Very Defensive filters are also active, the setup must meet strict criteria of proportionate leg movement and an actual trendline touch to qualify.
Once confirmed, traders can enter on the reversal candle, placing a stop-loss slightly above the recent high. The target can be set at the lower trendline or calculated based on the triangle's full height, projected downward. This setup is particularly useful at the end of weak bullish trends or in volatile market tops.
🔵 Settings
🟣 Logic Settings
Pivot Period : Defines how many bars are analyzed to identify swing highs and lows. Higher values detect larger, slower structures, while lower values respond to faster patterns. The default value of 13 offers a balanced sensitivity.
Pattern Filter :
Very Aggressive : Detects all patterns based on point sequence with no structural checks.
Aggressive : Ensures each leg is no more than 2x the size of the previous one.
Defensive : Requires each leg to be at least 2% the size of the previous leg.
Very Defensive : The strictest level; only confirms patterns when price touches trendlines.
Candle Confirmation : When enabled, the indicator requires a valid confirmation candle (doji, pin bar, engulfing) at the interaction point with the trendline before issuing a signal. This reduces false entries and improves entry precision.
🟣 Alert Settings
Alert : Enables alerts for SSS.
Message Frequency : Determines the frequency of alerts. Options include 'All' (every function call), 'Once Per Bar' (first call within the bar), and 'Once Per Bar Close' (final script execution of the real-time bar). Default is 'Once per Bar'.
Show Alert Time by Time Zone : Configures the time zone for alert messages. Default is 'UTC'.
🔵 Conclusion
The Expanding Triangle pattern, with its wide structure and volatility-driven nature, represents chaos but also opportunity. For traders who can read its behavior, it provides some of the most powerful setups for reversals, breakouts, and range-based trades. While the pattern may seem messy at first glance, it is built on clear logic and when properly detected, it offers high-probability opportunities.
This indicator doesn’t just draw expanding triangles it intelligently evaluates their structural quality, validates price interaction through candle confirmation, and allows the trader to fine-tune the detection logic through adjustable filter levels. Whether you’re a reversal trader looking for a turning point, or a breakout trader hunting momentum, this tool adapts to your strategy.
In volatile or uncertain markets, where fakeouts and sudden shifts are common, this indicator can become a cornerstone of your trading system helping you turn volatility into structured, high-quality opportunities.
Trianglepattren

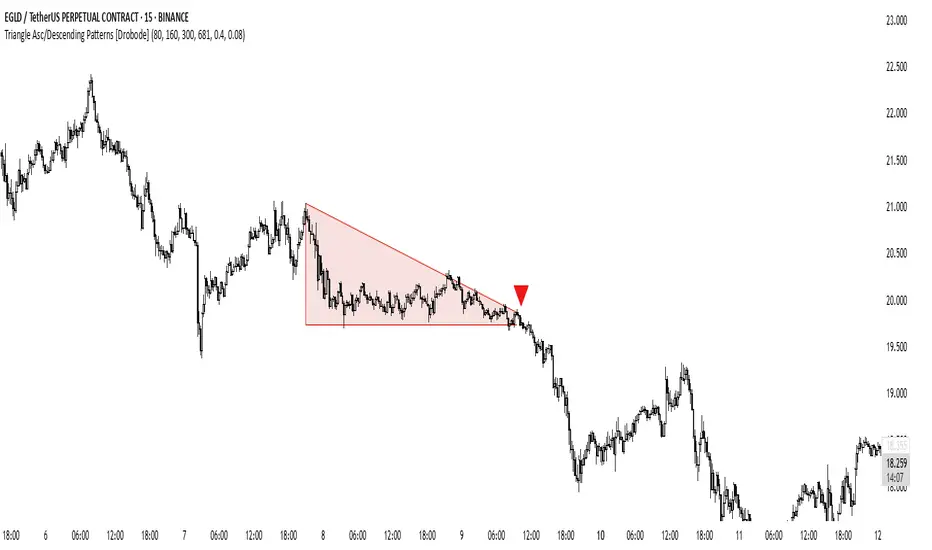
Triangle Asc/Descending Patterns [Drobode]█ DESCRIPTION
The script automatically tracks the descending or ascending triangle pattern. The script provides advanced settings, allowing you to adjust the pattern accuracy from high to low depending on your needs and technical analysis style. The main goal of the script is to facilitate the routine work of a trader in identifying certain trading situations (patterns). However, you should understand that the script is not a full-fledged self-sufficient strategy, in case of receiving a signal, it is recommended that you additionally conduct a comprehensive thorough analysis before taking trading actions. The script can be useful for traders of all levels, both beginners and experienced analysts. This variation of the script, in case of identifying a pattern, draws a contour triangle with the background color of the figure. The ascending triangle has a blue color, the descending triangle has a red color. The logic of the script provides that one of the legs (one side) of the triangle is always a horizontal line, simultaneously being a line of resistance or support, other variations of triangle patterns are not tracked. According to generally defined beliefs and observations of pattern formation, a descending and ascending triangle may indicate a possible breakdown of the conditional horizontal level to which the price of the instrument has approached, however, at the same time it is necessary to deeply analyze many other factors at this point, in particular, such as volumes, consolidation, volatility, and so on.
█ SCRIPT SETTINGS
By default, the script was pre-developed and tested on the M15 timeframe with the USDT.P crypto futures instruments.
Alert
The Alert function in the script is enabled by default, you just need to activate the Alert in the TradingView window and select the signal source - Triangle Asc/Descending Patterns .
The notification provides the following information (example):
Triangle_Ascending
Ticker- EGLDUSDT.P
Price-19.754
Timeframe- 15
Period length-160
Periods length
The script allows you to set the period length (number) of bars on which the calculation will be performed. Different periods make it possible to cover more timeframes (in particular, larger timeframes). The calculation is performed simultaneously on all periods, but you can turn off "Period length 3" and "Period length 4" by clicking on the check mark, this can speed up the script. The following period values are set by default: "Period length 1" – 80,
"Period length 2" – 160, "Period length 3" – 300, "Period length 4" – 681.
Percentage deviation of extremes
The next settings are the percentage deviation from the hypotenuse and horizontal leg, which creates the zone in which the extremes of the bars that will form the triangle shape should be. The smaller the deviation, the greater the accuracy and the closer to the hypotenuse and leg the bar extrema should be, however, in this case the number of pattern identifications will be smaller. By default, the deviation zone from the hypotenuse "Deflection zone of tangents to the hypotenuse" is - 0.4%, the deviation zone from the horizontal leg "Tangent deviation zone horizontal leg" is - 0.08%.
The presence of extrema at certain points on the sides of a triangle
The last block of settings are the conditions that increase the accuracy of the proportions of the pattern figure. These settings are aimed at confirming the presence of extrema in certain areas along the hypotenuse and horizontal leg. Thus, enabling "Extrema on the horizontal leg almost along the entire length" means that only those triangles will be tracked in which the horizontal leg zone has extrema almost along the entire length of this leg, this increases the accuracy but reduces the number of detected patterns. "Extremes present on second half of horizontal leg (more than 50%)" assumes that only those triangles will be tracked in which the extrema are present on the second half of the length of the given leg (more than 50%) in the zone of the horizontal leg. "Presence of an extrema in the middle region of the hypotenuse" assumes that only those triangles will be tracked in which the extrema are present on a certain segment of length in the central region of the hypotenuse.
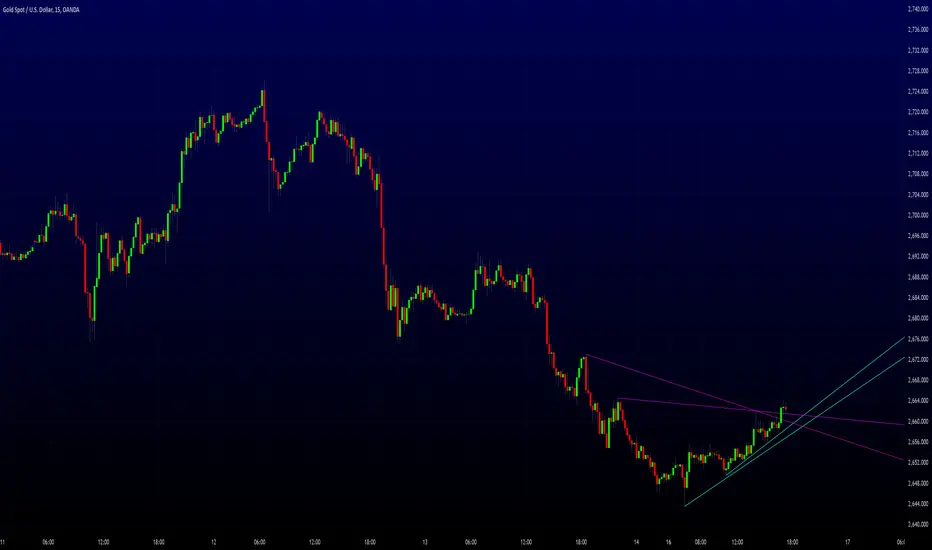
Auto Trend Line (ATL) IndicatorAuto Trend Line (ATL) Indicator
Description:
The Auto Trend Line indicator is an useful tool designed to automatically identify and draw key support and resistance levels on your chart. These levels are calculated based on historical price action, providing traders with a visual guide to potential market turning points. The indicator is highly customizable, allowing users to adjust parameters for history bars, factor values, and range values, ensuring adaptability to various trading strategies and timeframes.
Key Features:
• Automatic Support and Resistance Detection: Uses advanced algorithms to identify significant price levels.
• Customizable Line Styles and Colors: Personalize the appearance of support and resistance lines for clarity.
• Dynamic Updates: Adjusts lines in real-time based on price action.
• Extended Visibility: Draws lines that extend into the future, offering potential zones of interest for upcoming price movements.
Inputs:
• History Bars Count: Controls the range of historical data used in calculations.
• Factor and Range Values: Fine-tune the sensitivity of trend line detection.
• Line Styles and Colors: Choose between solid, dotted, or dashed lines for support and resistance, with customizable colors.
Use Case:
This indicator is ideal for traders who rely on support and resistance levels for decision-making in various markets, including stocks, forex, and cryptocurrencies. By automating the detection of these critical levels, the Auto Trend Line indicator saves time and eliminates subjective bias, empowering traders to focus on their strategies.
Explore the Auto Trend Line indicator to enhance your trading insights!
Developed by iSTAGs
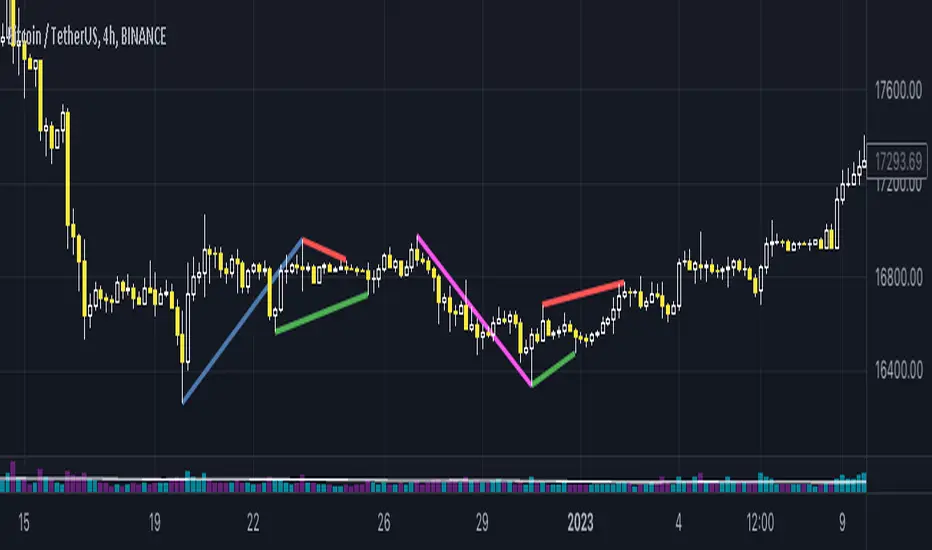
wedges and flagsThis script identifies chart patterns: wedges, flags, triangles on the chart
It has many settings. You can choose by which extremums you want to identify patterns - by the edges of wicks (tails, shadows), or by the edges of candle bodies .
You can also adjust the accuracy - how smooth and accurate the shapes must be in order for them to be considered wedges or triangles.
You can also customize other parameters of the figure, for example, how long the flagpole should be in order to consider such a figure a wedge, a flag or a triangle.
You can also set how large the allowable spread of candles relative to the flagpole can be.
The Sensitivity parameter - will allow you to control the number of patterns detected depending on whether you want the patterns to be detected more often, or if they cover more candles and thus be more reliable
You can also customize your styles.
All key settings are accompanied by tooltips
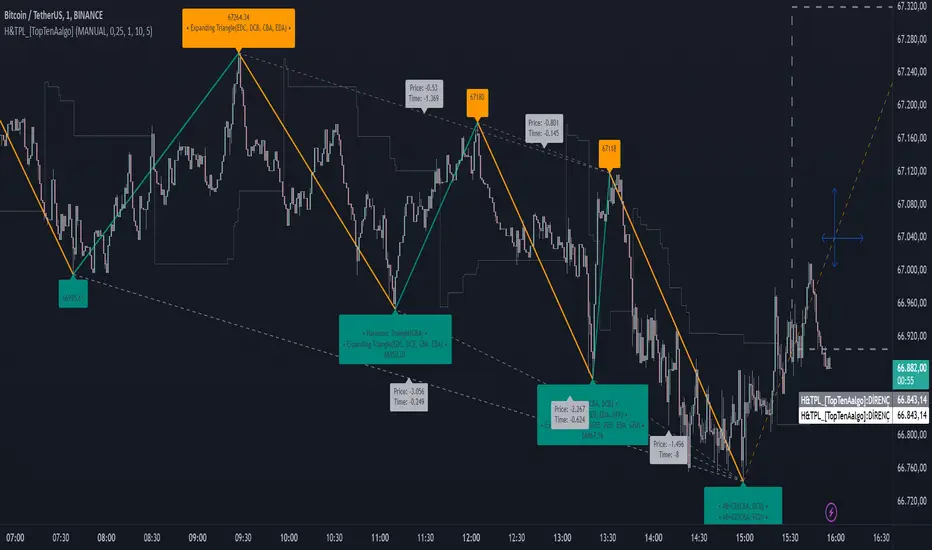
TopTenAlgo 9. Formation & Patterns HuntersEN:
• All Harmonic and Triangle Formation Patterns and OBO (Added) Displays labels with detected patterns.
• Displays the slope information rate of price, time difference and pricing angle (Experimental, Vary.)
• It shows the effects such as Target Price, Stoploss price or formation start price.
• It instantly detects the formation changes and allows you to make a reversal.
This algorithm is prepared with @Top10Algo ...
TR:
• Tüm Harmonik ve Triangle Formayon Kalıpları ile OBO(Eklendi). Algılanan kalıplara sahip tüm etiketleri görüntüler.
• Fiyat, zaman farkı ve fiyatlama açısının eğim bilgi oranını görüntüler (Deneysel, Değişiklik Gösterebilir.)
• Hedef Fiyat, Stoploss fiyatı yada formasyon başlangıç fiyatı gibi etkiketleri gösterir.
• Formasyon değişiklerini anında algılayarak hızlı dönüş (reversal) yapmanızı sağlar.
Bu algoritma @Top10Algo ile beraber hazırlanmıştır...
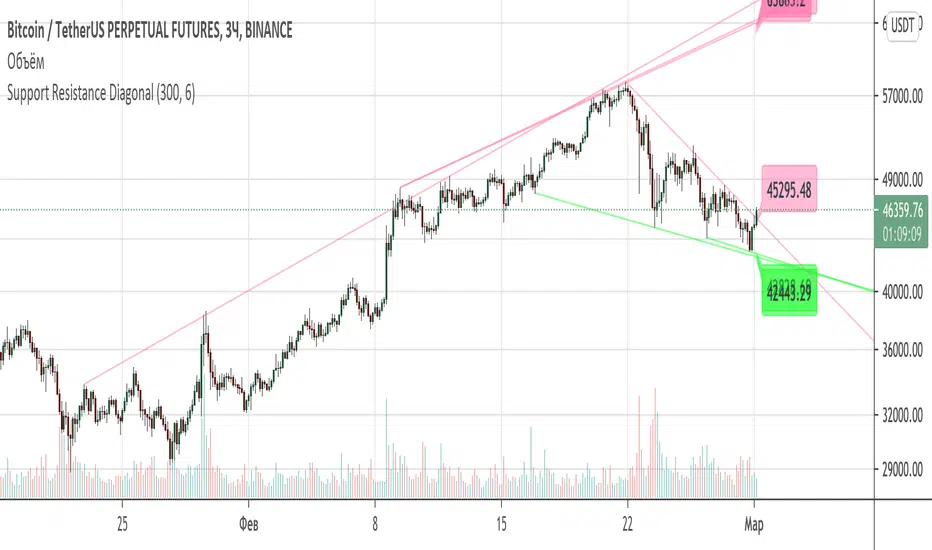
Support Resistance DiagonalClassic diagonal support and resistance based on pivot points. As a result, they form triangles, wedges, channels and other patterns. Realtime update up to 1 second chart.