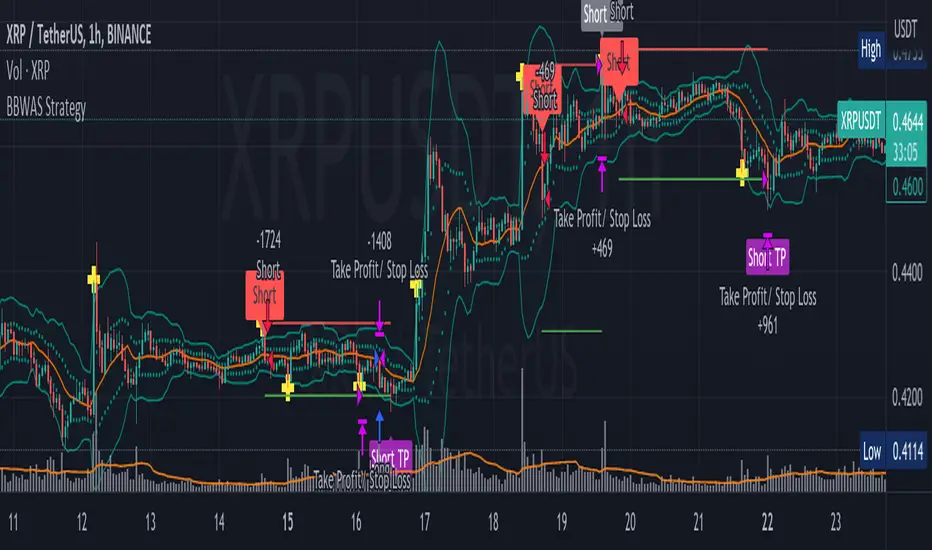
BBWAS StrategyA breakout in trading refers to a situation where the price of a security or asset moves beyond a defined level of support or resistance, which is typically indicated by technical analysis tools like Bollinger Bands . Bollinger Bands consist of three lines: the upper band, the lower band, and the middle band (or basis). The upper and lower bands are set at a specified number of standard deviations away from the middle band, and they help to define the range within which the price of an asset is expected to fluctuate.
When the price of the asset moves beyond the upper or lower band, it is said to have "broken out" of the range. If the price closes below the lower band, it is considered a bearish breakout, and if it closes above the upper band, it is considered a bullish breakout.
Once a breakout occurs, traders may look for a confirmation signal before entering a trade. In this case, crossing the middle line (or basis) after a breakout may signal a potential trend reversal and a good opportunity to enter a long or short trade, depending on the direction of the breakout.
Overall, this script provides a customizable and flexible system for traders to use Bollinger Bands to identify breakout trades, with additional features to incorporate volume and RSI divergence. The dynamic TPSL system also allows traders to manage their risk and reward by automatically setting take-profit and stop-loss levels based on the volatility of the market.
Dear traders, while we strive to provide you with the best trading tools and resources, we want to remind you to exercise caution and diligence in your investing decisions.
It is important to always do your own research and analysis before making any trades. Remember, the responsibility for your investments ultimately lies with you.
Happy trading!
Volatility
I11L - Better Buy Low Volatility or High Volatility?This Pine Script code defines a TradingView strategy called "I11L - Better Buy Low Volatility or High Volatility?". The strategy aims to study the difference between buying when an asset's volatility is low and when it is high. It allows the user to select whether to buy during low or high volatility periods by changing the input variable mode.
Here's a brief explanation of the System:
The strategy is initialized with relevant settings such as overlay, pyramiding, default quantity type, initial capital, and others.
The mode input allows the user to choose between "Buy low Volatility" and "Buy high Volatility" options.
volatilityTargetRatio is the user-defined threshold to be used for making buy decisions. A value of 1 equals the average ATR (Average True Range) for the security. A lower value indicates lower volatility.
atrLength is the number of periods to calculate the ATR.
sellAfterNBarsLength sets the number of bars to hold the position before selling it.
The script calculates the ATR using the ta.atr() function, and then divides it by the closing price to normalize the value. It also calculates the simple moving average (SMA) of the normalized ATR over a period of 5 times the ATR length, and then computes the ratio between the normalized ATR and its average.
The script keeps track of the number of holding bars using the variable holdingBarsCounter. When there are open trades, the holding bars counter is incremented.
The decision to buy is made based on the selected mode and whether the computed ratio is above or below the user-defined threshold.
When the holding bars counter exceeds the user-defined limit, the position is closed.
The script plots the computed ratio with different colors based on the buy and close conditions. The ratio is plotted in green when a buy signal is triggered, red when a close signal is triggered, and white in all other cases. The value of 1 (the reference for the average ATR) is also plotted on the chart in white color.
This strategy helps traders study the difference between buying during low and high volatility periods and compare the performance of these conditions. It can be useful for analyzing the effectiveness of volatility-based trading strategies, such as entering positions when the market is calm or during periods of strong price movement.

Extended Price Volume Trend Strategy : EducationalThe Extended Price Volume Trend (EPVT) is a technical indicator that is used to identify potential trend changes and measure the strength of a trend. In this strategy, we combine the EPVT with other indicators to create a trading system that aims to capture trend reversals and momentum shifts.
The EPVT indicator is calculated by taking the cumulative volume and multiplying it by the percentage change in price. We then find the highest and lowest values of this indicator over a certain period of time to determine the baseline. The difference between the EPVT and the baseline is then plotted on a chart to create the EPVT line.
To use this indicator for trading, we look for crossovers of the EPVT line with zero. When the EPVT crosses above zero, it indicates that buying pressure is increasing, and we may consider taking a long position. Conversely, when the EPVT crosses below zero, it indicates that selling pressure is increasing, and we may consider taking a short position.
To further refine our trading signals, we use three take-profit levels, which we set as a percentage of the current EPVT value. We also use a simple moving average to provide additional confirmation of trend changes.
In summary, the EPVT trading strategy is a technical analysis-based approach to trading that aims to identify potential trend reversals and momentum shifts. By combining the EPVT indicator with other technical tools, we can create a comprehensive trading system that provides clear entry and exit signals for both long and short positions. Please note that this strategy is for educational purposes only and should not be taken as financial advice.

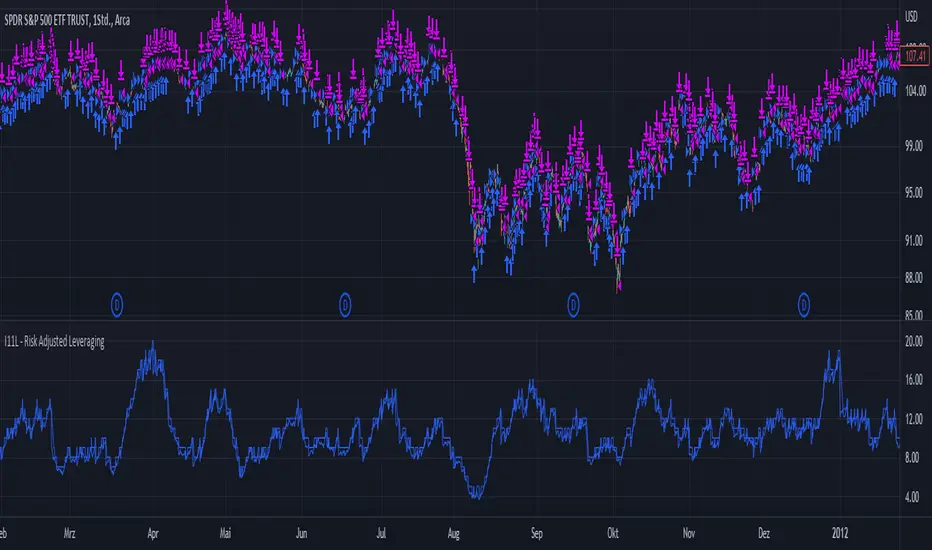
I11L - Risk Adjusted LeveragingThis trading system, called "I11L - Risk Adjusted Leveraging", is designed to manage trades based on the current market volatility relative to its historical average. The system calculates the target number of open trades based on the ATR (Average True Range) indicator and adjusts the leverage accordingly. The system opens and closes trades using a pyramiding approach, allowing multiple positions to be opened at the same time.
Here's a step-by-step explanation of the system:
1. Calculate the ATR with a 14-day period and normalize it by dividing it by the current closing price.
2. Calculate the 100-day simple moving average (SMA) of the normalized ATR.
3. Calculate the ratio of the normalized ATR to its 100-day SMA.
4. Determine the target leverage based on the inverse of the ratio (2 / ratio).
5. Calculate the target number of open trades by multiplying the target leverage by 5.
6. Plot the target number of open trades and the current number of open trades on the chart.
7. Check if there's an opportunity to buy (if the current number of open trades is less than the target) or close a trade (if the current number of open trades is more than the target plus 1).
8. If there's an opportunity to buy, open a long trade and add the trade's name to the openTrades array.
9. If there's an opportunity to close a trade and there are trades in the openTrades array, close the most recent trade by referencing the array and remove it from the array.
This system aims to capture trends in the market by dynamically adjusting the number of open trades and leverage based on the market's volatility. It uses an array to keep track of open trades, allowing for better control over the opening and closing of individual trades.
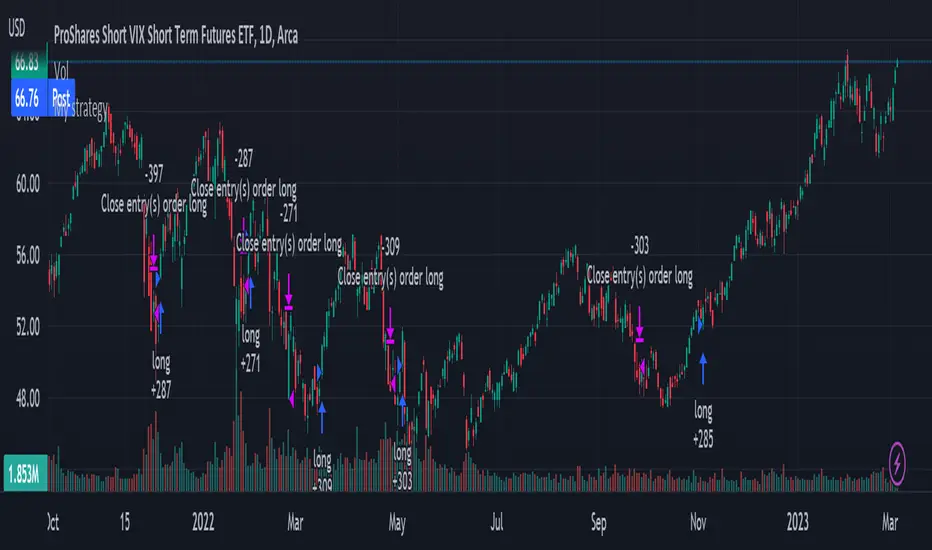
CAPTURING THE VIX FUTURES ROLL YIELD
Our trading strategy utilizes the VIX term structure as a tool for gaining valuable insights on market sentiments. We identify the relationship between VIX futures prices and maturity dates, which can be either contango or backwardation. The slope of the VIX term structure is also a leading indicator and usually changes direction before volatility changes.
To execute this strategy, we use volatility ETNs, such as SVXY, which is a portfolio of short front and next month VIX futures. We have observed that the VIX quite often leads the S&P 500, and when this occurs, the signal lets us know whether to be long or short.
Additionally, we consider the difference between future and cash prices, which is often called roll yield. When the VIX futures term structure is in contango, roll yield is positive, and when it is in backwardation, roll yield is negative. We use a combination of the VIX term structure and roll yield to trade VIX ETNs.
When roll yield is positive over time, VIX ETNs tend to lose value. To earn a positive return, we take a long position in inverse VIX ETN, such as SVXY. However, buy and hold SVXY performance is mediocre. Therefore, we can improve the performance by making use of roll yield. We go long SVXY when roll yield is positive, and when yield is negative, we go long VXX. This strategy allows us to effectively trade VIX ETNs by using a combination of, VIX term structure, and roll yield to make informed trading decisions.
Self Optimizing Supertrend [Starbots]Self Optimizing Supertrend Strategy. (non-repainting)
Script constantly tests 15 Supertrend combinations for maximum profitability and trades based on the best performing combination.
You will notice that signal lines switch after a bar close sometimes, this is when the strategy optimizes to the better combination and change plots, strategy is dynamic.
---------------------------------------------------------------------------------------------------------
# Average True Range (ATR)
The Average True Range (ATR) is a tool used in technical analysis to measure volatility. Unlike many of today's popular indicators, the ATR is not used to indicate the direction of price. Rather, it is a metric used solely to measure volatility, especially volatility caused by price gaps or limit moves.
# Supertrend
A Super Trend is a trend following indicator similar to moving averages. It is plotted on price and the current trend can simply be determined by its placement vis-a-vis price. It is a very simple indicator and is constructed with the help of just two parameters- period and multiplier.
When we construct the Supertrend indicator strategy, the default parameters are 10 for Average True Range (ATR) and 3 for its multiplier. The average true range (ATR) plays a key role in ‘Supertrend’ as the indicator uses ATR to compute its value and it signals the degree of price volatility.
-----------------------------------------------------------------------------------------------------------
-Turn on Supertrend Profit Dashboard and spot the worst/best performing combination. You can change them to get the best performance overall.
-Backtesting Range - backtest within your desired time window. Example: 'from 01 / 01 /2020 to 01 / 01 /2023'.
-Optimizing range - you can decrease the amount of bars/data for optimizing script. This way you can keep it up to date to more recent market by selecting optimizing range to optimize it just from the recent 3-6months of data for example. Strategy before this selected range will normally trade (backtest) based on the fifth buying condition (5. Supertrend Factor) parameter in your menu (1.6 by default) if you turn this on.
*I recommend 'Optimizing Range' turned off actually, use max amount of available bars in your history for optimization script.
- Strategy is trading on the bar close without repaint. You can trade Long-Sell or Long- Short. Alerts available, insert webhook messages.
- Turn on Profit Calendar for better overview of how your strategy performs monthly/annualy
- Recommended ATR Length : 10 (default), higher timeframes usually performs good on the shorter period lengths 6-10, smaller timeframes on the larger ATR period length 10-20.
- Recommended Sources : hl2 (default Supertrend), close, hlc3, hlcc4 (when scalping/day trading and market is uptrending good, you can use 'volume' as a source, comes in handy)
- Recommended Smoothing Moving Average for ATR : We smooth the ATR calculation with moving average, traders usually use SMA as a moving average here, but you can use alternatives like EMA, HMA. Try them if this improves your results.
- Recommended TF : 15min, 30min, 1h, 2h, 4h, 8h, 1d (low timeframes works good if you have no fees like Binance currently do on BTC for example otherwise you probably want to use 1/2h+ chart)
- Supertrend Factor parameters : pre-set Supertrend Factors are very good and common in trading world, you don't need to change them, but you can do it at free will. Traders usually use Supertrend factor of 2 or 3, use parameters around this numbers.
- Notes window : add your custom comments in or save your webhook message text inside here for later use.
- Trading Session: in a session, you have to specify the time range for every day. It will trade only within this window and close trades when it's out. Session from 9am to 5pm will look like that: 0900-1700 or 7am to 4:30pm 0700-1630. After the colon, you can specify days of the week for your trading session. 1234567 trading all days, 23456 – Monday to Friday ('1 is Sunday here'). 0000-0000:1234567 by default will trade every day nonstop. 00.00am to 00.00pm and 1234567 every day of the week for example - Cryptocurrencies.
This script is simple to use for any trader as it saves a lot of time for searching good parameters on your own. It's self-optimizing and adjusting to the markets on the go.

Baseline Cross Qualifier Volatility Strategy with HMA Trend BiasFor trading ES on 30min Chart
Trading Rules
Post Baseline Cross Qualifier (PBCQ): If price crosses the baseline but the trade is invalid due to additional qualifiers, then the strategy doesn't enter a trade on that candle. This setting allows you override this disqualification in the following manner: If price crosses XX bars ago and is now qualified by other qualifiers, then the strategy enters a trade.
Volatility: If price crosses the baseline, we check to see how far it has moved in terms of multiples of volatility denoted in price (ATR x multiple). If price has moved by at least "Qualifier multiplier" and less than "Range Multiplier", then the strategy enters a trade. This range is shown on the chart with yellow area that tracks price above/blow the baseline. Also, see the dots at the top of the chart. If the dots are green, then price passes the volatility test for a long. If the dots are red, then price passes the volatility test for a short.
Take Profit/Stoploss Quantity Removed
1 Take Profit: 100% of the trade is closed when the profit target or stoploss is reached.
2 Take Profits: Quantity is split 50/50 between Take Profit 1 and Take Profit 2
3 Take Profits: Quantify is split 50/25/25.
Stratgey Inputs
Baseline Length
37
Post Baseline Cross Qualifier Enabled
On
Post Baseline Cross Qualifier Bars Ago
9
ATR Length
9
Volatility Multiplier
0
Volatility Range Multiplier
10
Volatility Qualifier Multiplier
2
Take Profit Type
1 Take Profit
HMA Length
11

Exponential Stochastic Strategywhat is Exponential Stochastic?
it is a modified version of the stochastic indicator. This strategy does not include pyramiding, repaint, trailing stop or take profit.
what it does?
It contains an extra input in addition to the stochastic indicator. Thanks to this input, different exponential weights can be given to the outputs and the indicator can be made more sensitive or insensitive. The strategy buys when the indicator leaves the overbought zone, sells when it leaves the oversold zone and always stays in the trade.
how it does it?
it uses this formula: i.hizliresim.com
Thanks to this formula, even if the weights given to the outputs change, the indicator always continues to take a value between 0 and 100.
how to use it ?
With the input named "exp", you can change the sensitivity of the indicator and develop different strategies. other inputs are the same as the stochastic indicator. Increasing the exp value causes the indicator to signal less, decreasing it makes it much more sensitive.

Wunder Volatility botWunder Volatility bot
We have used the Average True Range (ATR) in many of its trading versions.
1. ATR with MA. This indicator includes the ATR as well as the simple moving average, which helps to restore the expected market.
2. We apply percentage based ATR to determine how volatile the market is and whether to buy or sell at that time. For trading, we will filter the market and make trades only within the specified range. This range will adjust depending on the asset, so you will need to change the settings if you are trading multiple assets.
3. A function for calculating risk on the portfolio (your deposit) has been added to the Wunder Volatility bot script. When this option is enabled, you get a calculation of the entry amount in dollars relative to your Stop Loss. In the settings, you can select the risk percentage on your portfolio. The loss will be calculated from the amount that will be displayed on the chart.
For example, if your deposit is $1000 and you set the risk to 1%, with a Stop Loss of 5%, the entry volume will be $200. The loss at SL will be $10.10, which is your 1% risk or 1% of the deposit.
**Important!** The risk per trade must be less than the Stop Loss value. If the risk is greater than SL, then you should use leverage.
The amount of funds entering the trade is calculated in dollars. This option was created if you want to send the dollar amount from Tradingview to the exchange. However, putting your volume in dollars you get the incorrect net profit and drawdown indication in the backtest results, as TradingView calculates the backtest volume in contracts.
To display the correct net profit and drawdown values in Tradingview Backtest results, use the ”Volume in contract” option.

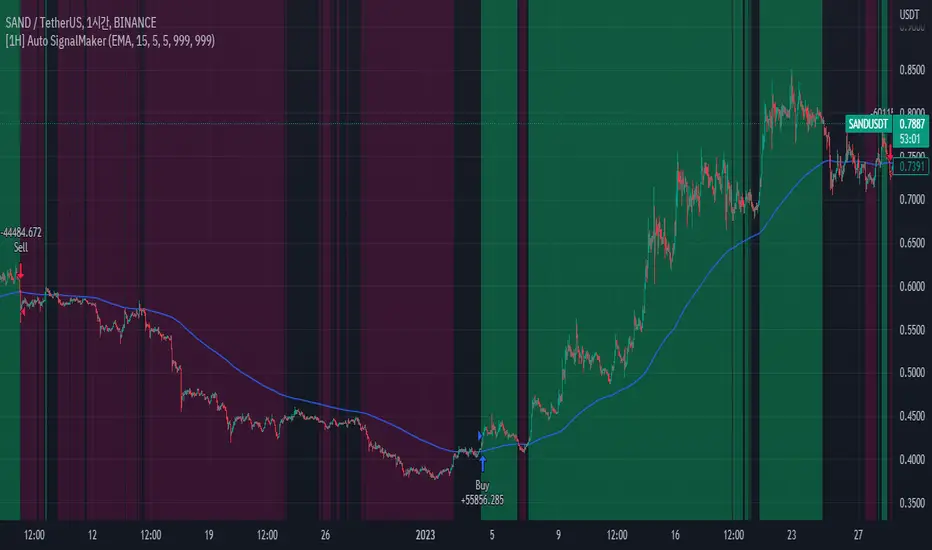
[1H] Auto SignalMakerBINANCE:SANDUSDT
this strategy is Squeeze Momentum strategy is the on base.
And we added custom ma filter and risk management method. this is not repaint.
This strategy is a long-term strategy.
Use stop loss and profit.
All trading involves high risk; past performance is not necessarily indicative of future results. Hypothetical or simulated performance results have certain inherent limitations.
Unlike an actual performance record, simulated results do not represent actual trading.
Also, since the trades have not actually been executed, the results may have under- or over-compensated for the impact, if any, of certain market factors, such as lack of liquidity.
Simulated trading programs in general are also subject to the fact that they are designed with the benefit of hindsight.
No representation is being made that any account will or is likely to achieve profits or losses similar to those shown.
[US30-GOLD] Keltner Channel & Moving Average [2 orders]TREND IDENTIFICATION: Keltner Channels, Moving Average.
- Keltner Channels:
... Keltner Channels long when closes candle crossover Upper 2.
... Keltner Channels short when closes candle crossunder Lower 2.
- Moving average : 50
... MA long when closes candle above MA 50.
... MA short when closes candle below MA 50.
OPEN TRADE RULE:
- Open a buy when K crossover D and D > 50.
- Open a sell when K crossunder D and D < 50
* Open 2 positions avoids to miss the first.
HISTORY BACKTESTING RESULT:

Strategy Myth-Busting #11 - TrendMagic+SqzMom+CDV - [MYN]This is part of a new series we are calling "Strategy Myth-Busting" where we take open public manual trading strategies and automate them. The goal is to not only validate the authenticity of the claims but to provide an automated version for traders who wish to trade autonomously.
Our 11th one is an automated version of the "Magic Trading Strategy : Most Profitable Indicator : 1 Minute Scalping Strategy Crypto" strategy from "Fx MENTOR US" who doesn't make any official claims but given the indicators he was using, it looked like on the surface that this might actually work. The strategy author uses this on the 1 minute and 3 minute timeframes on mostly FOREX and Heiken Ashi candles but as the title of his strategy indicates is designed for Crypto. So who knows..
To backtest this accurately and get a better picture we resolved the Heiken Ashi bars to standard candlesticks . Even so, I was unable to sustain any consistency in my results on either the 1 or 3 min time frames and both FOREX and Crypto. 10000% Busted.
This strategy uses a combination of 3 open-source public indicators:
Trend Magic by KivancOzbilgic
Squeeze Momentum by LazyBear
Cumulative Delta Volume by LonesomeTheBlue
Trend Magic consists of two main indicators to validate momentum and volatility. It uses an ATR like a trailing Stop to determine the overarching momentum and CCI as a means to validate volatility. Together these are used as the primary indicator in this strategy. When the CCI is above 0 this is confirmation of a volatility event is occurring with affirmation based upon current momentum (ATR).
The CCI volatility indicator gets confirmation by the the Cumulative Delta Volume indicator which calculates the difference between buying and selling pressure. Volume Delta is calculated by taking the difference of the volume that traded at the offer price and the volume that traded at the bid price. The more volume that is traded at the bid price, the more likely there is momentum in the market.
And lastly the Squeeze Momentum indicator which uses a combination of Bollinger Bands, Keltner Channels and Momentum are used to again confirm momentum and volatility. During periods of low volatility, Bollinger bands narrow and trade inside Keltner channels. They can only contract so much before it can’t contain the energy it’s been building. When the Bollinger bands come back out, it explodes higher. When we see the histogram bar exploding into green above 0 that is a clear confirmation of increased momentum and volatile. The opposite (red) below 0 is true when there are low periods. This indicator is used as a means to really determine when there is premium selling plays going on leading to big directional movements again confirming the positive or negative momentum and volatility direction.
If you know of or have a strategy you want to see myth-busted or just have an idea for one, please feel free to message me.
Trading Rules
1 - 3 min candles
FOREX or Crypto
Stop loss at swing high/low | 1.5 risk/ratio
Long Condition
Trend Magic line is Blue ( CCI is above 0) and above the current close on the bar
Squeeze Momentum's histogram bar is green/lime
Cumulative Delta Volume line is green
Short Condition
Trend Magic line is Red ( CCI is below 0) and below the current close on the bar
Squeeze Momentum's histogram bar is red/maroon
Cumulative Delta Volume line is peach

ATR Mean Reversion Strategy V1**Long Only Strategy**
When Price drops below the ATR band below it will enter a buy on the next candle open
SL at current price minus ATR* ATR multiplier
TP at Mean EMA or if higher than Mean EMA and current candle low is below previous candle low or if price is above ATR
NB: I would highly recommend a low fee broker (I use ICmarkets raw spread account) due to the fact that this is a decently high frequency trading strategy you will rack up a lot of commission, if you use and exchange like Bybit or Binance the strategy will not be profitable due to the high commissions.

DCA Simulator A simple yet powerful Dollar Cost Averaging (DCA) simulator.
You just add the script to your chart, and you'll be able to see:
- Every single entry with its size
- The evolution of you average price in time (blue line)
- The profit and loss areas (where market price < average price the DCA is at loss, and the background is colored in red. At the contrary, where mkt price is > average price, it's profit area and the background is green).
- Max drawdown: the point in price and time where the DCA loss is maximum in the considered time interval. The drawdown amount is specified.
- Profit (or loss) and total cost at the end of the time interval or at the present day: the script shows how much the DCA is netting at a profit or loss, as well as the total cost of the DCA itself.
The parameters are:
- Date start and date end: time interval of the DCA simulation
- DCA period (you can choose between daily, weekly and monthly)
- Week day or month day if you choose those periods
- Single operation size (in base currency)
- Option to choose a DCA LONG or DCA SHORT (for uber bears)
- Option to include an exit strategy that partially closes your position (the % size closed can be chosen as well with the parameter "exit_close_perc") every time the DCA realizes a specific gain (choosable with the parameter "exit_gain_threshold"). If you choose "none" as an exit strategy, the script will assume to never close positions until the end of the period or the present day for simulation purpose.
NB: just ignore the TV strategy tester results, all the data are visible on the chart.

GAVAD - Selling after a Strong MovimentThis strategy search for a moment whe the market make two candles are consistently strong, and open a Sell, searching the imediactly correction, on the new candle. It`s easy to see the bars on the histogram graph. Purple Bars represent the candle variation. when on candle cross ove the Signal line the graph plot an Yellow ci, if the second bar crossover the signal a green circle is ploted and the operation start on start of the next candle.
This strategy can be used in a lot of Stocks and other graphs. many times we need a small time of graph, maybe 1 or 5 minutes because the gain shoud be planned to a midle of the second candle. You need look the stocks you will use.
Stocks > 100 dolars isnt great, markets extremly volatly not too. but, Stocks that have a consistently development are very interisting. Look to markets searching maybe 0.5% or 1%.
For this moment, I make the development of a Brasilian Real x American Dollar. In 15 Minutes.
if you use in small timeframe the results can be better.
On this time we make more than 500 trades with a small lot of contracts, without a big percent profitable, but a small profit in each operation, maybe you search more than. To present a real trading system I insert a spreed to present a correct view of the results.
Each stock, Index, or crypto there is a specific configuration?
my suggestion for new stocks
You need choice a stock and using the setup search set over than 70% gain (percent profitable), using a 1% of gain and loss between 1-2%
as the exemple (WDO)
default I prepare a Brazilian Index
6-signal (6% is variation of a candle of the last candle)
10000- multiplicator (its important to configure diferences betwen a stock and an Indice)
gain 3 (this proportion will be set looking you target, how I say, 1% can be good)
loss 8 (this proportion will be set with you bankroll management, how I say, maybe 2%, you need evaluate)
for maximize operations I use in the 1 or 5 minute graph. Timeframes more large make slowlly results,
(but not unable that you use in a 1 hour or a 1 day.)
I make this script by zero. Maybe the code doesnt so organized, but is very easy to understand. If you have any doubts . leave a comment.
I hope help you.

TradePro's 2 EMA + Stoch RSI + ATR StrategySaw TradePro's "NEW BEST HIGHEST PROFITING STRATEGY WITH CRAZY RESULTS - 2 EMA+ Stochastic RSI+ ATR", and was curious on the back testing results. This strategy is an attempt to recreate it.
This strategy uses 50 / 200 EMAs, Stochastic RSI and ATR.
Long Entry Criteria:
- 50 EMA > 200 EMA
- Price closes below 50 EMA
- Stochastic RSI has gone into oversold < 20
- Stochastic RSI crosses up while making higher low from previous cross up
Short Entry Criteria:
- 50 EMA < 200 EMA
- Price closes above 50 EMA
- Stochastic RSI has gone into overbought > 80
- Stochastic RSI crosses down while making lower high from previous cross down
Stop-loss is set to ATR stop-loss
Take Profit is 2x the risk
All parameters are configurable.
Enjoy~~

Strategy: Range BreakoutWhat?
In the price action, levels have a significant role to play. Based on the price moving above/below the levels - the underlying instrument shows some price-action in the direction of breakout/breakdown.
There are plenty of ways level can be determined. Levels are the decision point to take a trade or not. But if we make the level derivation complex, then the execution may get hamper.
This strategy script, developed in PineScript v5, is our attempt at solving this problem at the core by providing this simple, yet elegant solution to this problem.
It's essentially an attempt to Trade Simple by drawing logical (horizontal) lines in the chart and take actions, after multiple associated parameters confirmation, on the breakout / breakdown of the levels.
How?
Let us explain how we are drawing the levels.
We are depending on some of the parameters as described below:
Open Range : During intraday movement, often if prices move beyond a particular level, it exibits more movement in the same swing in same direction. We found out, through our back testing for Indian Indices like NSE:NIFTY , NSE:BANKNIFTY or NSE:CNXFINANCE the first 15m (i.e 09:15 AM to 09:30 AM, IST) is one of such range. For Indian stocks, it is 9:15 to 9:45. And for MCX MCX:CRUDEOIL1! it's 5:00 pm to 6:00 pm. There are our first levels.
PDHCL : Previous Day High, Close, Low. This is our next level
VWAP : The rolling VWAP (volume weighted average price)
In the breakout/breakdown of the Open Range and Previous Day High/Low, we are taking the trade decisions as follows using CEST principle:
C onditions :
If current bar's (say you are in 5m timeframe) closing is broken out the Open Range High or Previous Day High, taken a Buy/Long decision (let's say buying a Call Option CE or selling a Put Option PE or buying the future or cash).
If current bar's (say you are in 5m timeframe) closing is broken down the Open Range Low or Previous Day Low, taken a Sell/Short decision (let's say buying a Put Option CE or selling a Call Option PE or selling the future or cash).
Additionally, and optionally (default ON, one can turn off): we are checking various other associated multiple confirmations as follows:
1. Momentum : Checking 14-period RSI value is more than 50 or less than 50 (all parameters like period, OB, OS ranges are configurable through settings)
2. Current bar's volume is more than the last 20 bars volume average. How much more - that multiplier is also configurable. (default is 1)
3. The breakout candle is bullish (green) or bearish (red).
E ntry :
All of these happens only on the closing of the candle . Means: Non Repainting! .
Clearly in the chart we are showing as green up arrow BO (breakout for buy) and red down arrow BD (breakdown for sell) to take your decision process smooth.
So, on the closing of the decision BO/BD candle we are entering the trade (with a thumping heart and nail biting ...)
S top Loss :
We are relying on the time tasted (last 40 years) mechanism of Average True Range (ATR) of default 14 period. This default period is also configurable.
So for Long trades: the 14 period ATR low band is the SL.
For Short trades: the 14 period ATR high band is the SL.
T arget :
We are depending on the thump rule of 1:2 Risk Reward. It's simple and effective. No fancy thing. We are closing the trade on double the favorable price movement compared to the SL placed. Of course, this RR ratio is confiurable from the settings, as usual.
What's Unqiue in it?
The utter simplicity of this trading mechanism. No fancy things like complex chart pattern, OI data, multiple candlestick patterns, Order flow analysis etc.
Simple level determination,
Marking clearly in the chart.
Making each parameter configurable in Settings and showing tooltip adjacent to the parameter to make you understand it better for your customization,
Wait for the candle close, thus eliminating the chances of repainting menace (as much as possible)
Additional momentum and volume check to trade entry confirmation.
Works with normal candlestick (nothing special ones like HA ...)
Showing everything as a Summary Table (which, again can be turned off optionally) overlaying at the bottom-right corner of the chart,
Optionally the Summary Table can be configured to alert you back (say you get it notified in your email or SMS).
That way, a single, simple, effective trade setup will ease your journey as smooth sail as possible.
Mentions
There are plenty of friends from whom time to time we borrowed some of the ideas while working closely together over last one year.
From tradingview community, we took the spirit of @zzzcrypto123 awesome work done long back (in 2020) as the indicator "ORB - Opening Range Breakout". (We tried to reach him for his explicit consent, unable to catch hold of him).
Some other publicly available materials we have consulted to get the additional checks (like RSI, volume).
Lat word
Use it please and thank you for your constant patronage in following us in this awesome platform. Let's keep growing together.
Disclaimer :
This piece of software does not come up with any warrantee or any rights of not changing it over the future course of time.
We are not responsible for any trading/investment decision you are taking out of the outcome of this indicator.

Strategy Myth-Busting #7 - MACDBB+SSL+VSF - [MYN]This is part of a new series we are calling "Strategy Myth-Busting" where we take open public manual trading strategies and automate them. The goal is to not only validate the authenticity of the claims but to provide an automated version for traders who wish to trade autonomously.
Our seventh one we are automating is the "Magic MACD Indicator: Crazy Accurate Scalping Trading Strategy ( 74% Win Rate )" strategy from "TradeIQ" who claims to have backtested this manually and achieved 427% profit with a 74% winrate over 100 trades in just a 4 months. I was unable to emulate these results consistently accommodating for slippage and commission but even so the results and especially the high win-rate and low markdown is pretty impressive and quite respectable.
This strategy uses a combination of 3 open-source public indicators:
AK MACD BB v 1.00 by Algokid
SSL Hybrid by Mihkel00
Volume Strength Finder by Saravanan_Ragavan
This is considered a trend following Strategy. AK MACD BB is being used as the primary short term trend direction indicator with an interesting approach of using Bollinger Bands to define an upper and lower range and upon the MACD going above the upper Bollinger Bands, it's indicative of an up trend, where as if the MACD is below the lower Bollinger Band, it's indicative of a down trend. To eliminate false signals, SSL Hyrbid is used as a trend confirmation filter, confirming and eliminating false signals from the MACD BB. It does this by validating the price action is above the the EMA and the SSL is positive that is a confirmation of an uptrend. When the price action is below the EMA and the SSL is negative, that is an confirmation of a downtrend. To avoid taking trades during ranged markets, VSF Buyer's Strength is used so the buyers/sellers strength and must be above 50% or the trade will not be inititiated.
Trading Rules
5 min candles but other lower time frames even below 5m work quite well too.
Best results can be found by tweaking these 2 input parameters:
Number Of bars to look back to ensure MACD isn't above/below Zero Line
Number Of bars back to look for SSL pullback
Long Entry when these conditions are true
AK MACD BB BB issues a new continuation long signal. A new green circle must appear on the indicator and these circles should not be touching across the zero level while they were previously red
SSL Hybrid price action closes above the EMA and the line is blue color and then creates a pullback . The pullback is confirmed when the color changes from blue to gray or from blue to red.
VSF Buyers strength above 50% at the time the MACD indicator issues a new long signal.
Short Entry when these conditions are true
AK MACD BB issues a new continuation short signal. A new red circle must appear on the indicator and these circles should not be touching across the zero level while they were previously green
SSL Hybrid price action closes below the EMA and the line is red color then it has to create a pullback . The pullback is confirmed when the color changes from red to gray or from red to blue.
VSF Sellers strength above 50% at the time the MACD indicator issues a new short signal.
Stop Loss at EMA Line with TP Target 1.5x the risk
If you know of or have a strategy you want to see myth-busted or just have an idea for one, please feel free to message me.

PSAR BBPT ZLSMA BTC 1minLong entry:
PSAR gives buy signal
BBPT prints green histogram
ZLSMA is below the price
ZLSMA has uptrend
SL is smaller than the max SL
Optional Sessions and EMA filters
Short entry
PSAR gives sell signal
BBPT prints red histogram
ZLSMA is above the price
ZLSMA has downtrend
SL is smaller than the max SL
Optional Sessions and EMA filters
SL:
Placed below ZLSMA + offset on long
Placed above ZLSMA + offset on short
TP1:
1x the SL by default
Takes no profit by default, 50% is also a good setting
TP2:
2x the SL by default
Take out all remaining position size.
If price reaches TP1, the SL is set to the entry price.

Bull Trend Filtered StochRSI (BTFS)Ride Bull Trends Via Stochastic with Special Rules for Heavy Bullish Bias
TLDR: Long Only Trend Indicator Where you are always entered Long if the stochastic is over the lower band line and the price is above the Donchian Chanel high. Exit when Stochastic RSI is below the lower band.
Indicators:
Filter = Trend/Bullish indicator is Donchian of ema(high) this is set as the highest ema(high, 6) in the last 30 candles. this can be adjusted to fit the market as desired.
**indicator prints green background when the filter condition is satisfied***
Entry Exit = enter when the Stoch RSI is above the given lower trend band. This value is set at 35 but can be adjusted according to risk tolerance and market conditions.
Logic:
this indicator allows a trader to be present during bullish/parabolic trends by only triggering if the close is > than the highest 6 candle average high over the last 30 candles. This filter requires the market to be in a generally bullish posture. If the market is in this condition the stochastic RSI indicator value offers a good gauge of price action and only goes significantly down if price trends below the average range of the rsi period. This filters out noise and keeps a trader from over trading on inconsequential corrections while responding fairly quickly to changes in general trend direction. the response is fast enough to produce an unprofitable amount of false signals if the bull market filter is not implemented. However when used in combination the signals return desirable results in bull trending markets.
Hope this Helps. Happy Trades.
-Snarky Puppy

ATR_RSI_Strategy v2 with no repaint [liwei666]🎲 Overview
🎯 this is a optimized version based on ATR_RSI_Strategy with no-repaint.
Sharpe ratio: 1.4, trade times: 116 ,
trade symbol: BINANCE:BTCUSDTPERP 15M
you can get same backtesting result with the correct settings.
🎲 Strategy Logic
🎯 the core logic is quite simple, use ATR and RSI and SMA
1. when price is in high volatility ( atr_value > atr_ma);
2. wait for a break signal (rsi_value > rsi_buy or rsi_value < rsi_sell);
3. entry Long or Short,use trailing stop-loss to max security and percent TP to keep profit.
🎲 Settings
🎯 there are 7 input properties in script, but I only finetune 4 of them ( bold field below ),
you may change other parameter to get better result by yourself.
atr_length: length to get atr value
atr_ma_length : length of smoothing atr value
atr_ma_norm_min : atr_ma normalized min value, filter high volatility ranges
atr_ma_norm_max : atr_ma normalized max value, filter high volatility ranges
rsi_length : length to get rsi value
rsi_entry: 50 +/- rsi_entry to get entry threshold
trailing_percent: trailing stop-loss percent
🎲 Usage
🎯 the commission set to 0.05% , part of exchange the commission is less than 0.05% in reality,
but I will still use 0.05% in my next script.
🎯 this script use 50% of equity to size positions follow general script position,
you can adjust the value to fix size or 100% of equity to compare result with other strategy,
but I still suggest you use 5-10% of equity for each strategy in reality.
🎯any questions please comment below. if there are any words violate House Rule, please tell me below and i will revise immediately
don't want be hiddened again 😂😂
Additionally, I plan to publish 20 profitable strategies in 2023;
let‘s witness it together!
Hope this strategy will be usefull for you :)
enjoy! 🚀🚀🚀

Weird Renko StratThis strategy uses Renko, it generates a signal when there is a reversal in Renko. When using historical data, it provides a good entry and an okay exit. However, in a real-time environment, this strategy is subject to repaint and may produce a false signal.
As a result, the backtesting result should not be used as a metric to predict future results. It is highly recommended to forward-test the strategy before using it in real trading. I forward test it from 12/18/2022 to 12/21/2022 in paper trading, using the alert feature in Tradingview. I made 60 trades trading the BTCUSDT BINANCE 3 min with 26 as the param and under the condition that I use 20x margin, compounding my yield, and having 0 trading fee, a steady loss is generated: from $10 to $3.02.
This is quite interesting. As if I flip the signal from "Long" to "Short" and another way too, it will be a steady profit from $10 to $21.85. Hence, if I'm trying to anti-trade the real-time alert signal, the current "4 Days Result" will be good. Nevertheless, I still have to forward-test it for longer to see if it will fail eventually.
Dive into the setting of the strategy
- Margin is the leverage you use. 1 means 1x, 10 means 10x. It affects the backtest yield when you backtest
- Compound Yield button is for compound calculation, disable it to go back to normal backtesting
- Anti Strategy button is to do the opposite direction trade, when the original strat told you to "Long", you "Short" instead. Enable it to use the feature
- Param is the block size for the Renko chart
- Drawdown is just a visual tool for you in case you want to place a stop loss (represent by the semitransparent red area in the chart)
- From date Thru Date is to specify the backtest range of the strategy, This feature is turned off by default. It is controlled by the Max Backtest Timeframe which will be explain below
- Max Backtest Timeframe control the From date Thru Date function, disable it to enable the From Date Thru Date function
Param is the most important input in this strategy as it directly affects performance. It is highly recommended to backtest nearly all the possible parameters before deploying it in real trading. Some factors should be considered:
- Price of the asset (like an asset of 1 USD vs an asset of 10000 USD required different param)
- Timeframe (1-minute param is different than 1-month param)
I believe this is caused by the volatility of the selected timeframe since different timeframe has different volatility. Param should be fine-tuned before usage.
Here is the param I'm using:
BTCUSDT BINANCE 3min: 26
BTCUSDT BINANCE 5min: 28
BTCUSDT BINANCE 1day: 15
Background of the strategy:
- The strategy starts with $10 at the start of backtesting (customizable in setting)
- The trading fee is set to 0.00% which is not common for most of the popular exchanges (customizable in setting)
- The contract size is not a fixed amount, but it uses your balance to buy it at the open price. If you are using the compound mode, your balance will be your current total balance. If you are using the non-compound mode, it will just use the $10 you start with unless you change the amount you start with. If you are using a margin higher than 1, it will calculate the corresponding contract size properly based on your margin. (Only these options are allowed, you are not able to change them without changing the code)

Kioseff Trading - AI-Optimized Supertrend
AI-Optimized Supertrend
Introducing AI-Optimized Supertrend: a streamlined solution for traders of any skill level seeking to rapidly test and optimize Supertrend. Capable of analyzing thousands of strategies, this tool cuts through the complexity to identify the most profitable, reliable, or efficient approaches.
Paired with TradingView's native backtesting capabilities, the AI-Optimized Supertrend learns from historical performance data. Set up is easy for all skill levels, and it makes fine-tuning trading alerts and Supertrend straightforward.
Features
Rapid Supertrend Strategy Testing : Quickly evaluate thousands of Supertrend strategies to find the most effective ones.
AI-Assisted Optimization : Leverage AI recommendations to fine-tune strategies for superior results.
Multi-Objective Optimization : Prioritize Supertrend based on your preference for the highest win rate, maximum profit, or efficiency.
Comprehensive Analytics : The strategy script provides an array of statistics such as profit factor, PnL, win rate, trade counts, max drawdown, and an equity curve to gauge performance accurately.
Alerts Setup : Conveniently set up alerts to be notified about critical trade signals or changes in performance metrics.
Versatile Stop Strategies : Experiment with profit targets, trailing stops, and fixed stop losses.
Binary Supertrend Exploration : Test binary Supertrend strategies.
Limit Orders : Analyze the impact of limit orders on your trading strategy.
Integration with External Indicators : Enhance strategy refinement by incorporating custom or publicly available indicators from TradingView into the optimization process.
Key Settings
The image above shows explanations for a list of key settings for the optimizer.
Set the Factor Range Limits : The AI suggests optimal upper and lower limits for the Factor range, defining the sensitivity of the Supertrend to price fluctuations. A wider range tests a greater variety, while a narrower range focuses on fine-tuning.
Adjust the ATR Range : Use the AI's recommendations to establish the upper and lower bounds for the Average True Range (ATR), which influences the Supertrend's volatility threshold.
ATR Flip : This option lets you interchange the order of ATR and Factor values to quicky test different sequences, giving you the flexibility to explore various combinations and their impact on the Supertrend indicator's performance.
Strategies Evaluated : Adjust this setting to determine how many Supertrend strategies you want to assess and compare.
Enable AI Mode : Turn this feature on to allow the AI to determine and employ the optimal Supertrend strategy with the desired performance metric, such as the highest win rate or maximum profitability.
Target Metric : Adjust this to direct the AI towards optimizing for maximum profit, top win rates, or the most efficient profits.
AI Mode Aggressiveness : Set how assertively the AI pursues the chosen performance goal, such as highest profit or win rate.
Strategy Direction : Choose to focus the AI's testing and optimization on either long or short Supertrend strategies.
Stop Loss Type : Specify the stop loss approach for optimization—fixed value, a trailing stop, or Supertrend direction changes.
Limit Order : Decide if you want to execute trades using limit orders for setting your profit targets, stop losses, or apply them to both.
Profit Target : Define your desired profit level when using either a fixed stop loss or a trailing stop.
Stop Loss : Define your desired stop loss when using either a fixed stop loss or a trailing stop.
How to: Find the best Supertrend for trading
It's important to remember that merely having the AI-Optimized Supertrend on your chart doesn't automatically provide you with the best strategy. You need to follow the AI's guidance through an iterative process to discover the optimal Supertrend settings and strategy.
Optimizing Supertrend involves adjusting two key parameters: the Factor and the Average True Range (ATR). These parameters significantly influence the Supertrend indicator's sensitivity and responsiveness to price movements.
Factor : This parameter multiplies the ATR to determine the distance of the Supertrend line from the price. Higher values will create a wider band, potentially leading to fewer trade signals, while lower values create a narrower band, which may result in more signals but also more noise.
ATR (Average True Range) : ATR measures market volatility. By using the ATR, the Supertrend adapts to changing market volatility; a higher ATR value means a more volatile market, so the Supertrend adjusts accordingly.
During the optimization process, these parameters are systematically varied to determine the combination that yields the best performance based on predefined criteria such as profitability, win rate, or risk management efficiency. The optimization aims to find the optimal Factor and ATR settings.
1.Starting Your Strategy Setup
Begin by deciding your goals for each trade: your profit target and stop loss, or if all trades exit when Supertrend changes direction. You'll also choose how to manage your stops – whether they stay put (fixed) or move with the price (trailing), and whether you want to exit trades at a specific price (limit orders). Keep the initial settings for Supertrend Factor Range and Supertrend ATR Range at their default to give the tool a broad testing field. The AI's guidance will refine these settings to pinpoint the most effective ones through a process of comprehensive testing.
Demonstration Start: We'll begin with the settings outlined in the key settings section, using Supertrend's direction change to the downside as our exit signal for all trades.
2. Continue applying the AI’s suggestions
Keep updating your optimization settings based on the AI's recommendations. Proceed with this iterative optimization until the "Best Found" message is displayed, signaling that the most effective strategy has been identified.
While following the AI's suggestions, we've been prompted with a new suggestion: increase the
number of strategies evaluated. Keep following the AI's new suggestions to evaluate more strategies. Do this until the "Best Found" message shows up.
Success! We continued to follow the AI’s suggestions until “Best Found” was indicated!
AI Mode
AI Mode incorporates Heuristic-Based Adaptive Learning to fine-tune trading strategies in a continuous manner. This feature consists of two main components:
Heuristic-Based Decision Making: The algorithm evaluates multiple Supertrend-based trading strategies using metrics such as Profit and Loss (PNL), Win Rate, and Most Efficient Profit. These metrics act as heuristics to assist the algorithm in identifying suitable strategies for trade execution.
Online Learning: The algorithm updates the performance evaluations of each strategy based on incoming market data. This enables the system to adapt to current market conditions.
Incorporating both heuristic-based decision-making and online learning, this feature aims to provide a framework for trading strategy optimization.
AI Mode Settings
AI Mode Aggressiveness:
Description: The "AI Mode Aggressiveness" setting allows you to fine-tune the AI's trading behavior. This setting ranges from “Low” to “High”, with “High” indicating a more assertive trading approach.
Functionality: This feature filters trading strategies based on a proprietary evaluation method. A higher setting narrows down the strategies that the AI will consider, leaning towards more aggressive trading. Conversely, a lower setting allows for a more conservative approach by broadening the pool of potential strategies.
Optimization
Trading system optimization is immensely advantageous when executed with prudence.
Technical-oriented, mechanical trading systems work when a valid correlation is methodical to the extent that an objective, precisely-defined ruleset can consistently exploit it. If no such correlation exists, or a technical-oriented system is erroneously designed to exploit an illusory correlation (absent predictive utility), the trading system will fail.
Evaluate results practically and test parameters rigorously after discovery. Simply mining the best-performing parameters and immediately trading them is unlikely a winning strategy. Put as much effort into testing strong-performing parameters and building an accompanying system as you would any other trading strategy. Automated optimization involves curve fitting - it's the responsibility of the trader to validate a replicable sequence or correlation and the trading system that exploits it.
Paid script
