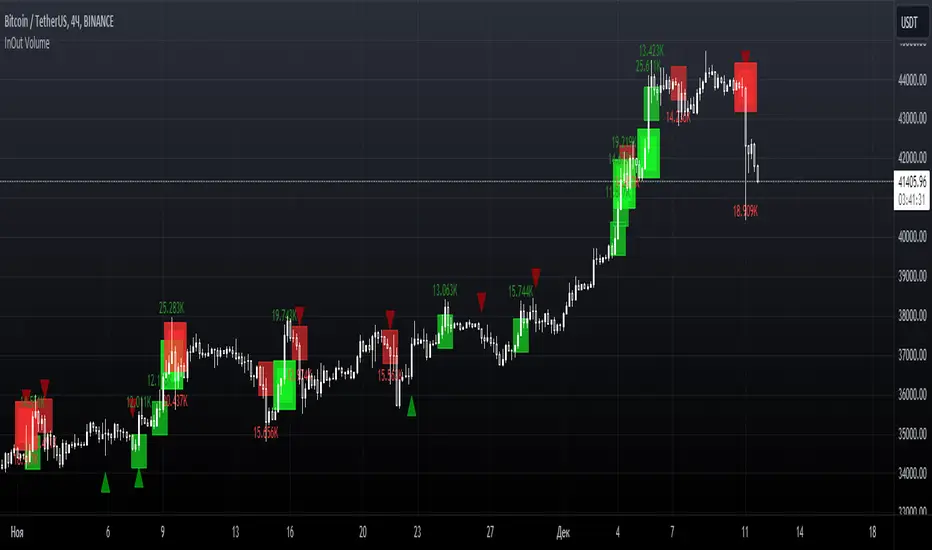
InOut VolumeInOut Volume indicator displays the places where large volume exits to buy or sell and shows signals based on the activity of major players in the market.
Large volumes indicate an increase in demand or supply of the selected asset and are an auxiliary means of analysis. Signals can be used both independently and in combination with other indicators for trading.
The visual display of large volumes and the number of signals depends on the interval applied to the chart, since the volume is concentrated directly in the candles.
-------------------------------------------------------------------------------------------------------------------
InOut Volume индикатор отображает места выхода крупного объема на покупку или продажу и показывает сигналы основанные на активности крупных игроков на рынке.
Крупные объемы указывают на увеличение спроса или предложения выбранного актива и являются вспомогательным средством анализа. Сигналы, в свою очередь, могут быть использованы как самостоятельно, так и в комбинациях с другими индикаторами для торговли, например с Pullback Levels.
Визуальное отображение крупных объемов и количества сигналов зависит от интервала, примененного на график, так как объем сосредотачивается непосредственно в свечах.
Volume Indicator
Smart RebalanceThis script is based on the portfolio rebalancing strategy. It's designed to work with cryptocurrencies, but it can work with any market.
How portfolio rebalance works?
Let's assume your initial capital is $1000, and you want to distribute it into 4 coins. This script takes the USDT as the stable coin for the initial money, so in case you want other currency, the pairs must be with that fiat as the quote.
Following our example, you would take BTC, ETH, BNB, and FTT. After selecting the coins, it's time to choose how much allocation is on each. Let's put 25% on each. This way, $250 of our capital on each coin.
After selecting the coins and their allocation, you choose the price change ratio for rebalancing. Let's use 1%. Next, you start to watch the markets. The first thing that happens, following our example, is the BTCUSDT price moving 1% up.
That amount hit the ratio of 1% for the rebalance. Hence, you sell 1% of BTC for USDT and redistribute to the other coins, buying 0.25% of each currency to rebalance the portfolio.
Next, ETHUSDT goes 1% down, time to rebalance again. This time, you need to take 0.33% of each other coin and buy ETH, so this way, it's all divided as the chosen allocation.
Why use rebalancing?
Looks easy, right? It is, but very time demanding. Demands even more if you raise the number of coins you want to distribute. Having a system to do that automatically is a must to work efficiently. Rebalancing spreads the risk among multiple currencies. This way, you earn small when it goes up, but you lose small when it goes down.
What this script helps with portfolio rebalance?
This indicator will not buy/sell for you but will help you choose the best markets for your rebalancing. Which coin will work best in that period? Do I need to have more than 8 coins? How much must be my ratio? Those questions you can answer using this indicator.
What this script has?
Start and End dates
The script will work for a certain period. All calculations will be done in that period.
Coin Ratio %
The amount of price movement of each asset that will be used to calculate the rebalancing
Initial Capital and Broker Fee
The amount of capital to be used on the rebalancing and the broker fee you want to use the strategy. The cost will be applied on every trade, buying or selling the coins.
Assets, allocations, and colors
It's possible to select from 2 to 10 assets to be used on the portfolio. Each purchase must have the allocation %. Suppose the sum of the allocations is different from 100%. In that case, a warning message will appear on the chart instead of the statistics.
Panel and tooltips
There is a panel with a summary of the results
Set allocations automatically
There is an option to make the indicator use the daily asset volume from the day before to determine the allocation percentage of each asset. This option is better if you are unsure how much allocation you want to use on each coin.
Use this indicator as a backtest for your rebalancing strategy. The selected market on the chart will not affect the calculation on this indicator, but the time frame will. The higher the time frame, the higher the coin ratio % must be.
About the code
The code is written to use arrays to store the values of each asset, making the calculations on each candle inside the time range. The for-loops are used to reduce the code length and make it easy to change the analysis of all assets. Finally, the script has some comments on the code.

Keltner Channels BandsKeltner Channel Bands
Great indicator for mean reversion strategies.
Alerts you can set:
Crossover EMA
Crossunder EMA
Crossover upper band
Crossunder upper band
Crossover lower band
Crossunder lower band
Have fun!

Volume Weighted Balance of PowerAs always, this is not financial advice and use at your own risk. Trading is risky and can cost you significant sums of money if you are not careful. Make sure you always have a proper entry and exit plan that includes defining your risk before you enter a trade.
I have modified the Balance of Power indicator that measures the difference between the open and the close and the high and low of the current bar to incorporate volume information as well. Further, I have smoothed the indicator, which is usually very choppy and difficult to read with a 21 period Least Squares Moving Average to create a Volume-Weighted Balance of Power. Since we are all aware that volume precedes price I figured this could be a neat little trend-confirmation indicator.
Uses:
1) The indicator is fairly straight forward, when it crosses below its zero line, this signals that there is more selling pressure in the current market vs. buying. Conversely, when it crosses above its zero line, this means more buyers have stepped up and are pushing prices higher.
2) It is sensitive enough to volume and price shifts that it produce divergences, which are often thought to be some of the most powerful trading signals in any market.
3) Use this tool to confirm breaks from trendlines or trading ranges to see if there is enough pressure and volume to support the move.
Enjoy and trade responsibly!

Illuminati VolumeIlluminati volume, indicatore scritto e pensato da Francesco La Via .
Questo indicatore utilizza i contratti e il prezzo per determinare le reale liquidità presente nel mercato.
Può essere usato:
Divergenze
Profile volume
Tendenze
Supporti e resistenze
Forza
L'indicatore a Time-Frame 1 minuti indica la quantità di Fiat che si sta muovendo, se è positiva sta entrando liquidità, se è negativa sta uscendo liquidità.
A time-Frame "grafico" indica la forza psicologica di ogni candela.
Il risultato dell'indicatore nel forex deve essere moltiplicato per la quantità di fiat per contratto, ad esempio EURUSD*100.000.

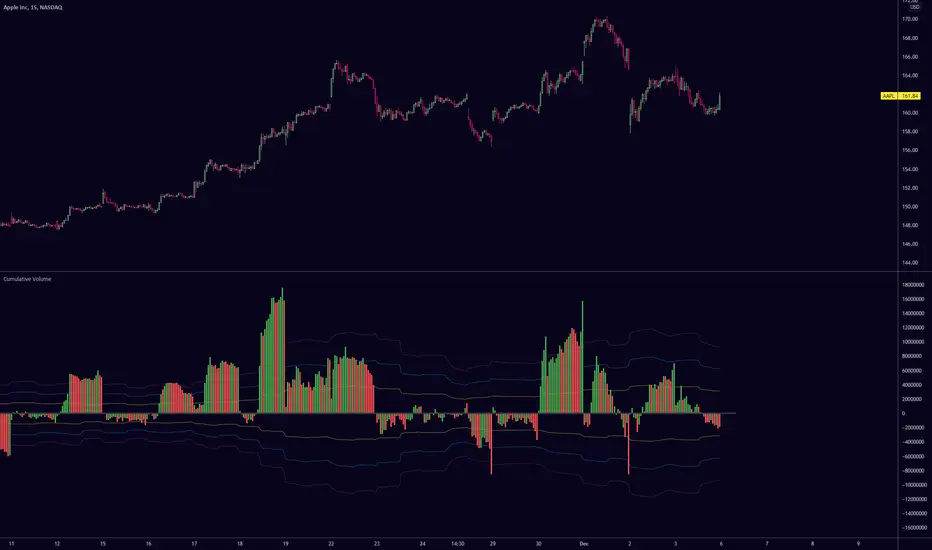
Cumulative VolumeCumulative Volume oscillator with Bollinger bands. Resets with each new day. Based on cumulative tick.
Enjoy!
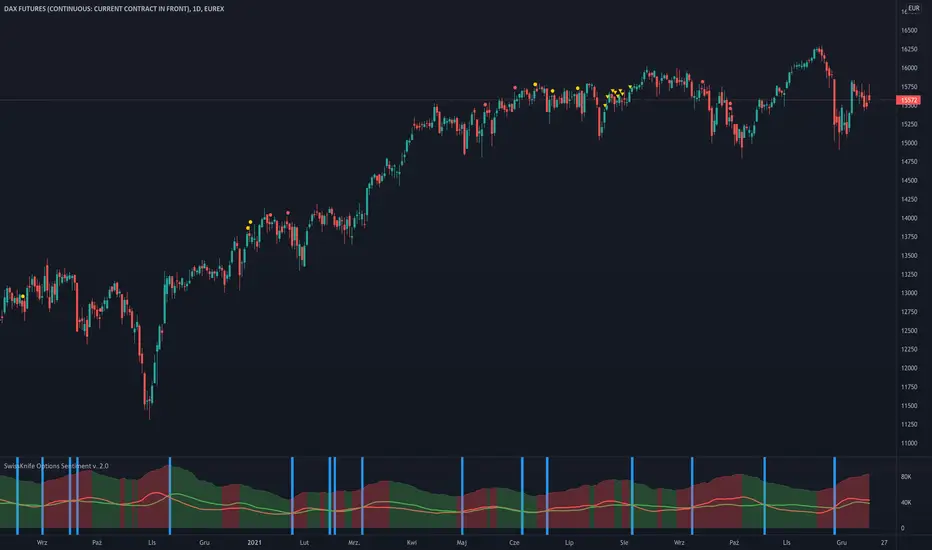
Options Flow Intraday SentimentScript useful for Intraday Trading - which based on Options data loaded in background - is showing sentiment of Investors. Very often Options are forecasting and precedes moves that will happen later on derivatives like Futures Contracts. Due to its' nature, data is useful during Regular Trading Hours sessions ( RTH ).
We take into account Options Volume flow & Put/Call Ratio from Options. Data is based from dataset on Quandl and loaded to TradingView. Therefore data is normalized as per different factors we have different scale of received data. Then I apply calculations comparing PUT and CALL Volume, giving the biggest weight ratio to those Options which have nearest Expiration Date. Another condition taken into account is Type of Option: either In the Money, Out of Money or At the money. Last but not least for Options there is calculated risk, where those orderflow entries with lowest risk are having the biggest weight in calculation while those with highest risk - are having lower ratio. Risk is calculated based on delta factor (coming out of Options standard definitions).
Background of indicator is coloured in direction of sentiment when we have alignment of sentiment factors calculated in background in one direction. Script is displaying additionally PUT Volume, CALL Volume from Options and PUT/CALL Ratio. Those are only additional information that can be useful for traders, but the whole logic is hidden under the hood (as described earlier) and is showing coloured background when sentiment is aligned. Therefore be prepared to take potentially a trade in direction of the background - but not blindly
Currently it's supporting SPX ( S&P500 ) and support for more instruments will come with next updates.
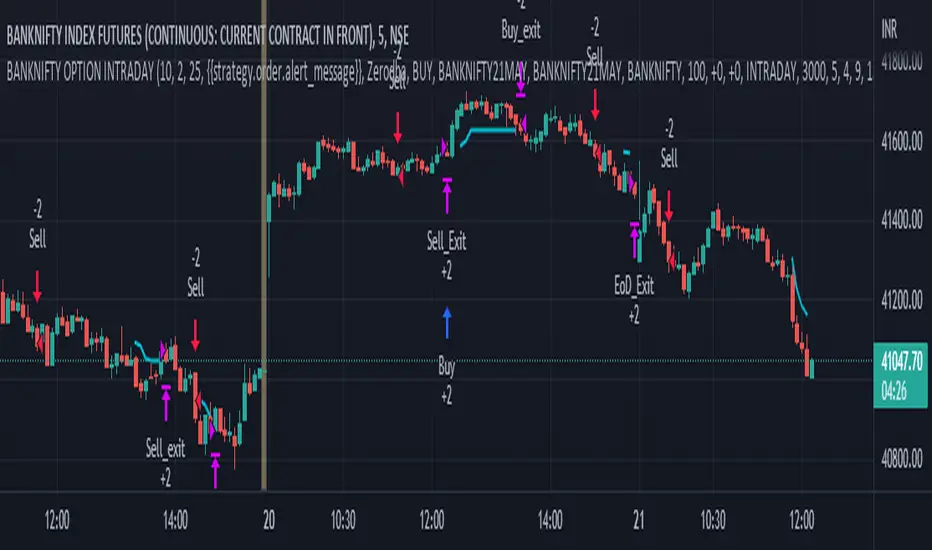
BANKNIFTY OPTION INTRADAYthis strategy used to determine and anticipate potential changes in market price and reversals. The Highs referred to in the title are created based on the number of bars that exhibit lower highs on either side of a High, whereas the Lows are created based on the number of bars that exhibit higher lows on either side Low.it also analyzing price changes and reversals, a trader has more of an ability to determine and predict price patterns and general price trends...
The backtest results are based on BANKNIFTY last year's data. It has an initial capital of 10000 and the size of the lot is 4.banknifty option weekly expiry has very low premium so we can take 4 lot in less than 30k.. The target is 50PINTS and stop-loss is 100 points. The commission paid is 20 cash per trade and the slippage is 5 ticks per trade. Some of the Indian broker's commission is only 10 cash per trade. Adjust the commission as per your broker. Trades are conducted based on the intraday time in India set from 9.20 am to 3:20 pm. All positions will get square off at 3.20 pm. All other parameters are suitable for Robo trading with Indian stock brokers.
Also added Quantity feature it automatically double the quantity on losing trade
reasons why to use strategy
1) human psychology never focus on one thing... We never follow one strategy for long time... Bcs we hve greed... If some one says indicator give u 95% than we chnge our strategy which on we r working but indicator didn't give u back testing... Our strategy gives back testing... On 5 min chart of banknifty future... Tv on premium membership give one year back testing... And on crypto it gives 2month backtesing on 5min chart
2) we hve sufficient back testing trades... On 1year back testing minimum 700 trade should be done for back testing bcs thn we know how our strategy work on all market conditions.... For crypto in 2 month back testing more thn 300 trade needed to know it's performance... Our strategy produce suffiend trades... So we know how it works on all market conditions
3) we provide banknifty strategy for intraday... So it's open trade after 9 20 and close all position on 15: 20...so it's backtesing is sure shot perfect
4) for banknifty option strategy... We have made it to book profit or loss in 5 to 15 min... So no time factor effect... So vry profitable for option buyers
5) for banknifty option we had made it fully auto it's automatically buy at auto strike price.. So no tension to select strike price
6) u can also choose weekly or monthly expirey
7) we hve provided table for monthly proprofits... So we know how it's work on every month
8) last but not least...key of 🔑Sucess in stock market and crypto is following the right path for long time... With non biased strategy with positive backtesting result... And all the best
caution: always follow risk management before using strategy
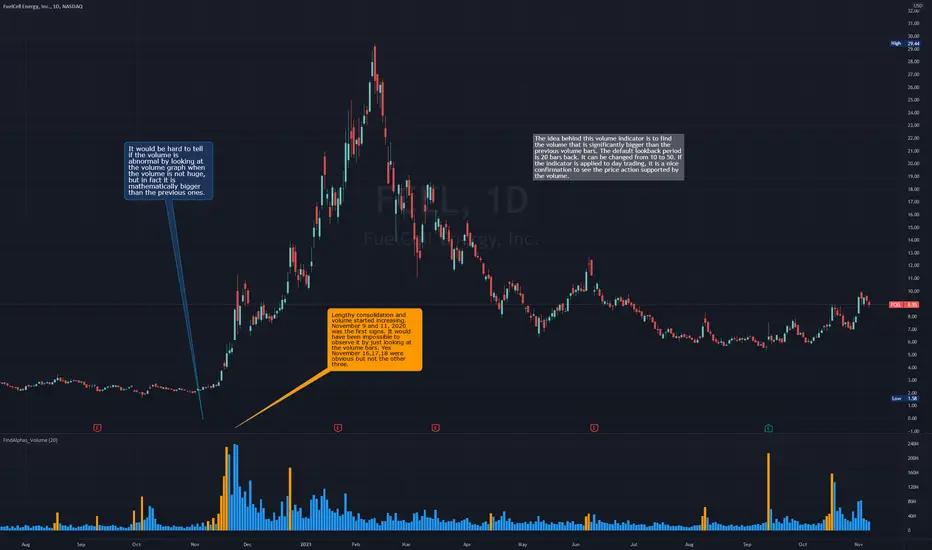
FindAlphas_Volume
Hello traders,
As you know, in trading two things are important: Price Action and Volume. When a stock is bullish and there is support with the volume, it is a good thing. Sometimes a stock will be accumulated before anyone gets to know about it. A slight increase in the volume might not get noticed, unless the volume is calculated to check for an increase. The script will calculate each volume bar in real time and will compare it to the previous bars. If there is a significant increase in the volume, it will be spotted, and the color will change to inform the trader.
There are couple of user input fields for modifications.
1- The lookback period. Default is set to 20, but could be changed from 10 to 50. This will affect how the script is going to calculate the abnormality in the volume.
2- The other one is to see the volume as a histogram or not.
3- Volume color
4- Alpha Volume color
5- Histogram color
I hope you will find it useful
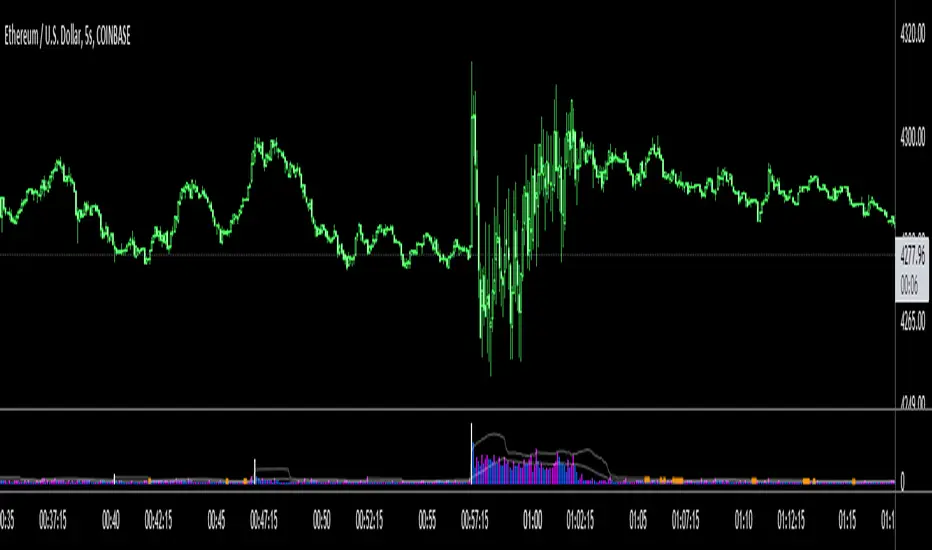
MyAggVolumeETHAggregated spot ETH volume.
Color coded by high or lower volume.
Includes indication of X periods (100) High volume and lowest volume.
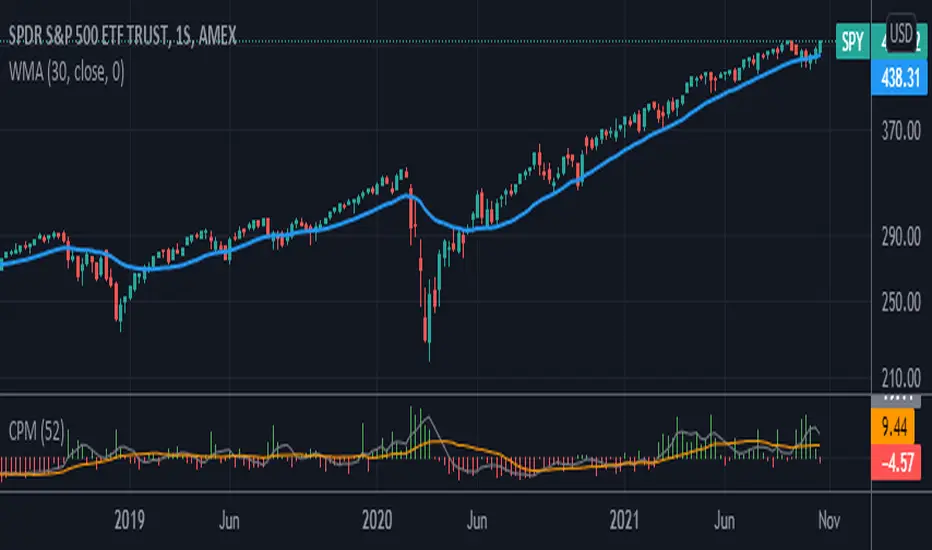
Average Proportional CapitalAverage Proportional Capital
The following indicator is based on the indicator developed by Javier Alfayate, GPM manager.
It is a climatic volume detector, which usually reflects the aggressive intervention of sharks and therefore has a decisive influence on the price.
// Spanish
Capital Proporcional Medio
El siguiente indicador esta basado en el indicador desarrollado por Javier Alfayate, gestor de GPM.
Es un detector de volumen climático, que suele reflejar la intervención agresiva de los tiburones y por tanto influye de manera decisiva en el precio.
Volume Breakout (ValueRay)Easy visuals on, if volume is way over average. Good for Mean Reverting. Higher Volume tends to higher breakout chances.
Please whisper me for for ideas how to make this better. Its a very simple script, but got some alpha. If you know how to improve, let me know and i will code it into.

CDC DivergencesA handy little indicator to help identify different kinds of convergences/divergences
The indicator compares price movements with the momentum and volume movements, Hidden divergences are left out, at least in the first version, because I wanted this indicator to be as simple as possible.
The divergences are shown with labels, user can change the momentum/volume indicator used to identify divergences in the settings.

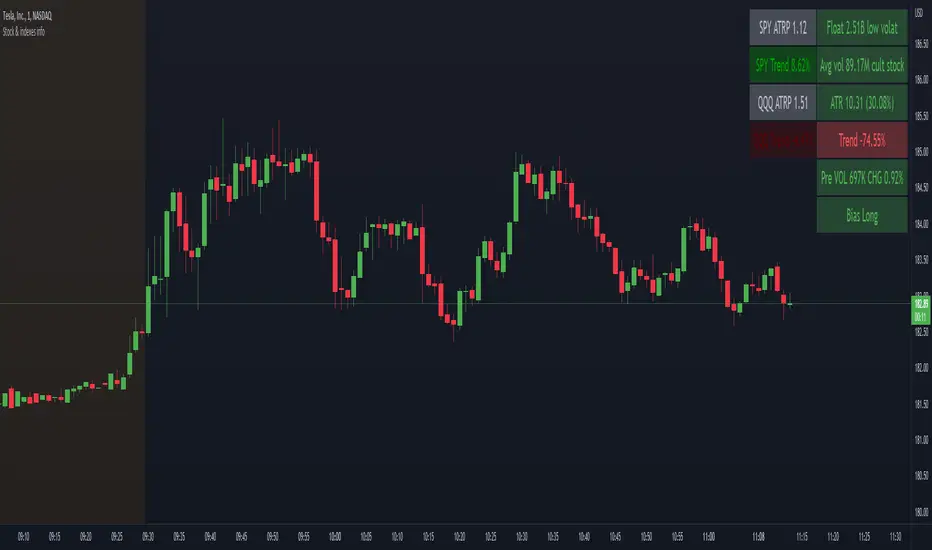
Stock float, avg volume, pre-market info and indexes atrp, trendNASDAQ:AAPL
This indicator shows the most usefull informations about the current symbol and the two common indexes (SPY and QQQ) in a table, in the upper right corner of the graph.
The informations are:
Symbol
Float
Daily average volume
Average True Range
Pre-market volume
Pre-market change %
Indexes
SPY ATRP
SPY trend (this value indicates how much the symbol is changing from the last X bars of Y minues. Higher values means a stronger trend)
QQQ ATRP
QQQ trend (same as SPY trend)
The indicator is highly customizable. Here are some of the settings:
Compact view
Text size
Every information is hidable
Most of the informations have customizable warning
Background color with thresholds
Period/lenght of the indicators
VolumeSimple and straightforward indicator. Includes - volume for Ethereum and Bitcoin to US dollar .
7 exchanges are connected:
-BINANCEUS:BTCUSD
-FTX:BTCUSD
-COINBASE:BTCUSD
-KRAKEN:XBTUSD
-GEMINI:BTCUSD
-BITFINEX:BTCUSD
-BITSTAMP:BTCUSD
Additionally, the calculation of average indicators and the amount (bull / bear separately) for a certain length is built-in.
If I missed data exchanges - write in the comments. Thank you.

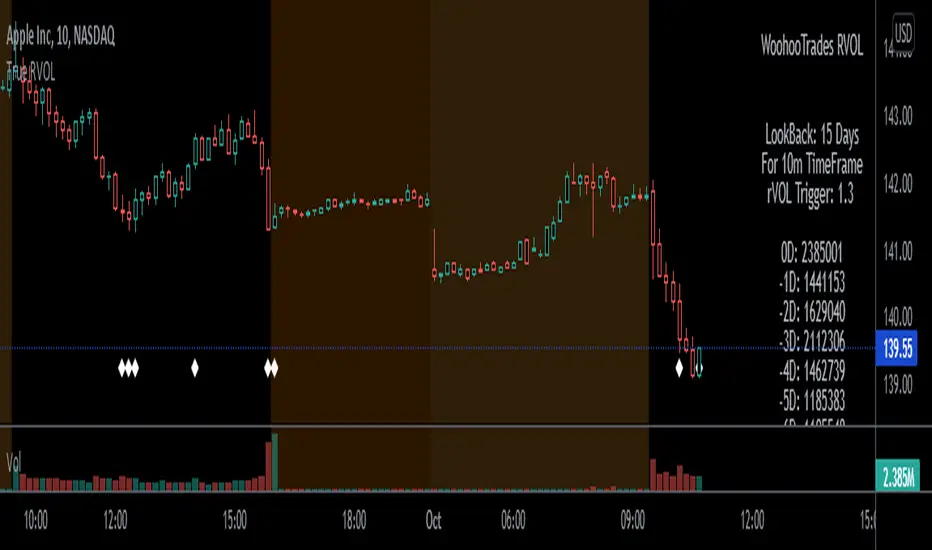
True Relative VolumeRelative Volume shows traders how "in-play" a current stonk is. Works great for day traders and scalpers!
Volume of Current TimeFrame's ratio to the average volume over X days back on the same time frame.
ie .
z = Volume at 0930-0940am over X days period divided by X
rVol = current volume divided by z
Dots at the bottom to indicate candles whose RVOL is morethan set minimum ratio.
Yes, its only 5 and 10 minutes. Might do calculations for other timeframes if this gets a good following.
Only works on US market session. 0930am to 0400pm EST.
Play Strategies :
- on break of support/resistance, if rvol supports action, ride direction of price action.
- look for in-play names, wait for price action to return to support/resistance area on low volume then
revisit if a bounce on the support/resistance line is supported by rVol again.
REMINDER!!!
This works only on 5 and 10 minutes TF. Dont forget to change your chart's timeframes.
This script will calculate erroneously if timeframe set on script and chart's current time frame are different.
Works even if extended market is enabled on your charts. It only looks at 0930 - 1600 EST bars.
Enjoy! Would love to hear your thoughts.
Relative Volume (rVol), Better Volume, Average Volume ComparisonThis is the best version of relative volume you can find a claim which is based on the logical soundness of its calculation.
I have amalgamated various volume analysis into one synergistic script. I wasn't going to opensource it. But, as one of the lucky few winners of TradingClue 2. I felt obligated to give something back to the community.
Relative volume traditionally compares current volume to prior bar volume or SMA of volume. This has drawbacks. The question of relative volume is "Volume relative to what?" In the traditional scripts you'll find it displays current volume relative to the last number of bars. But, is that the best way to compare volume. On a daily chart, possibly. On a daily chart this can work because your units of time are uniform. Each day represents a full cycle of volume. However, on an intraday chart? Not so much.
Example: If you have a lookback of 9 on an hourly chart in a 24 hour market, you are then comparing the average volume from Midnight - 9 AM to the 9 AM volume. What do you think you'll find? Well at 9:30 when NY exchanges open the volume should be consistently and predictably higher. But though rVol is high relative to the lookback period, its actually just average or maybe even below average compared to prior NY session opens. But prior NY session opens are not included in the lookback and thus ignored.
This problem is the most visibly noticed when looking at the volume on a CME futures chart or some equivalent. In a 24 hour market, such as crypto, there are website's like skew can show you the volume disparity from time of day. This led me to believe that the traditional rVol calculation was insufficient. A better way to calculate it would be to compare the 9:30 am 30m bar today to the last week's worth of 9:30 am 30m bars. Then I could know whether today's volume at 9:30 am today is high or low based on prior 9:30 am bars. This seems to be a superior method on an intraday basis and is clearly superior in markets with irregular volume
This led me to other problems, such as markets that are open for less than 24 hours and holiday hours on traditional market exchanges. How can I know that the script is accurately looking at the correct prior relevant bars. I've created and/or adapted solutions to all those problems and these calculations and code snippets thus have value that extend beyond this rVol script for other pinecoders.
The Script
This rVol script looks back at the bars of the same time period on the viewing timeframe. So, as we said, the last 9:30 bars. Averages those, then divides the: . The result is a percentage expressed as x.xxx. Thus 1.0 mean current volume is equal to average volume. Below 1.0 is below the average and above 1.0 is above the average.
This information can be viewed on its own. But there are more levels of analysis added to it.
Above the bars are signals that correlate to the "Better Volume Indicator" developed by, I believe, the folks at emini-watch and originally adapted to pinescript by LazyBear. The interpretation of these symbols are in a table on the right of the indicator.
The volume bars can also be colored. The color is defined by the relationship between the average of the rVol outputs and the current volume. The "Average rVol" so to speak. The color coding is also defined by a legend in the table on the right.
These can be researched by you to determine how to best interpret these signals. I originally got these ideas and solid details on how to use the analysis from a fellow out there, PlanTheTrade.
I hope you find some value in the code and in the information that the indicator presents. And I'd like to thank the TradingView team for producing the most innovative and user friendly charting package on the market.
(p.s. Better Volume is provides better information with a longer lookback value than the default imo)
Credit for certain code sections and ideas is due to:
LazyBear - Better Volume
Grimmolf (From GitHub) - Logic for Loop rVol
R4Rocket - The idea for my rVol 1 calculation
And I can't find the guy who had the idea for the multiples of volume to the average. Tag him if you know him
Final Note: I'd like to leave a couple of clues of my own for fellow seekers of trading infamy.
Indicators: indicators are like anemometers (The things that measure windspeed). People talk bad about them all the time because they're "lagging." Well, you can't tell what the windspeed is unless the wind is blowing. anemometers are lagging indicators of wind. But forecasters still rely on them. You would use an indicator, which I would define as a instrument of measure, to tell you the windspeed of the markets. Conversely, when people talk positively about indicators they say "This one is great and this one is terrible." This is like a farmer saying "Shovels are great, but rakes are horrible." There are certain tools that have certain functions and every good tool has a purpose for a specific job. So the next time someone shares their opinion with you about indicators. Just smile and nod, realizing one day they'll learn... hopefully before they go broke.
How to forecast: Prediction is accomplished by analyzing the behavior of instruments of measure to aggregate data (using your anemometer). The data is then assembled into a predictive model based on the measurements observed (a trading system). That predictive model is tested against reality for it's veracity (backtesting). If the model is predictive, you can optimize your decision making by creating parameter sets around the prediction that are synergistic with the implications of the prediction (risk, stop loss, target, scaling, pyramiding etc).
<3

SMART4TRADER-US STOCKSThe indicator is intended to evaluate the stock market , as it takes into account the data on the BUY and SELL of all US shares. In the indicator, you can select various methods for providing data.
Priority = (BUY - SELL) with a intraday cumulative effect.
Ratio = (BUY / SELL) with a intraday cumulative effect.
Delta = (BUY - SELL) on each candle.
Volume = (BUY + SELL) on each candle.
Cumulative = (BUY - SELL) with cumulative for all available history.
------------------------------
Индикатор предназначен для оценки фондового рынка , так как в себе учитывает данные о покупка и продажах всех акций США. В индикаторе можно выбрать различные методы предоставления данных.
PRIORITY = (BUY - SELL) с накопительным эффектом внутри дня.
RATIO= (BUY / SELL) с накопительным эффектом внутри дня.
DELTA= (BUY - SELL) на каждой свече.
VOLUME= (BUY + SELL) на каждой свече.
CUMULATIVE= (BUY - SELL) с накопительным за всю доступную историю на графике.

Baekdoo ANGNHi forks,
I'm trader Baekdoosan who trading Equity from South Korea. This Baekdoo ANGN indicator plot volume when large volume trading happened.
Assume that the large volume means higher than 1% of its marketcap amount. And adding ANGN (An-Na-Gan-Ni?, means "are you still there? in Korean")
line for upgrade version of On Balance Volume (OBV).
OBV is very good indicator but when it has long tail and short body, it can have wrong indication of buying or selling from big whales. So ANGN with large volume indicator combination would gives you better idea for the big brothers buying or selling tracker.
hope this will help your trading on equity as well as crypto. I didn't try it on futures. Best of luck all of you. Gazua~!

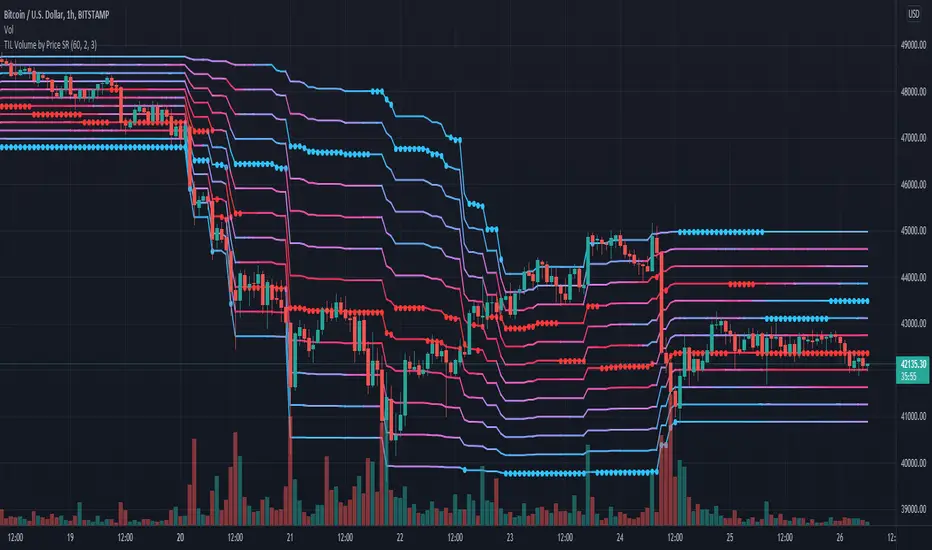
TIL Volume by Price SRTrading Indicator Lab's Volume by Price SR is a volume-based indicator for TradingView that reveals the strongest (and weakest) support and resistance levels in the chart among 12 price zones within a given period.
How It Works
The Volume by Price indicator uses a spectrum of blue to red colors to differentiate the strength of the volume within a price range for each bar. Think of it as a running volume profile with 12 price zones.
For each bar, the indicator calculates the rank of each price zone from the one that has the least number of volume to the highest within a given length of bars. Price zones that have less volume count are assigned colors that are closer to blue while price zones that have higher volume appear red. The indicator also marks the highest and lowest price levels in the rank with a red and blue dot which correspond to the same color code. The indicator repeats this in the next bar up to the last until it creates a stream of 12 lines that visually represent the gradual shift of volume strength in the price axis.
How to Use
The Volume by Price SR indicator is simple and can be used primarily to gauge support and resistance. Red lines represent price levels where there is a history of higher volume within the period, which also act as good support/resistance levels where price is more likely to be tested or bounce off.
As it can also be seen as a running volume profile indicator, the red and blue dots in each bar can be considered as high volume nodes (HVN) and low volume nodes (LVN) respectively. Though the calculation of the volume profile is continuous, the HVN and LVN dots can often appear consecutively or in a series within a single price level. The price tends to linger around or test lines that has the red dot (HVN). Meanwhile price rarely cross lines with the blue dot (LVN) or not spend as much time in these areas compared to other levels.
The height of the 12 price zones is determined by the difference between the highest high and lowest low of the period which can be useful in visualizing the chart's dynamic price range.
Inputs
- Length - sets the length of the period the indicator calculates for each bar
- Line Thickness - sets the thickness of the 12 lines all at once
- Dot Size - sets the size of the HVN and LVN dots
Intraday Volume Spikes HeatmapHello friends,
Here's something truly special for intraday traders: this script identifies and visualizes abnormal volume activity clusters throughout the trading day, giving you an instant overview of when the market gets unusually active. It's designed specifically for intraday charts with volume data available.
No setups, no guesswork — just plug it in and see where volume truly spikes.
🛠 How It Works
The indicator divides the trading session into a 60×24 grid — minutes across the horizontal axis and hours down the vertical one.
It tracks each bar's volume (or price spread, or relative change — depending on your selected metric) and highlights the frequency of abnormal activity using a smooth color heatmap.
You can analyze the full chart history or focus on a specific date range.
All the data is neatly displayed in a customizable on-chart table, allowing you to instantly spot intraday periods with heightened trading activity.
🔥 Key Features
Pine Script V6 — optimized and refactored for performance and maintainability
Detects abnormal volume activity — instantly see where volume spikes most often within the day
4 analytical modes — Volume Amount, Volume % Change, High/Low Spread, and Price % Change
Configurable analysis window — use entire chart history or a specific date range
Overlay Mode — display the heatmap directly on your chart or in a separate panel
Customizable appearance — fine-tune colors, borders, text, and layout
17 professional color palettes — including Viridis, Inferno, Magma, and Plasma
Time zone offset support — align analysis with your local time if needed
📸 Visual Examples
Viridis palette
Inferno palette
If you'd like access or have any questions, feel free to reach out to me directly via DM.
👋 Good luck and happy trading!
Paid script

Correlative volume sum CTEHello colleagues, How much importance do you give to the volume traded in the candles to support your investments? And if it is important, you analyze the volume of the candle in the assets or correlated pairs to be certain if it is a volume of only that broker or of several?
I would like to share and collaborate with a tool that can help to see the expanded volume, appending the accumulation of the volume traded from up to 3 brokers or exchanges.
I hope this tool is helpful and allows you to make your investments with greater security.
Many times we focus and analyze a single graph, discarding very relevant details present in the correlative graphs, such as the volume between them.
A good way to complement your strategy is to wait for a volume reaction in the historical volume candlestick zones.
I am happy to be part of this community and I hope that my presence in it will be of help, greetings to all.

Aggregated Volume Indicator - Across biggest exchangesThis indicator allows you to view the total volume across multiple exchanges at the same time.
Currently, the indicator is pulling volume from these exchanges
COINBASE
FTX
BINANCE
BITFINEX
KUCOIN
KRAKEN
The script will pull data from coins that are available on those exchanges and sum up the volume.
