Atareum Volume Ichimuku CandleAVIC (Atareum Volume Ichimoku Candles) is clearly an awesome indicator that is based on Ichimoku concepts by combination with volume. This is a new approach of volume candles that is combined with Ichimoku concepts and creates such a powerful tool to trace the market and assists traders to make better decisions, truly.
Concept:
Using Ichimoku leading periods and calculations on redesigning new candles in combination with volume, that makes unique reform candles on Tenkansen movement, but these new candles clearly omit noises in combination with volume, and then the new redesigned system of cloud calculations builds, new series of data for Senko Span A and Senko Span B which is so odd in first view, because they will barely ever cross each other, but they show very more informative and useful.
Parameters:
Section 1 : Candle colour setting for flourishing just as you desire !
Section 2 : Defining Periods of standard Ichimoku and source of candle data in combination with determining the smoothing type of moving averages and signal period.
Section 3 : Select using Heikin Ashi based candles alongside with redesigned cloud calculation type and three additional moving averages which can plot on each newly generated candles and standard candles on a chart with the type mode defined in the previous section.
Note: if you want to omit any or all of these moving averages, you can use 0 in period, instead of selecting "None" in the plot moving option!
Usage :
Overall:
Regardless of the additional moving averages which will lead to so many situations of market according to their types and designs, that is four different period for new redesign AVIC and three period for standard chart. You can easily select periods and type for these moving averages. Also, do not forget that signal moving averages is shown only on AVIC chart and have two different colour for upward and downward trends. Other moving averages are plot by just one single colour.
Cloud levels are so important because AVIC candles show respect to them and when they break the clouds upward or downward it's surly beginning of a trend that is may last long. Also when cloud levels flatten, it is determining a support or resistance according to up cloud or down cloud nature and as long as they will continue or repeated periodically on same level of AVIC chart, it will implement their weakness or strength.
Support and Resistance:
Any flattens of cloud up or down level means the support or resistance level due to its nature, but important thing is how long the cloud lasts flatten or how many times repeated in the same level in AVIC chart.
For plotting the support or resistance you should trace first candle of start of flattens in standard chart just like following picture.
Divergence:
All Higher high or Lower low of standard chart has its reflect in AVIC chart but there is secret in it, It is named divergence. When standard chart price candles generating lower low but the AVIC chart candles do not cross the bottom, it means we will spike high as soon as AVIC candle chart complete its divergence. You can see perfect example in following picture.
Cloud level Ends
When cloud down level become flattens and cloud up level start a bull run it means we will face a great up trend movement but as soon as cloud down level starts to move up it mean we are going to finish the bull run and maybe it goes with consolidation phase or reversal phase. This reaction is exactly happen in vice versa for bear run trend. You can see both examples in following pictures.
Note: if we face end of bull run and cloud down level make a U turn shape upside down it means we will have reversal phase even not too long but it is sharp and fast reversal. If cloud down level just turn right slightly, it means we should have consolidation phase, mostly or we can continue the last trend slightly. All these situations can happen in vice versa bear run. You can see example in following picture.
Signals:
Long but risky:
You can go long when AVIC candles are green and be in position as long as they are not change in colour.
Long and safe :
You can go long when AVIC candles cross up cloud down level and be in position as long as AVIC candles cross down cloud up level.
Long and sure:
You can go long when AVIC candles cross up cloud up level and be in position as long as AVIC candles cross down cloud down level.
Short but risky:
You can go short when AVIC candles are red and be in position as long as they are not change in colour.
Short and safe :
You can go short when AVIC candles cross down cloud up level and be in position as long as AVIC candles cross up cloud down level.
Short and sure:
You can go short when AVIC candles cross down cloud down level and be in position as long as AVIC candles cross up cloud up level.
Notice : Candles with large body are so strong but if a body candle is weak or flatten it may a signal of changing colour and direction, especially when using Heikin Ashi type.
It is the result of many years of experience in markets and there are so many details about this AVIC chart which I am in the experiment phase to publish in the future, so please help me with your ideas and do not hesitate to comment and inform me any suggestions or criticism.
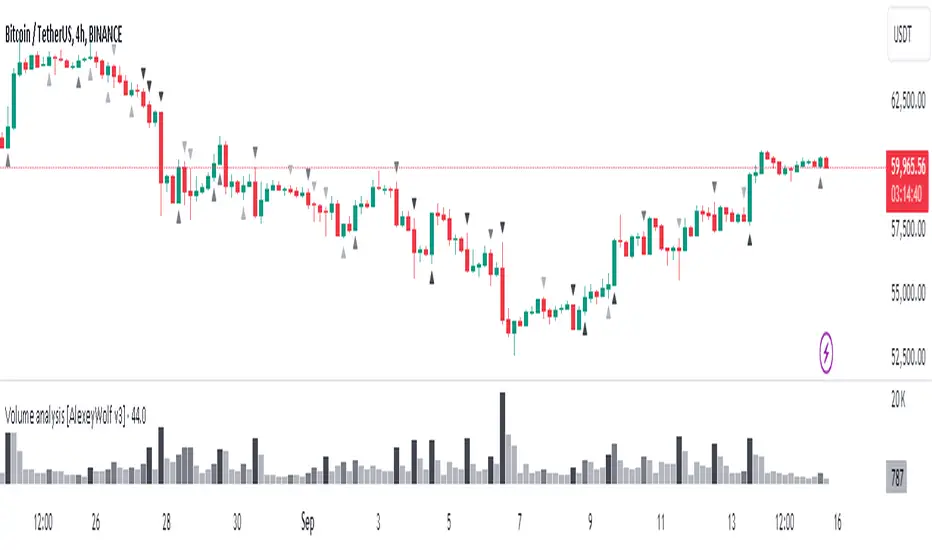
Volumeanalysis

Decoding the Volume of candlesThe indicator is designed for traders who are more interested in market structures and price action using volumes. Volume analysis can help traders build a clearer understanding of zones of buyer and seller interest, as well as liquidity gathering points (traders' stop levels).
Key Features:
The indicator visualizes on the chart the volumes selected according to the trader's chosen settings.
The indicator highlights candle volumes in selected colors, where the volume is greater individually than the volumes of the trader's chosen number of preceding candles. Or the volume that is greater than the sum of volumes of the trader's chosen number of preceding candles.
The indicator mark selected volumes on the chart based on the type of candle. The candle type (1, 2, or 3) is determined by its result (close) relative to other candles.
Volume marked for a type 3 candle draws the trader’s attention to the lack of results from the applied volume compared to the previous candle, indicating potential weakness of the candle’s owner. This is especially important in buyer or seller context areas.
Volume marked for a type 2 candle highlights the presence of results from the applied volume but only relative to the previous candle. In buyer or seller context areas, this can signal weakness of the candle’s owner.
Volume marked for a type 1 candle signals a strong result from the applied volume, indicating potential strength of the candle’s owner.
The marking of volumes can be displayed either on the main chart or on the volume chart, depending on the trader's preference. Colors and symbols for marking can be customized on the Style tab.
Volumes can be filtered on both the volume chart and the main chart according to their marking. This feature can be useful, for example, for traders who don’t work with signs of buyer or seller weakness. In such cases, they can filter out volumes only for type 1 candles.
Good luck exploring the impact of volumes on price behavior!
Volume Analysis - Heatmap and Volume ProfileHello All!
I have a new toy for you! Volume Analysis - Heatmap and Volume Profile . Honestly I started to work to develop Volume Heatmap then I decided to improve it and add more features such Volume profile, volume, difference in Buy/Sell volumes etc. I tried to put my abilities into this script and tried to use some new Pine Language™ features ( method, force_overlay, enum etc features ). I hope the usage of these new features would be an example for Pine Programmers.
Lets talk about how it works:
- It gets number of Rows/Columns from the user for each candle to create heatmap
- It calculates the number of the candles to analyze. Number of the candles may change by number of Rows/columns or if any volume / difference in volumes / volume profile is enabled
- It gets Closing/Opening price, Volume and Time info from lower time frame for each candle ( it can be up to 100K for each candle )
- After getting the data it calculates lower time frame to analyze
- Then it calculates how closing price moves, how much volume on each move and create boxes by the volume/move in each box
- The colors for each box calculated by volume info and closing price movements in the lower time frame
- It shows the boxes on Absolute places or Zero Line optionally
- it shows Volume, Cumulative volume, Difference between Buy/Sell volume for each column
- it changes empty box color by Chart background color, also you can change transparency
- At this time it creates Volume Profile with up to 25 rows
- As a new Pine Language™ feature, it can show Volume Profile in the indicator window or in Main chart, shows Value Area, Value Area High (VAH), Value Area Low (VAL), and draw it and POC (Point Of Control) in the indicator window and/or in the main chart
- Honestly the feature I like is that: For the markets that are not open 24/7, it combines the data from the lower time period without any gaps. For example, if you work for a market that is closed on Saturdays and Sundays, it ensures data integrity by omitting weekends and holidays. so for example if the data is like "ABC---DEF-X---YL-Z" then it makes this data like "ABCDEFXYLZ". In this way, there will be no data breaks in the displayed boxes, there will be no empty colons, and it will appear as if data is coming in at any time.
- Finally it shows Info Panel to give info, its background color automatically changes by the Chart background color
- Important! You should set your "Plan" accordingly, your plan is "Premium or Higher" or "Lower tier". so the script can understand the minimum time frame it can get data!!
I tried to share many screenshots below to explain it much better
How it looks?
it shows Highest Buy/Sell volumes brighter, move volume -> brighter
Volume Profile ( up to 25 row s) ( number of contained candles should be more than 1 )
Volume Profile can be shown in the main chart optionally
How the main chart looks:
Closing price shown and you can enable it, change colors & line width
Can include many candles according to Row&Column number you set
Optionally it can show cumulative volume for each candle
Closing prices from lower time frame
Shows Candle Body by changing background colors
It can shows all included candles on Zero line
You can change the colors of many things
You can set Empty box and border transparency
Table, Empty box Colors adjustment done automatically by chart background color
Sometimes we can not get data from some historical candles if time frame is high such 2days, 1 week etc, and it looks like:
It also checks if Chart time frame and Chart type is suitable
Enjoy!

Fractal Levels [BigBeluga]The Fractal Levels - BigBeluga indicator is a specialized tool that detects significant market highs and lows, ranking them by their normalized volume. This indicator is designed to help traders identify crucial price levels that are likely to influence market behavior, enabling better decision-making in trading. By gathering normalized volume around each fractal point, it creates a comprehensive view of the strength and relevance of price reversal points, which can be visualized as numbers or zones on the chart.
🔵KEY FEATURES & USAGE
● High and Low Detection with Volume Ranking:
The indicator detects market highs and lows using a user-defined length setting. For each detected fractal point (high or low), it collects normalized volume from a set number of bars before and after the fractal point (the number is based on the length input). This collection allows the indicator to produce an average of the normalized volume, which is then displayed as a number above or below the corresponding fractal arrows, visually indicating the importance of the high or low.
● Plotting Levels from Fractals:
From these high and low points, the indicator plots key levels. In settings, traders can choose between a wide or tight zone type.
If a price level coincides with multiple pivot points, the indicator highlights this as a significant zone. These zones represent areas where price tends to react, making them critical for identifying potential support and resistance levels.
● Fractal Boxes with Delta Volume Data:
Fractal boxes are shown as gray boxes, representing areas where price pivots occurred, and they also contain delta volume information. Delta volume is calculated by summing the positive and negative volumes within the length range, producing the total delta inside each fractal box. This is particularly useful for analyzing volume shifts around key levels.
● Broken Levels Highlighting:
When a plotted level is broken (price closes above or below it), the level can be removed from the chart automatically. However, in the settings, you can enable a feature to highlight broken levels as gray areas, providing insight into past price behavior. This is helpful for tracking historical support and resistance zones.
> Important note: If no volume data provided indicator wont work
🔵 CUSTOMIZATION
Fractal Length and Filter Settings:
Adjust the Length parameter to control the number of bars used to detect pivot highs and lows. A longer length will result in fewer fractals being identified, focusing on more significant price moves. The Filter option allows you to set a volume threshold, filtering out minor fractals that do not meet the minimum volume requirements.
Levels Detection (Wide or Tight):
Choose between Wide and Tight zones for fractal levels detection. A tight zone focuses on smaller price areas around pivot points, while a wide zone expands the detection range, highlighting larger zones of influence around fractals.
Delta Volume Display for Fractals:
Toggle Delta Volume Fractals to show or hide the delta volume information inside fractal boxes. When enabled, the indicator calculates and displays the total delta volume within the range of bars surrounding each fractal point.
Broken Levels Visibility:
Enable Broken Levels to highlight levels that have been crossed by price. When disabled, broken fractal levels will be removed from the chart after price crosses them.
🔵CONCLUSION
The Fractal Levels indicator provides traders with an advanced way to analyze price highs and lows by combining fractal detection with volume dynamics. By identifying key market levels through normalized volume ranking, delta volume analysis, and level plotting, this tool is invaluable for spotting potential support and resistance zones. Whether you're focusing on short-term trading or longer-term price movements, Fractal Levels offers the precision and flexibility needed to optimize your strategy.

Cumulative Net Money FlowDescription:
Dive into the financial depth of the markets with the "Cumulative Net Money Flow" indicator, designed to provide a comprehensive view of the monetary dynamics in trading. This tool is invaluable for traders and investors seeking to quantify the actual money entering or exiting the market over a specified period.
Features:
Value-Weighted Calculations: This indicator multiplies the trading volume by the price, offering a money flow perspective rather than just counting shares or contracts.
Custom Timeframe Adaptability: Adjust the timeframe to match your trading strategy, whether you are day trading, swing trading, or looking for longer-term trends.
Cumulative Insight: Tracks and accumulates net money flow to highlight overall market sentiment, making it easier to spot trends in capital movement.
Color-Coded Visualization: Displays positive money flow in green and negative money flow in red, providing clear, visual cues about market conditions.
Utility: "Cumulative Net Money Flow" is particularly effective in revealing the strength behind market movements. By understanding whether the money flow is predominantly buying or selling, traders can better align their strategies with market sentiment. This indicator is suited for various asset classes, including stocks, cryptocurrencies, and forex.

Volume Profile Heatmap [UAlgo]The "Volume Profile Heatmap " indicator is a tool designed to visualize the distribution of trading volume across different price levels over a specified period. This heatmap-style indicator helps traders identify significant price levels where a high volume of trading activity has occurred, which can be crucial for making informed trading decisions. The indicator divides the price range into multiple levels and calculates the volume of trades occurring at each level, presenting this data in a visually intuitive manner using a gradient of colors.
By analyzing the volume profile, traders can gain insights into areas of support and resistance, as well as the Point of Control (POC)—the price level with the highest traded volume. This information is valuable in assessing market sentiment, potential reversal points, and key areas of interest where price action might consolidate or react.
🔶 Key Features
Customizable Analysis Period: The indicator allows users to specify the analysis period, defining the historical range over which the volume profile is calculated.
Adjustable Number of Levels: Users can set the number of price levels to divide the price range, offering flexibility in the granularity of the volume analysis.
Color-Coded Heatmap: The indicator uses a gradient color scheme to visually represent volume intensity at each price level. Higher volume areas are shaded differently than lower volume areas, making it easy to spot significant price levels.
Opacity Control: Users can adjust the opacity of the volume boxes, enabling a clearer or more subtle visualization according to their preferences.
Point of Control (POC) Display: The indicator highlights the Point of Control, the price level with the highest traded volume, with a distinct line on the chart, allowing traders to easily identify this critical level.
🔶 Disclaimer
Use with Caution: This indicator is provided for educational and informational purposes only and should not be considered as financial advice. Users should exercise caution and perform their own analysis before making trading decisions based on the indicator's signals.
Not Financial Advice: The information provided by this indicator does not constitute financial advice, and the creator (UAlgo) shall not be held responsible for any trading losses incurred as a result of using this indicator.
Backtesting Recommended: Traders are encouraged to backtest the indicator thoroughly on historical data before using it in live trading to assess its performance and suitability for their trading strategies.
Risk Management: Trading involves inherent risks, and users should implement proper risk management strategies, including but not limited to stop-loss orders and position sizing, to mitigate potential losses.
No Guarantees: The accuracy and reliability of the indicator's signals cannot be guaranteed, as they are based on historical price data and past performance may not be indicative of future results.

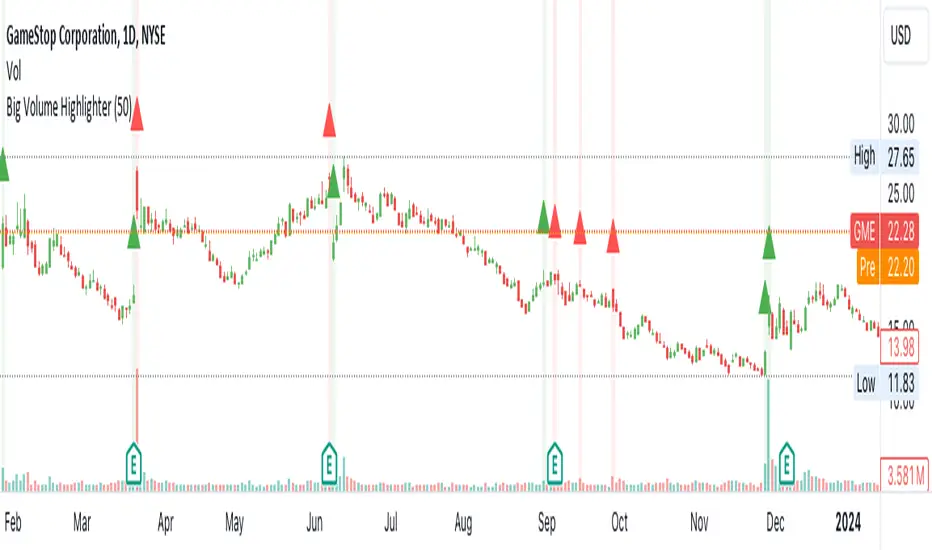
Big Volumes HighlighterBig Volumes Highlighter
Overview:
The "Big Volume Highlighter" is a powerful tool designed to help traders quickly identify candles with the highest trading volume over a specified period. This indicator not only highlights the most significant volume candles but also color-codes them based on the candle's direction—green for bullish (close > open) and red for bearish (close < open). Whether you're analyzing volume spikes or looking for key moments in price action, this indicator provides clear visual cues to enhance your trading decisions.
Features:
Customizable Lookback Period: Define the number of candles to consider when determining the highest volume.
Automatic Color Coding: Candles with the highest volume are highlighted in green if bullish and red if bearish.
Visual Clarity: The indicator marks the significant volume candles with a triangle above the bar and changes the background color to match, making it easy to spot important volume events at a glance.
Use Cases:
Volume Spike Detection:
Quickly identify when a large volume enters the market, which may indicate significant buying or selling pressure.
Trend Confirmation: Use volume spikes to confirm trends or potential reversals by observing the direction of the high-volume candles.
Market Sentiment Analysis: Understand market sentiment by analyzing the direction of the candles with the biggest volumes.
How to Use:
Add the "Big Volume Highlighter" to your chart.
Adjust the lookback period to suit your analysis.
Observe the highlighted candles for insights into market dynamics.
This script is ideal for traders who want to incorporate volume analysis into their technical strategy, providing a simple yet effective way to monitor significant volume changes in the market.
Thrax - QuickStrike 5-Mins Scalping** Indicator Description **
1. Price Change Threshold (%) – The minimum price change required for a candle to be recognized as significant. Candles exceeding this threshold are considered potential candidates for zone creation. Default value for 5 min is 0.5%. As you move on higher timeframe the threshold should increase
2. Percentage Change for Zones (%) – The amount of price movement needed to form a dynamic support or resistance zone. Tweak this to control how sensitive the indicator is to price fluctuations. 5 min default value is 1%. For 15 min suggested is 2-3%.
3. Break Threshold for Zones (%) – Defines how much price must break above or below a zone for it to be removed from the chart/mitigated. Keeps the chart clean by removing invalidated zones. Default value is 0.1% in 5 min, for 15 min it is 0.5%.
4. Buy Zone Retracement Level (%) – The percentage retracement level for defining the inner buy zone within a broader bullish zone. Ideal for timing precision entries. Ideal value is 75%
5. Sell Zone Retracement Level (%) – The percentage retracement level used to determine the inner sell zone within a larger bearish zone. Helps in identifying potential reversal areas or exits. Ideal value is 25%
By tailoring these inputs, traders can fully customize the indicator to suit their scalping strategies, enhancing their ability to navigate fast-moving markets with confidence.
---------------------------------------------------------------------------
There are two primary approaches for scalping using this indicator:
1. Candle-Based Scalping:
a. Bullish Signal: When you observe a bullish candle highlighted in blue (by default), you can consider entering a long position at the close of this candle. It’s advisable to wait for the candle to close before taking action. For a more aggressive scalp, you might take profits based on your scalp target after a few subsequent candles. If the price remains stagnant or moves unfavorably in the next few candles, you can exit with a small loss. Alternatively, if you have a higher risk tolerance, you may hold the position even if the price initially declines within a set percentage.
b. Bearish Signal: For a bearish candle highlighted in yellow, you can enter a short trade at the close of the candle. Similar to the bullish setup, you have the option to exit after a few candles if the price doesn’t move as expected or hold the position with a higher risk tolerance if the price goes up initially.
2. Zone-Based Scalping:
Entering Zones: Monitor the price as it enters a defined support or resistance zone. If you are open to higher risk, you can enter a trade immediately upon the price entering the zone. For a more cautious approach with a smaller stop loss, wait for the price to reach a retracement level within the zone before initiating your trade. This approach allows for a more precise entry but may result in missing out on trades if the price reverses before hitting the retracement level. Conversely, entering at the zone’s boundary offers the potential for early trade capture but comes with a higher stop loss risk.
Adjust these strategies based on your risk tolerance and trading preferences to optimize your scalping opportunities.

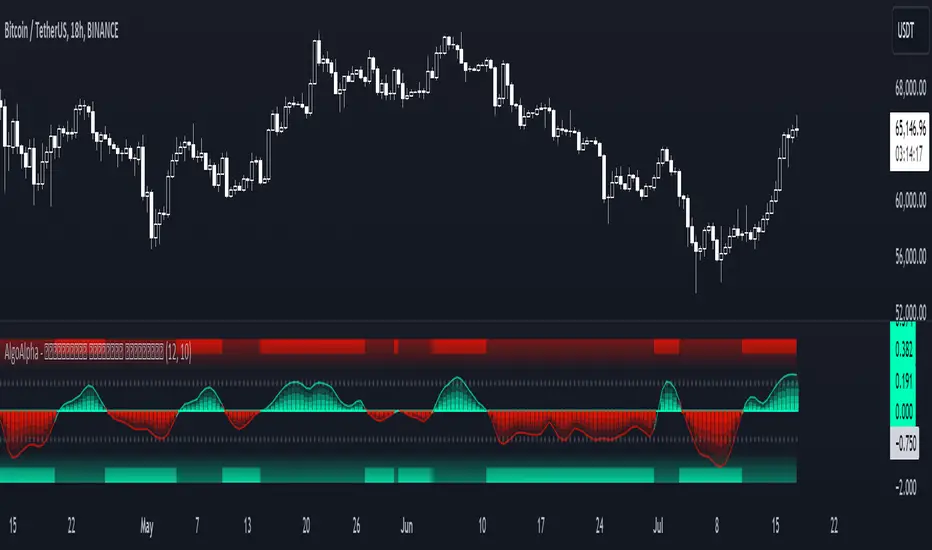
Market Flow with Convergence🟪 Overview
The "Market Flow with Convergence" indicator leverages advanced volume metrics to accurately measure the underlying market pressure by analyzing the cumulative buying and selling volumes with the TICK index. This unique combination helps identify potential market reversals and trends, providing a comprehensive view of market flow. The indicator is particularly useful for those looking to capture convergence and divergence signals, crucial for making informed trading decisions.
🟪 Features
Volume-Based Convergence: Calculates the buying and selling pressures based on volume data, to produce color coded convergence. Visually represents areas where buying or selling pressures align.
Divergence Detection: Identifies and visually represents areas where buying and selling pressures diverge from each other, which can indicate key market turning points.
TICK Index: Incorporates data from the TICK index, normalizing and smoothing the cumulative data to highlight potential market reversals and trends.
Cumulative Flow Crossovers: Identifies and visually represents areas where buying and selling pressures crossover and become the dominant market flow.
Customizable Visualization: Uses conditional coloring and shapes to provide a clear, easy-to-interpret visual representation of the market state, making it easier to spot critical signals at a glance.
🟪 How it Works
Leveraging a combination of volume analysis and market breadth data, particularly the TICK index, to assess the underlying market pressure. By normalizing key market metrics, the indicator provides a clear view of buying and selling activity over time. The flow is standard across all charts, but convergence will change based on the charts ticker.
The indicator tracks and aggregates movements in the TICK index, allowing for an assessment of the market's cumulative momentum. This cumulative measure, combined with volume-based analysis, helps traders identify potential shifts in market trends, whether they be continuations or reversals.
The visual output of the indicator is designed to be intuitive and actionable. Key market conditions are highlighted through color-coded histograms and plot shapes, making it easy to interpret the data and apply it in real-time trading scenarios.
Understanding the Convergence Color Codes
Gray: represent periods of the markets lack of convergence, where neither buyers nor sellers have a decisive advantage. These conditions may indicate market indecision or a potential reversal point. The gray bars can also suggest a period of consolidation before a significant move.
Green: this indicates that buying pressure is greater than selling pressure, suggesting a bullish market condition. This is typically seen when the market may be trending upwards or when buyers are gaining control.
Red: signifies that selling pressure exceeds buying pressure, indicating a bearish market condition. This can be a signal that the market is trending downwards or that sellers are dominating the market.
Understanding Flow Crossovers
Green Dots: correspond to crossovers where the buying pressure (from the TICK) crosses above the selling pressure. This crossover often signals a potential upward move or a bullish market opportunity.
Red Dots: indicate a crossover where the selling pressure (from the TICK) crosses above the buying pressure. This crossover typically suggests a potential downward move or a bearish market signal.
🟪 Usage Examples
If the selling flow is consistently over buying and convergence is red, it indicates a strong and sustained bearish trend. This points to a potential downward move, with sellers predominantly in control.
When the buying flow is consistently over selling and convergence is green, it indicates a strong and sustained bullish trend. This can lead to a potential upward move, with buyers predominantly in control.
No convergence can mean it's time to be cautious. This could be a sign of market indecision, and it's often wise to wait for confirmation. This can lead to sideways market conditions or inverse of the current dominant flow.
🟪 Settings
This indicator does not require any user inputs as it automatically calculates the necessary data based on the ticker's price and volume information. It’s ready to use immediately upon application to any chart.
🟪 Limitations
This indicator is only works during the New York session of trading. It's flow values will not function outside of that trading session.
🟪 Conclusion
We believe in providing user-friendly tools to help speed up traders technical analysis and implement easy trading strategies. The "Market Flow with Convergence" offers a unique way to gauge prevailing market conditions, with simple visual cues for identifying trends.
🟪 Risk Disclaimer
All content, tools, scripts & education provided, are for informational & educational purposes only. Trading is risk and most lose their money, past performance does not guarantee future results.

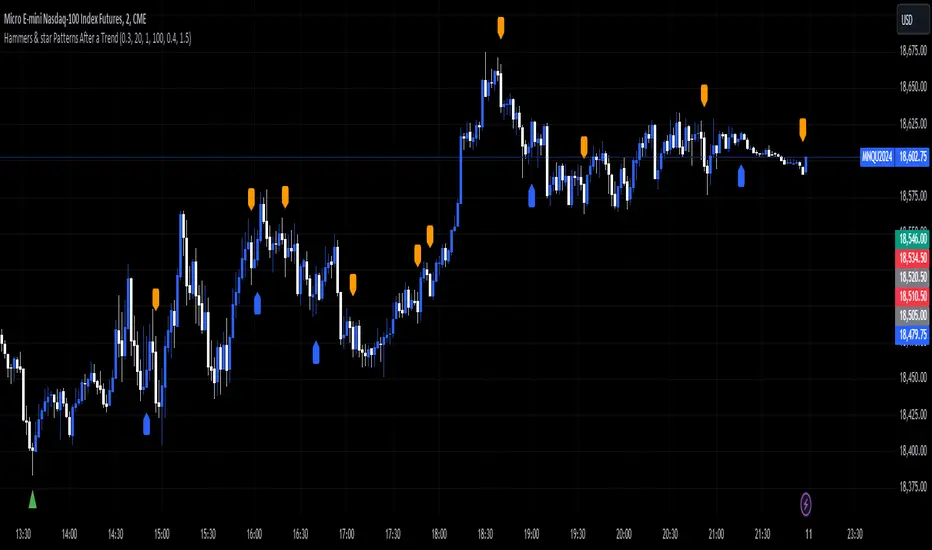
Hammers & star Patterns After a Trend
1. **Candlestick Patterns Detection:**
- **Hammers** and **Inverted Hammers** are specific candlestick patterns that can indicate potential reversals in the market.
- **Hammer**: A candle with a small body and a long lower wick, showing a possible reversal after a downtrend.
- **Inverted Hammer**: A candle with a small body and a long upper wick, indicating a possible reversal after an uptrend.
2. **Volume Consideration:**
- The script checks if these patterns occur with **high trading volume**. If the volume is significantly higher than the average volume over a certain period, the pattern is highlighted.
3. **Trend Detection:**
- The script looks for a significant trend before the pattern appears:
- **Downtrend**: A significant downward movement in price is required before a Hammer is considered.
- **Uptrend**: A significant upward movement is required before an Inverted Hammer is considered.
4. **Additional Patterns:**
- **Morning Star** and **Evening Star** patterns are also detected:
- **Morning Star**: A three-candle pattern where the first candle is a large bearish candle, followed by a small-bodied candle, and then a large bullish candle, indicating a potential reversal from downtrend to uptrend.
- **Evening Star**: The opposite pattern, signaling a potential reversal from uptrend to downtrend.
5. **Visual Indicators:**
- The script **plots arrows** and **labels** on the chart to show where these patterns occur:
- **Hammers** and **Inverted Hammers** are marked with triangle arrows.
- **Morning Stars** and **Evening Stars** are marked with labels.
In summary, this script helps traders identify key candlestick patterns that may signal potential reversals in price trends, with special emphasis on patterns that occur with high volume and after significant price movements.
VWAP Bands [TradingFinder] 26 Brokers Data (Forex + Crypto)🔵 Introduction
Indicators are tools that help analysts predict the price trend of a stock through mathematical calculations on price or trading volume. It is evident that trading volume significantly impacts the price trend of a stock symbol.
The Volume-Weighted Average Price (VWAP) indicator combines the influence of trading volume and price, providing technical analysts with a practical tool.
This technical indicator determines the volume-weighted average price of a symbol over a specified time period. Consequently, this indicator can be used to identify trends and entry or exit points.
🟣 Calculating the VWAP Indicator
Adding the VWAP indicator to a chart will automatically perform all calculations for you. However, if you wish to understand how this indicator is calculated, the following explains the steps involved.
Consider a 5-minute chart. In the first candle of this chart (which represents price information in the first 5 minutes), sum the high, low, and close prices, and divide by 3. Multiply the resulting number by the volume for the period and call it a variable (e.g., X).
Then, divide the resulting output by the total volume for that period to calculate your VWAP. To maintain the VWAP sequence throughout the trading day, it is necessary to add the X values obtained from each period to the previous period and divide by the total volume up to that time. It is worth noting that the calculation method is the same for intervals shorter than a day.
The mathematical formula for this VWAP indicator : VWAP = ∑ (Pi×Vi) / ∑ Vi
🔵 How to Use
Traders might consider the VWAP indicator as a tool for predicting trends. For example, they might buy a stock when the price is above the VWAP level and sell it when the price is below the VWAP.
In other words, when the price is above the VWAP, the price is rising, and when it is below the VWAP, the price is falling. Major traders and investment funds also use the VWAP ratio to help enter or exit stocks with the least possible market impact.
It is important to note that one should not rely solely on the VWAP indicator when analyzing symbols. This is because if prices rise quickly, the VWAP indicator may not adequately describe the conditions. This indicator is generally used for daily or shorter time frames because using longer intervals can distort the average.
Since this indicator uses past data in its calculations, it can be considered a lagging indicator. As a result, the more data there is, the greater the delay.
🟣 Difference Between VWAP and Simple Moving Average
On a chart, the VWAP and the simple moving average may look similar, but these two indicators have different calculations. The VWAP calculates the total price considering volume, while the simple moving average does not consider volume.
In simpler terms, the VWAP indicator measures each day's price change relative to the trading volume that occurred that day. In contrast, the simple moving average implicitly assumes that all trading days have the same volume.
🟣 Reasons Why Traders Like the VWAP Indicator
The VWAP Considers Volume: Since VWAP takes volume into account, it can be more reliable than a simple arithmetic average of prices. Theoretically, one person can buy 200,000 shares of a symbol in one transaction at a single price.
However, during the same time frame, 100 other people might place 200 different orders at various prices that do not total 100,000 shares. In this case, if you only consider the average price, you might be mistaken because trading volume is ignored.
The Indicator Can Help Day Traders: While reviewing your trades, you might notice that the shares you bought at market price are trading below the VWAP indicator.
In this case, there's no need to worry because with the help of VWAP, you always get a price below the average. By knowing the volume-weighted average price of a stock, you can easily make an informed decision about paying more or less than other traders for the stock.
VWAP Can Signal Market Trend Changes: Buying low and selling high can be an excellent strategy for individuals. However, you are looking to buy when prices start to rise and sell your shares when prices start to fall.
Since the VWAP indicator simulates a balanced price in the market, when the price crosses above the VWAP line, one can assume that traders are willing to pay more to acquire shares, and as a result, the market will grow. Conversely, when the price crosses below the line, this can be considered a sign of a downward movement.
🔵 Setting
Period : Indicator calculation time frame.
Source : The Price used for calculations.
Market Ultra Data : If you turn on this feature, 26 large brokers will be included in the calculation of the trading volume.
The advantage of this capability is to have more reliable volume data. You should be careful to specify the market you are in, FOREX brokers and Crypto brokers are different.
Multiplier : Coefficient of band lines.

Volume Spread Analysis [AlgoAlpha]Unleash the power of Volume Spread Analysis (VSA) with our state-of-the-art indicator designed to detect market divergences and convergences, helping you make informed trading decisions. 📈
Key Features:
Detects bullish and bearish divergences based on volume and price movements. 📊🔍
Identifies bullish and bearish convergences, signaling potential trend continuations or reversals. 🔄📉
Customizable parameters for period length, volume SMA period, and outlier reduction factor. ⚙️🔧
Visual highlights for detected effects, with color-coded boxes and labels. 🟩🟥
Provides alerts for divergences and convergences, keeping you updated on market conditions. 🔔📬
📚 Introduction to Volume Spread Analysis (VSA) :
Volume Spread Analysis is a method used to interpret the relationship between volume and price to identify the intentions of market participants. By analyzing the spread (range) of a price bar and its corresponding volume, VSA helps traders discern market strength and potential reversals.
In VSA, harmony occurs when price and volume move in sync, such as when increasing prices(aka "Effect" in the script) are accompanied by increasing volume. This indicates a strong and healthy trend. Conversely, divergence happens when price and volume move in opposite directions. For example, if prices are rising lesser but volume is still high, it may signal a weakening trend and a potential reversal. Identifying these patterns helps traders understand market dynamics and make more informed trading decisions.
🛠 Quick Guide to Using the Volume Spread Analysis Indicator
⭐ Add the Indicator: Add the indicator to favorites by pressing the star icon. Customize settings such as period length, volume SMA period, and outlier reduction factor to fit your trading style.
📊 Market Analysis: Watch for color-coded boxes indicating effects and labels showing effort values. Look for divergences and convergences to identify potential trading opportunities. A higher work done suggests that the markets are needing to work harder to move the price and users can use that information as displayed below each trend impulse box to analyze the likely hood of trend continuation/reversals.
🔔 Alerts: Enable alerts for divergences and convergences to stay informed of critical market conditions without constant chart monitoring.
🔍 How It Works:
Our indicator meticulously analyzes volume and price data to detect significant market movements. It identifies periods where volume is above or below a moving average, marks these points, and tracks the price effect over a user-defined range. By calculating the effort (volume) and effect (price movement), it distinguishes between divergences and convergences based on predefined conditions. Bullish and bearish conditions are visually represented with color-coded boxes and labels, making it easy to spot trading opportunities. Alerts can be set to notify you of critical market conditions, ensuring you never miss a potential trade setup.
Happy trading! 📈🚀

Volumetric Volatility Blocks [UAlgo]The Volumetric Volatility Blocks indicator is designed to identify significant volatility blocks based on price and volume data. It utilizes a combination of the Average True Range (ATR) and Simple Moving Average (SMA) to determine the volatility level and identify periods of heightened market activity. The indicator highlights these volatility blocks, providing traders with visual cues for potential trading opportunities. It differentiates between bullish and bearish volatility by analyzing price movement and volume, offering a nuanced view of market sentiment. This tool is particularly useful for traders looking to capitalize on periods of high volatility and momentum shifts.
🔶 Key Features
Volatility Measurement Length: Controls the period used to calculate the ATR.
Smooth Length of Volatility: Defines the period for the SMA used to smooth the ATR.
Multiplier of SMA: Sets the minimum threshold for the ATR to be considered a "high volatility" block.
Show Last X Volatility Blocks: Determines how many of the most recent volatility blocks are displayed on the chart.
Mitigation Method: Choose between "Close" or "Wick" price to filter volatility blocks based on price action. This helps avoid highlighting blocks broken by the chosen price level.
Volume Info: Displaying the volume associated with each block.
Up/Down Block Color: Sets the color for bullish and bearish volatility blocks.
🔶 Usage
The Volumetric Volatility Blocks indicator visually represents periods of high volatility with blocks on the chart. Green blocks indicate bullish volatility, while red blocks indicate bearish volatility.
Bullish Volatility Blocks: When the ATR surpasses the smoothed ATR multiplied by the set multiplier, and the price closes higher than it opened, a bullish block is formed. These blocks are generally used to identify potential buying opportunities as they indicate upward momentum.
Bearish Volatility Blocks: Conversely, bearish blocks form under the same conditions, but when the price closes lower than it opened. These blocks can signal potential selling opportunities as they highlight downward momentum.
Volume Information: Each block can display volume data, providing insight into the strength of the market movement. The percentage shown on the block indicates the relative volume contribution of that block, helping traders assess the significance of the volatility.
The volume percentages in the Volumetric Volatility Blocks indicator are calculated based on the total volume of the most recent volatility blocks. For each of the most recent volatility blocks, the percentage of the total volume is calculated by dividing the block's volume by the total volume:
🔶 Disclaimer
Use with Caution: This indicator is provided for educational and informational purposes only and should not be considered as financial advice. Users should exercise caution and perform their own analysis before making trading decisions based on the indicator's signals.
Not Financial Advice: The information provided by this indicator does not constitute financial advice, and the creator (UAlgo) shall not be held responsible for any trading losses incurred as a result of using this indicator.
Backtesting Recommended: Traders are encouraged to backtest the indicator thoroughly on historical data before using it in live trading to assess its performance and suitability for their trading strategies.
Risk Management: Trading involves inherent risks, and users should implement proper risk management strategies, including but not limited to stop-loss orders and position sizing, to mitigate potential losses.
No Guarantees: The accuracy and reliability of the indicator's signals cannot be guaranteed, as they are based on historical price data and past performance may not be indicative of future results.

Volume Insignts AnalyzerDescription:
The Volume Insight Analyzer is an advanced Pine Script designed for traders who want a comprehensive view of volume dynamics on their charts. This script combines multiple volume-based indicators to help identify key trading opportunities, including significant volume days, volume dry-ups, and pocket pivots.
Key Features:
VDU (Volume Dry-Up) Detection: Automatically identifies and marks days when the volume is significantly below its moving average, helping to spot potential breakout or breakdown points. Customizable volume thresholds allow for tailored analysis based on your trading strategy. The Volume Dry-Up label appears when the volume is substantially below its average level and the price is near a key moving average. This condition indicates a period of equilibrium between supply and demand, suggesting a potential low-risk entry point for traders.
Pocket Pivot Analysis using 5 and 10 Length Pocket Pivots: Highlights days with exceptionally high volume compared to recent history, indicating potential pocket pivots. Visual markers on the chart and volume bars color-coded for 5 and 10-day lengths. Pocket pivot points are identified when the volume on a given day exceeds the maximum volume observed over the past several days. Specifically, a 5-day pocket pivot point is marked when today's volume surpasses the highest selling volume of the last 5 days. A cluster of 5-day pocket pivot points within a base is a strong indicator of stock strength. Similarly, a 10-day pocket pivot point following a Volume Dry-Up (VDU) suggests a potential entry opportunity. Moreover, a pre-existing cluster of 5-day pocket pivot points before a 10-day pocket pivot point provides greater conviction in the trade.
Volume Moving Averages: Set different lengths for primary and secondary moving averages to track volume trends over daily, weekly, and monthly timeframes. Options to display moving average lines on the volume chart.
Volume Visualization:
a. Major and Minor Volume Bars: Option to display bars that are either above or below average volume levels. Adjustable settings to show or hide these bars based on user preference.
b. Volume Bar Coloring: Volume bars are color-coded based on significant volume thresholds, including green for bullish signals, red for bearish signals, and orange for volume dry-ups.
Volume Metrics Table: A customizable table that displays real-time volume metrics including Relative Volume (RVOL), Turnover, and the number of high volume days. The table can be oriented horizontally or vertically and styled according to your theme preferences.
Visual Indicators:
a) Volume Dry-Up (VDU) Labels: Clearly marked VDU events with textual annotations on the chart.
b) Bullish and Bearish Arrows: Arrows indicating potential bullish or bearish closes based on volume analysis, enhancing decision-making.
Customization Options:
a) Dark and Light Theme Support: Toggle between dark and light themes to match your chart settings.
b) Adjustable Parameters: Easily configure input settings such as volume thresholds, MA lengths, and table display options to fit your trading style.
How to Use:
Set Parameters: Adjust the script settings such as volume thresholds, moving average lengths, and display preferences according to your analysis needs.
Analyze Volume Patterns: Use the indicators and visual markers provided by the script to identify significant volume patterns and potential trading signals.
Monitor Metrics: Refer to the volume metrics table for a quick overview of key volume-related statistics and trends.
Make Informed Decisions: Utilize the visual cues and volume data provided by the script to enhance your trading strategy and make more informed decisions.
Disclaimer:
This script is for informational purposes only and should not be considered as trading advice. Use it in conjunction with other analysis tools and consult with a financial advisor if needed. Trading involves risk, and past performance does not guarantee future results.

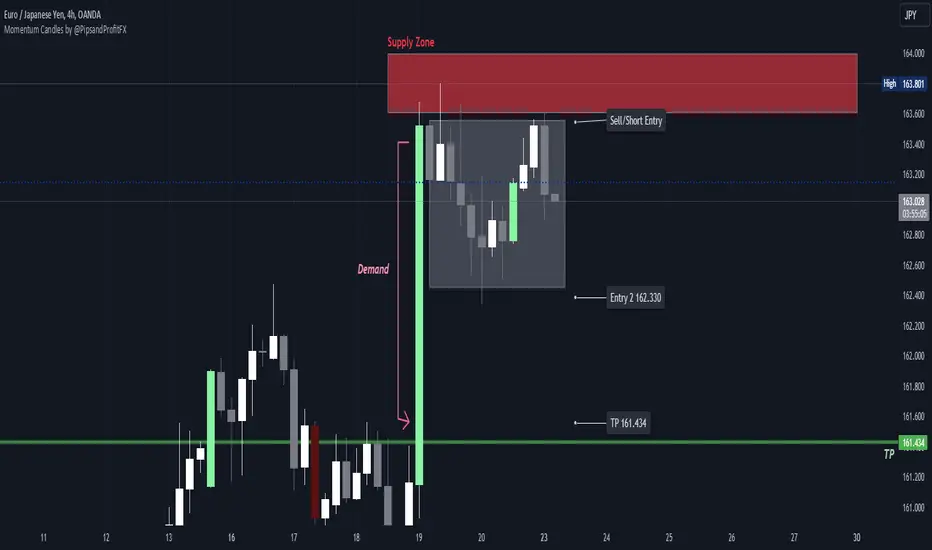
Momentum Candles by @PipsandProfitFXThe High Momentum Candles indicator highlights price bars with exceptional price movement and strong volume. It identifies candles with significantly long bodies relative to their shadows, indicating rapid price changes. Additionally, the indicator filters for candles with above-average volume to confirm the strength of the price movement.
Dark red: bearish momentum
Orange: bullish momentum
(You can easily change the momentum candles to whatever color you want in the indicator settings.)
By visually emphasizing these high momentum candles, traders can potentially identify potential trend reversals or continuations, as well as potential entry and exit points.
Key Features:
Identifies candles with large bodies relative to their shadows
Filters candles based on volume to confirm strength
Highlights high momentum candles with a distinct color
Let me know if you'd like to see any updates on this indicator.
Note: This indicator is a visual tool and should be used in conjunction with other technical analysis techniques for making informed trading decisions.
Efficiency Weighted OrderFlow [AlgoAlpha]Introducing the Efficiency Weighted Orderflow Indicator by AlgoAlpha! 📈✨
Elevate your trading game with our cutting-edge Efficiency Weighted Orderflow Indicator, designed to provide clear insights into market trends and potential reversals. This tool is perfect for traders seeking to understand the underlying market dynamics through efficiency-weighted volume calculations.
🌟 Key Features 🌟
✨ Smooth OrderFlow Calculation : Option to smooth order flow data for more consistent signals.
🔧 Customizable Parameters : Adjust the Order Flow Period and HMA Smoothing Length to fit your trading strategy.
🔍 Visual Clarity : Easily distinguish between bullish and bearish trends with customizable colors.
📊 Standard Deviation Normalization : Keeps order flow values normalized for better comparison across different market conditions.
🔔 Trend Reversal Alerts : Stay ahead with built-in alert conditions for significant order flow changes.
🚀 Quick Guide to Using the Efficiency Weighted Orderflow Indicator
🛠 Add the Indicator: Search for "Efficiency Weighted Orderflow " in TradingView's Indicators & Strategies. Customize settings like smoothing and order flow period to fit your trading style.
📊 Market Analysis: Watch for trend reversal alerts to capture trading opportunities by studying the behaviour of the indicator.
🔔 Alerts: Enable notifications for significant order flow changes to stay updated on market trends.
🔍 How It Works
The Efficiency Weighted Orderflow Indicator starts by calculating the efficiency of price movements using the absolute difference between the close and open prices, divided by volume. The order flow is then computed by summing these efficiency-weighted volumes over a specified period, with an option to apply Hull Moving Average (HMA) smoothing for enhanced signal stability. To ensure robust comparison, the order flow is normalized using standard deviation. The indicator plots these values as columns, with distinct colors representing bullish and bearish trends. Customizable parameters for period length and smoothing allow traders to tailor the indicator to their strategies. Additionally, visual cues and alert conditions for trend reversals and significant order flow changes keep traders informed and ready to act. This indicator improves on the Orderflow aspect of our Standardized Orderflow indicator. The Efficiency Weighted Orderflow is less susceptible to noise and is also quicker at detecting trend changes.
Auto Volume Spread Analysis (VSA) [TANHEF]Auto Volume Spread Analysis (visible volume and spread bars auto-scaled): Understanding Market Intentions through the Interpretation of Volume and Price Movements.
All the sections below contain the same descriptions as my other indicator "Volume Spread Analysis" with the exception of 'Auto Scaling'.
█ Auto-Scaling
This indicator auto-scales spread bars to match the visible volume bars, unlike the previous "Volume Spread Analysis " version which limited the number of visible spread bars to a fixed count. The auto-scaling feature allows for easier navigation through historical data, enabling both more historical spread bars to be viewed and more historical VSA pattern labels being displayed without requiring using the bar replay tool. Please note that this indicator’s auto-scaling feature recalculates the visible bars on the chart, causing the indicator to reload whenever the chart is moved.
Auto-scaled spread bars have two display options (set via 'Spread Bars Method' setting):
Lines: a bar lookback limit of 500 bars.
Polylines: no bar lookback limit as only plotted on visible bars on chart, which uses multiple polylines are used.
█ Simple Explanation:
The Volume Spread Analysis (VSA) indicator is a comprehensive tool that helps traders identify key market patterns and trends based on volume and spread data. This indicator highlights significant VSA patterns and provides insights into market behavior through color-coded volume/spread bars and identification of bars indicating strength, weakness, and neutrality between buyers and sellers. It also includes powerful volume and spread forecasting capabilities.
█ Laws of Volume Spread Analysis (VSA):
The origin of VSA begins with Richard Wyckoff, a pivotal figure in its development. Wyckoff made significant contributions to trading theory, including the formulation of three basic laws:
The Law of Supply and Demand: This fundamental law states that supply and demand balance each other over time. High demand and low supply lead to rising prices until demand falls to a level where supply can meet it. Conversely, low demand and high supply cause prices to fall until demand increases enough to absorb the excess supply.
The Law of Cause and Effect: This law assumes that a 'cause' will result in an 'effect' proportional to the 'cause'. A strong 'cause' will lead to a strong trend (effect), while a weak 'cause' will lead to a weak trend.
The Law of Effort vs. Result: This law asserts that the result should reflect the effort exerted. In trading terms, a large volume should result in a significant price move (spread). If the spread is small, the volume should also be small. Any deviation from this pattern is considered an anomaly.
█ Volume and Spread Analysis Bars:
Display: Volume and spread bars that consist of color coded levels, with the spread bars scaled to match the volume bars. A displayable table (Legend) of bar colors and levels can give context and clarify to each volume/spread bar.
Calculation: Levels are calculated using multipliers applied to moving averages to represent key levels based on historical data: low, normal, high, ultra. This method smooths out short-term fluctuations and focuses on longer-term trends.
Low Level: Indicates reduced volatility and market interest.
Normal Level: Reflects typical market activity and volatility.
High Level: Indicates increased activity and volatility.
Ultra Level: Identifies extreme levels of activity and volatility.
This illustrates the appearance of Volume and Spread bars when scaled and plotted together:
█ Forecasting Capabilities:
Display: Forecasted volume and spread levels using predictive models.
Calculation: Volume and Spread prediction calculations differ as volume is linear and spread is non-linear.
Volume Forecast (Linear Forecasting): Predicts future volume based on current volume rate and bar time till close.
Spread Forecast (Non-Linear Dynamic Forecasting): Predicts future spread using a dynamic multiplier, less near midpoint (consolidation) and more near low or high (trending), reflecting non-linear expansion.
Moving Averages: In forecasting, moving averages utilize forecasted levels instead of actual levels to ensure the correct level is forecasted (low, normal, high, or ultra).
The following compares forecasted volume with actual resulting volume, highlighting the power of early identifying increased volume through forecasted levels:
█ VSA Patterns:
Criteria and descriptions for each VSA pattern are available as tooltips beside them within the indicator’s settings. These tooltips provide explanations of potential developments based on the volume and spread data.
Signs of Strength (🟢): Patterns indicating strong buying pressure and potential market upturns.
Down Thrust
Selling Climax
No Effort ➤ Bearish Result
Bearish Effort ➤ No Result
Inverse Down Thrust
Failed Selling Climax
Bull Outside Reversal
End of Falling Market (Bag Holder)
Pseudo Down Thrust
No Supply
Signs of Weakness (🔴): Patterns indicating strong selling pressure and potential market downturns.
Up Thrust
Buying Climax
No Effort ➤ Bullish Result
Bullish Effort ➤ No Result
Inverse Up Thrust
Failed Buying Climax
Bear Outside Reversal
End of Rising Market (Bag Seller)
Pseudo Up Thrust
No Demand
Neutral Patterns (🔵): Patterns indicating market indecision and potential for continuation or reversal.
Quiet Doji
Balanced Doji
Strong Doji
Quiet Spinning Top
Balanced Spinning Top
Strong Spinning Top
Quiet High Wave
Balanced High Wave
Strong High Wave
Consolidation
Bar Patterns (🟡): Common candlestick patterns that offer insights into market sentiment. These are required in some VSA patterns and can also be displayed independently.
Bull Pin Bar
Bear Pin Bar
Doji
Spinning Top
High Wave
Consolidation
This demonstrates the acronym and descriptive options for displaying bar patterns, with the ability to hover over text to reveal the descriptive text along with what type of pattern:
█ Alerts:
VSA Pattern Alerts: Notifications for identified VSA patterns at bar close.
Volume and Spread Alerts: Alerts for confirmed and forecasted volume/spread levels (Low, High, Ultra).
Forecasted Volume and Spread Alerts: Alerts for forecasted volume/spread levels (High, Ultra) include a minimum percent time elapsed input to reduce false early signals by ensuring sufficient bar time has passed.
█ Inputs and Settings:
Indicator Bar Color: Select color schemes for bars (Normal, Detail, Levels).
Indicator Moving Average Color: Select schemes for bars (Fill, Lines, None).
Price Bar Colors: Options to color price bars based on VSA patterns and volume levels.
Legend: Display a table of bar colors and levels for context and clarity of volume/spread bars.
Forecast: Configure forecast display and prediction details for volume and spread.
Average Multipliers: Define multipliers for different levels (Low, High, Ultra) to refine the analysis.
Moving Average: Set volume and spread moving average settings.
VSA: Select the VSA patterns to be calculated and displayed (Strength, Weakness, Neutral).
Bar Patterns: Criteria for bar patterns used in VSA (Doji, Bull Pin Bar, Bear Pin Bar, Spinning Top, Consolidation, High Wave).
Colors: Set exact colors used for indicator bars, indicator moving averages, and price bars.
More Display Options: Specify how VSA pattern text is displayed (Acronym, Descriptive), positioning, and sizes.
Alerts: Configure alerts for VSA patterns, volume, and spread levels, including forecasted levels.
█ Usage:
The Volume Spread Analysis indicator is a helpful tool for leveraging volume spread analysis to make informed trading decisions. It offers comprehensive visual and textual cues on the chart, making it easier to identify market conditions, potential reversals, and continuations. Whether analyzing historical data or forecasting future trends, this indicator provides insights into the underlying factors driving market movements.

Weighted Volume Profile Pivot Points | Flux Charts💎 GENERAL OVERVIEW
Introducing our new Weighted Volume Profile Pivot Points (WVPPP) Indicator! This indicator renders a volume profile using the latest pivot points, automatically adjusting itself when new pivots occur. The pivoting mode can be switched between default pivot points and order blocks mode. It can be adjusted to give more weight to recent or past candlesticks, or can be used as a normal volume profile. For more information, please read the full write-up.
Features of the new Weighted Volume Profile Pivot Points (WVPPP) Indicator :
Renders Volume Profile Of The Range Between Latest Pivots
Two Pivoting Modes Including Order Blocks Mode
Adjustable Weighthing Towards Past or Recent
Customizable Row Count & Maximum Distance
Left or Right Alignment
More Styling Options
🚩UNIQUENESS
This indicator stands out with two key features. One is it's ability to weight volumes based on their distance to the current time. Giving weight to volumes may offer new trading opportunities to traders as they can now see the most recent Point Of Control (POC) or a more powerful but past POC based on their choice. Another key feature the indicator has is that it automatically finds latest valid pivot points, and uses that range for the volume profile. The range changes dynamically as new pivots points emerge. You can select between normal pivot points and order blocks mode. The indicator also has a variety of useful styling settings such as aligning the volume profile to the right or the left of the chart, POC Line styling and color settings for bullish & bearish volumes.
📌 HOW DOES IT WORK ?
A volume profile provides an in-depth look at trading activity over a period of time by plotting a histogram on the price axis. This indicator can also give weight to volumes based on their distance to the current time, essentially determining their importance for the profile. The range which the volume profile will cover is determined by the latest pivot points. Here is how it works step-by-step :
1. Determine how much candlesticks the volume profile will cover (Analyze Bars setting)
2. Find the latest pivot points. If the mode is set to "Pivots", the pivot points are the candlesticks which has the highest / lowest wick in X amount of bars (Swing Length setting). If the mode is set to "Order Blocks", the volume profile range is the area between the latest buyside order block and the sellside order block. Order blocks occur when there is a high amount of market orders exist on a price range. It is possible to find order blocks using specific candlestick formations on the chart. For more information about the order block detection, I suggest you checking the write-up of our "Volumized Order Blocks" script. Increasing the "Swing Length" setting is recommended when the mode is set to "Pivots", as this will help in finding stronger pivot points.
3. Make a range using the latest pivot points, then divide it into rows (Row Count setting)
4. Then for each candlestick, add it's volume to the corresponding row in the range. Note that the volume can be added into several rows if it overlaps with them all.
5. If the candlestick is a bullish candlestick, we add it's volume into the bullish volume of the row, if it's a bearish candlestick, we add it to the bearish volume of the row.
With the weighted volume mode, which is activated if "Volume Weighthing" setting is set to "Recent" or "Past", all volumes get a penalty based on their distance to the latest candletstick. For example, if the setting is set to "Recent", the latest candlestick contributes it's volume by 100% to the corresponding row, but the candlestick which is 50 candlesticks far from the current candlestick only contributes it's volume by ~17% to the row. The same applies to the "Past" setting, but in the reversed order, where past candlesticks have more priority than the current ones.
Volume contribution percent for "Recent" setting : ((100 * 0.85) / (i + 1)) + (100 * (1.0 - 0.85))
Volume contribution percent for "Past" setting : ((100 * 0.85) * ((i + 1) / N)) + (100 * (1.0 - 0.85))
Where i = candlestick index from right to left, N = total number of candlesticks analyzed by the volume profile.
The Point Of Control (POC) line is drawn from the row with the most total volume, and is generally considered as a strong level because a lot of trading volume happened on that particular row. Traders may use this line as a support & resistance level.
We believe that automatically ranging the volume profile to important pivot points will help traders see crucial volume information easier without unnecessary hassle. Traders can use this indicator to have an insight of areas which price moves quickly without much volume, or see areas that holds the price still for much longer and plan their trades accordingly.
⚙️SETTINGS
1. General Configuration
Mode -> The pivoting mode that is switchable between "Pivots" and "Order Blocks" as described in the write-up. Please read the upper section to understand how this setting works.
Analyze Bars -> Total amount of bars that will be analyzed by the indicator from right to left.
Row Count -> The amount of rows that will the vertical range between pivot points will be divided into.
Volume Weighting -> The volume weighting mode as explained in the write-up.
2. Style
Highlight Sessions -> The volume profile sessions will be highlighted with a blue tint. To prevent confusion, highlighting will not work if the alignment is set to "Right".
Align To -> The alignment of the volume profile.

Aggressor Volume ImbalanceAggressor volume imbalance represents the ratio between market aggressor buy volume (market buy orders) and market aggressor sell volume (market sell orders). This ratio enables traders to evaluate the interest of market aggressors and whether aggressive market activity favours the price's direction.
Analysing aggressor volume is critical in understanding market sentiment and aids in identifying shifts in momentum and potential exhaustion points in the market. When the aggressor buy volume significantly exceeds the sell volume, it typically indicates strong buying interest, driving prices higher if the offer-side liquidity cannot contain it, and vice versa.
How it Works
The imbalance ratio is calculated as follows, according to the selected session timeframe (see settings):
imbalance := ((buyVolumeAccumulator - sellVolumeAccumulator)
/ (buyVolumeAccumulator + sellVolumeAccumulator)) * 100
Aggressive Volume Imbalance uses lower timeframe historical data to calculate Historical Aggressor Volume Imbalances, while live data is used for live aggressor volume imbalances.
How to Use It
You can set the indicator to use any historical data timeframe you prefer. However, it is highly recommended to use lower timeframes (e.g., 1 second), as the lower the timeframe, the more granular the data.
The indicator resets to 0% whenever a new session timeframe begins (e.g., a new day) and calculates new values for the rest of the session. This can be configured in the settings.

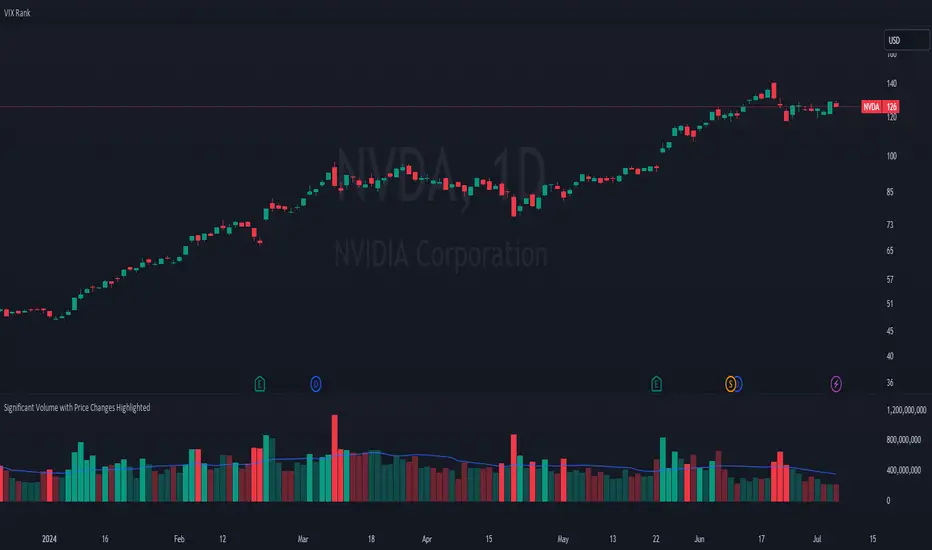
Significant Volume with Price Changes HighlightedSignificant Volume with Price Changes Highlighted
The "Significant Volume with Price Changes Highlighted" indicator by PappyTrading is a powerful tool designed to help traders identify significant volume spikes and price changes in the market. This indicator overlays the volume bars on the price chart and highlights them based on specific volume and price change conditions, providing a clear visual representation of market activity.
What It Does
This indicator calculates the moving average of the volume over a specified period and compares the current volume to this average. It also calculates the daily percentage change relative to the previous day's close and compares this to its moving average. The volume bars are then color-coded based on the following conditions:
Bright Green (#089981): Indicates a significant volume spike with an above-average price increase.
Bright Red (#f23645): Indicates a significant volume spike with an above-average price decrease.
Green with 60% transparency: Indicates a normal up day with a price increase but not a significant volume spike.
Red with 60% transparency: Indicates a normal down day with a price decrease but not a significant volume spike.
Additionally, the indicator plots a 20-period simple moving average (SMA) of the volume, providing a reference point to understand the general volume trend.
How It Works
Volume Calculation:
The indicator calculates the 20-period SMA of the volume and compares the current volume to this average to determine if there is a significant volume spike.
Price Change Calculation:
The indicator calculates the daily percentage change in price relative to the previous day's close and compares this to the 20-period SMA of the percentage change to identify significant price movements.
Color Coding:
The volume bars are color-coded based on the combination of the volume and price change conditions. This visual representation allows traders to quickly identify significant market activities.
How to Use It
Overlay on Chart:
Add the "Significant Volume with Price Changes Highlighted" indicator to your chart. The volume bars will be displayed at the bottom of the chart, color-coded based on the conditions described above.
Identify Market Activity:
Use the color-coded volume bars to identify significant market activities. Bright green bars indicate strong buying pressure, while bright red bars indicate strong selling pressure. Transparent green and red bars indicate normal market activity without significant volume spikes.
Volume Moving Average:
The blue line represents the 20-period SMA of the volume. Use this as a reference to understand the general volume trend and identify deviations from the average.
Concepts Underlying the Calculations
Volume Spikes: Significant volume spikes often precede or accompany major market moves. By highlighting these spikes, traders can gain insights into potential market turning points or continuation patterns.
Price Changes: Large price changes relative to the previous day's close indicate strong market momentum. By comparing these changes to their moving average, the indicator helps traders identify unusually strong buying or selling pressure.
This indicator is ideal for traders who want to gain a deeper understanding of market dynamics by analyzing volume and price changes together. It is suitable for various trading styles, including trend following, swing trading, and scalping.
Frequency and Volume ProfileFREQUENCY & VOLUME PROFILE
⚪ OVERVIEW
The Frequency and Volume Profile indicator plots a frequency or volume profile based on the visible bars on the chart, providing insights into price levels with significant trading activity.
⚪ USAGE
● Market Structure Analysis:
Identify key price levels where significant trading activity occurred, which can act as support and resistance zones.
● Volume Analysis:
Use the volume mode to understand where the highest trading volumes have occurred, helping to confirm strong price levels.
● Trend Confirmation:
Analyze the distribution of trading activity to confirm or refute trends, mark important levels as support and resistance, aiding in making more informed trading decisions.
● Frequency Distribution:
In statistics, a frequency distribution is a list of the values that a variable takes in a sample. It is usually a list. Displayed as a histogram.
⚪ SETTINGS
Source: Select the price data to use for the profile calculation (default: hl2).
Move Profile: Set the number of bars to offset the profile from the current bar (default: 100).
Mode: Choose between "Frequency" and "Volume" for the profile calculation.
Profile Color: Customize the color of the profile lines.
Lookback Period: Uses 5000 bars for daily and higher timeframes, otherwise 10000 bars.
The Frequency Profile indicator is a powerful tool for visualizing price levels with significant trading activity, whether in terms of frequency or volume. Its dynamic calculation and customizable settings make it a versatile addition to any trading strategy.

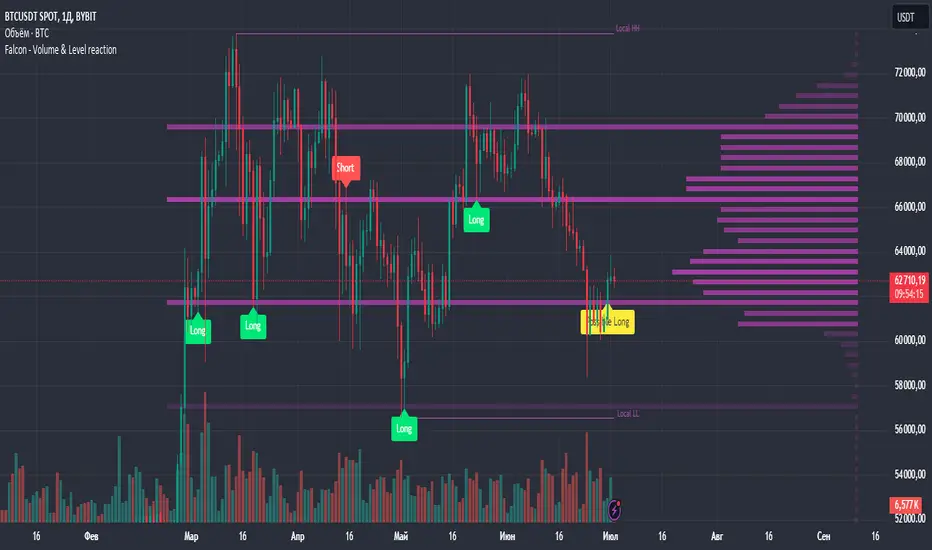
Falcon - Volume & Level reaction Falcon - Volume & Level Reaction
Our indicator, Falcon - Volume & Level Reaction, is designed to provide traders with comprehensive insights into price behavior through the calculation of horizontal volume profiles. By analyzing these profiles, the indicator identifies key levels and assesses price reactions, offering valuable trading signals.
---
# Concept
The Falcon - Volume & Level Reaction indicator is built to help traders identify and capitalize on key market levels by analyzing volume profiles and price behavior. This indicator enhances trading strategies by providing clear signals based on robust analysis, allowing traders to make informed decisions and improve their trading outcomes.
---
# Functions
1. Volume Profile Calculation
- Profile Period: Calculates horizontal volume profiles over a specified number of bars.
- Peak Volumes: Identifies peak volume levels based on the sensitivity parameter.
2. Price Behavior Analysis
- Primary Check: Determines if bars close above or below the peak level.
- Secondary Checks:
- Volume Decrease: Confirms a decrease in volume after the price touches the level.
- Volatility Check: Ensures bars do not exceed the average ATR range.
3. Signal Generation
- Combined Signals: The primary check generates initial long/short signals, while secondary checks strengthen these signals.
- Real-time Alerts: Provides "Potential" short or long signals based on the current candle's closure relative to the level.
4. Comprehensive Analysis: Helps identify multiple factors that validate level protection and potential price reversals.
---
# Description of Checks
1. Primary Check: Price Closure
- This check assesses whether the bars close above or below the identified peak volume levels. If the price closes above the level, it generates a long signal; if it closes below, it generates a short signal. This check is fundamental as it directly indicates the price's interaction with significant volume levels.
2. Secondary Check 1: Volume Decrease
- After the price touches a peak volume level, this check verifies if there is a subsequent decrease in trading volume. A decrease in volume after touching the level suggests reduced market interest at that price, which can indicate potential reversals or continuations based on the overall market context.
3. Secondary Check 2: Volatility Check
- This check ensures that the price bars do not exceed the average ATR range after touching the peak volume level. Lower volatility near key levels indicates stability and strengthens the signal generated by the primary check, confirming the market's reaction to these levels.
---
# How to Use the Indicator
1. Set Parameters: Define volume profile parameters such as profile period, number of peaks, and level sensitivity.
2. Analyze the Chart: Observe the peak volume levels displayed on the chart.
3. Receive Signals: Follow the buy or sell signals that appear when the price touches the level and the primary and secondary checks are met.
4. Respond to Alerts: When a "Potential" long or short signal appears, evaluate the closure of the current candle relative to the level to make a trading decision.
Example of Work
- Setup:
- Result:
---
# Input Parameters
- Profile back: Defines the lookback period for volume profiles (10–500, step 1).
- Max Profile: Sets the maximum number of profiles (10–300, step 5).
- Profiles Length: Specifies the length of profiles (10–100, step 1).
- Profiles Offset: Determines the offset for profiles (0–100, step 1).
- Profiles Width: Sets the width of profiles (1–10).
- Profiles Color: Chooses the color for profiles.
- Lvls Color: Chooses the color for levels.
- Lvl's sensitivity: Adjusts the sensitivity of levels (1–10).
- tolerance: Sets the tolerance level (0.000–0.003, step 0.001).
- tolerance ATR: Defines the ATR tolerance (1.0–4.0).
---
Falcon - Volume & Level Reaction
Индикатор на основе горизонтальных объемов помогает трейдерам выявлять ключевые уровни объемной проторговки, предоставляя четкие сигналы для принятия торговых решений.
Функции
– Определение и отображение пиковых уровней объемной проторговки.
– Сигналы на покупку (Long) и продажу (Short) на основе поведения цены.
– Анализ объема торгов до и после касания уровня.
– Оценка волатильности цены в период консолидации.
– Автоматическая подстройка под выбранный таймфрейм.
– Отображение локальных максимумов и минимумов.
Настройки
– Количество баров назад VRVP: определяет период для расчета горизонтальных объемов.
– Множитель ATR: коэффициент для вычисления волатильности.
– Множитель погрешности: допустимая погрешность касания уровня.
– Период расчета ATR: количество баров для расчета среднего ATR.
– Отображение Local HH/LL: включение/выключение отображения локальных максимумов и минимумов.
Версии
Данный скрипт – упрощенная версия нашего индикатора с закрытым доступом. Открытая версия доступна для BTC и ETH, только на дневном таймфрейме, без возможности изменения параметров
VWAP Bands [UAlgo]The "VWAP Bands " indicator is designed to provide traders with valuable insights into market trends and potential support/resistance levels using Volume Weighted Average Price (VWAP) bands. This indicator integrates the core concepts of VWAP with additional trend analysis features, making it a versatile tool for both range trading and trend-following strategies.
The VWAP bands are plotted based on the standard deviation multipliers, creating upper and lower bands around the VWAP. These bands serve as dynamic support and resistance levels. When the price approaches these bands, traders can anticipate potential reversals or continuations of the current trend. Additionally, the indicator provides visual cues for trend strength and potential trend changes, helping traders make informed decisions in various market conditions.
🔶 Settings
Source (Data Source): The data source for VWAP calculations. The default setting is the typical price (HLC3), which is the average of the high, low, and close prices.
Length: The number of bars used in the VWAP calculation. This determines the lookback period for the indicator.
Standard Deviation Multiplier: The multiplier applied to the standard deviation to create the primary upper and lower VWAP bands. This setting controls the distance of the bands from the VWAP.
Secondary Standard Deviation Multiplier: The multiplier applied to the standard deviation to create the secondary upper and lower VWAP bands, providing additional levels of support and resistance.
Display Trend: A toggle to enable or disable the display of the trend analysis feature. When enabled, the indicator highlights trend strength and potential trend changes.
Display Trend Crossovers: A toggle to enable or disable the display of trend crossover signals. When enabled, the indicator plots shapes to indicate where trend switches are likely occurring.
🔶 Calculations
The calculations behind the "VWAP Bands " indicator begin with determining the Volume Weighted Average Price (VWAP), which provides a comprehensive view of the average price of an asset, weighted by trading volume. This gives a more accurate representation of the asset's true average price over a specified period.
The first step in this process involves summing the trading volume over a chosen period, typically represented by the length parameter. Simultaneously, the product of the price (usually an average of the high, low, and close prices) and the trading volume is calculated and summed. By dividing this cumulative price-volume product by the total volume, we obtain the VWAP value. This VWAP serves as the central anchor around which the price action oscillates.
To enhance the utility of VWAP, we introduce standard deviation calculations. Standard deviation measures the extent of price dispersion from the VWAP, providing insight into price volatility. By calculating the variance (which involves the squared deviations of price) and then taking its square root, we derive the standard deviation. This helps in understanding how far prices typically stray from the VWAP.
With the VWAP and standard deviation in hand, we then establish upper and lower bands by adding and subtracting multiples of the standard deviation from the VWAP. These bands act as dynamic support and resistance levels, adapting to changes in market volatility. The primary bands, set by the first standard deviation multiplier, are augmented by secondary bands defined by a larger multiplier, offering additional layers of potential support and resistance.
It also integrates trend analysis, highlighting areas where the price action suggests a strong or weak trend. This is achieved by overlaying colored zones above and below the bands, indicating the strength and direction of the trend. When the price crosses these bands, it signals potential trend changes, aiding traders in making timely decisions.
🔶 Disclaimer
The "VWAP Bands " indicator is provided for educational and informational purposes only. It is not intended as financial advice and should not be construed as such.
Trading involves significant risk and may not be suitable for all investors. Before using this indicator or making any investment decisions, it is important to conduct thorough research and consider your financial situation.
