Huge VolumesHuge Volumes indicator plots areas on the chart where trading volume spikes — showing where strong buying or selling pressure takes place.
It helps visualize how large players move in and out of positions, making it easier to spot potential turning points or confirm trends.
Volume

VipPro VWAP Momentum Tracker — Auto Buy/Sell + Fibonacci TPVipPro VWAP Momentum Tracker is an auxiliary tool designed to complement the main VipPro Realtime indicator.
It is primarily used on lower timeframes to filter false entries and refine intraday precision.
The script combines VWAP (Volume Weighted Average Price) with short-term momentum analysis and Fibonacci-based target projection.
It automatically generates two technical profit levels derived from Fibonacci extensions — 1.27 and 1.61 — providing a structured approach to short-term trade management.
VWAP acts as the dynamic reference line (orange).
When price is above VWAP, it reflects buying pressure and potential long setups.
When price is below VWAP, it suggests selling pressure and potential short opportunities.
The VWAP represents the market’s fair-value zone based on both price and volume, making it one of the most reliable metrics for identifying institutional positioning and volume-weighted trend direction.
This tool can be used independently or in combination with VipPro Realtime, especially when confirming signals from the upper dashboard that summarizes:
Market trend
Liquidity conditions
Momentum strength
RSI and volatility context
Overbought/Oversold signals
Results may vary depending on the trader’s experience and ability to interpret market structure in conjunction with VWAP behavior and momentum alignment.

Statistical Price Deviation Index (MAD/VWMA)SPDI is a statistical oscillator designed to detect potential price reversal zones by measuring how far price deviates from its typical behavior within a defined rolling window.
Instead of using momentum or moving averages like traditional indicators, SPDI applies robust statistics - a rolling median and Mean Absolute Deviation (MAD) - to calculate a normalized measure of price displacement. This normalization keeps the output bounded (from −1 to +1 by default), producing a stable and consistent oscillator that adapts to changing volatility conditions.
The second line in SPDI uses a Volume-Weighted Moving Average (VWMA) instead of a simple price median. This creates a complementary oscillator showing statistically weighted deviations based on traded volume. When both oscillators align in their extremes, strong confluence reversal signals are generated.
How It Works
For each bar, SPDI calculates the median price of the last N bars (default 100).
It then measures how far the current bar’s midpoint deviates from that rolling median.
The Mean Absolute Deviation (MAD) of those distances defines a “normal” range of fluctuation.
The deviation is normalized and compressed via a tanh mapping, keeping the oscillator in fixed boundaries (−1 to +1).
The same logic is applied to the VWMA line to gauge volume-weighted deviations.
How to Use
The blue line (Price MAD) represents pure price deviation.
The green line (VWMA Disp) shows the volume-weighted deviation.
Overbought (red) zones indicate statistically extreme upward deviation -> potential short-term overextension.
Oversold (green) zones indicate statistically extreme downward deviation -> potential rebound area.
Confluence signals (both lines hitting the same extreme) often mark strong reversal points.
Settings Tips
Lookback length controls how much historical data defines “normal” behavior. Larger = smoother, smaller = more sensitive.
Smoothing (RMA length) can reduce noise without changing the overall statistical logic.
Output scale can be set to either −1..+1 or 0..100, depending on your visual preference.
Alerts and color fills are fully customizable in the Style tab.
Summary:
SPDI transforms raw price and volume data into a statistically bounded deviation index. When both Price MAD and VWMA Disp reach joint extremes, it highlights probable market turning points - offering traders a clean, data-driven way to spot potential reversals ahead of time.

ICT HTF Volume Candles (Based on HTF Candles by Fadi)# ICT HTF Volume Candles - Multi-Timeframe Volume Analysis
## Overview
This indicator provides multi-timeframe volume visualization designed to complement price action analysis. It displays volume data from up to 6 higher timeframes simultaneously in a separate panel, allowing traders to identify volume spikes, divergences, and institutional activity without switching between timeframes.
**Original Concept Credits:** This indicator builds upon the HTF Candles framework by Fadi, adapting it specifically for volume analysis with enhanced features including gap-filling for extended hours, multiple scaling methods, and advanced synchronization.
## What Makes This Script Original
### Key Innovations:
1. **Three Volume Scaling Methods:**
- **Per-HTF Auto Scale:** Each timeframe scales independently for detailed comparison
- **Global Auto Scale:** All timeframes use unified scale for relative volume comparison
- **Manual Scale:** User-defined maximum for consistent analysis across sessions
2. **Bullish/Bearish Volume Differentiation:**
- Volume bars colored based on price movement (close vs open)
- Separate styling for bullish (green) and bearish (red) volume periods
- Helps identify whether volume supports price direction
3. **Advanced Time Synchronization:**
- Custom daily candle open times (Midnight, 8:30 AM, 9:30 AM ET)
- Timezone-aware calculations for New York trading hours
- Real-time countdown timers for each timeframe
- **Gap-filling technology** for continuous display during extended hours and weekends
4. **Flexible Display Options:**
- Configurable spacing and positioning
- Label placement (top, bottom, or both)
- Day-of-week or time interval labels on candles
- Works reliably in backtesting and live trading
## How It Works
### Volume Calculation
The indicator uses `request.security()` with optimized parameters to fetch volume data from higher timeframes:
- **Volume Open/High/Low/Close (OHLC):** Tracks volume changes within each HTF candle
- **Color Logic:** Compares HTF close vs open prices to determine bullish/bearish classification
- **Alignment:** All volume bars share a common baseline for easy visual comparison
- **Gap Handling:** Uses `gaps=barmerge.gaps_off` to maintain continuity during non-trading hours
### Technical Implementation
```
1. Monitors HTF timeframe changes using request.security() with lookahead
2. Creates new VolumeCandle object when HTF bar opens
3. Updates current candle's volume H/L/C on each chart bar
4. Applies selected scaling method to normalize display height
5. Repositions all candles and labels on each bar update
6. Fills gaps automatically during extended hours for consistent display
```
### Scaling Methods Explained
**Method 1 - Auto Scale per HTF:**
Each timeframe displays volume relative to its own maximum. Best for identifying patterns within each individual timeframe.
**Method 2 - Global Auto Scale:**
All timeframes share the same scale based on the highest volume across all HTFs. Best for comparing relative volume strength between timeframes.
**Method 3 - Manual Scale:**
User sets maximum volume value. Best for maintaining consistent scale across different trading sessions or instruments.
## How to Use This Indicator
### Setup
1. Add indicator to your chart (it appears in a separate panel below price)
2. Configure up to 6 higher timeframes (default: 5m, 15m, 1H, 4H, 1D, 1W)
3. Set number of candles to display for each timeframe
4. Choose volume scaling method based on your analysis needs
5. Enable "Fix gaps in non-trading hours" for extended hours trading (enabled by default)
### Interpretation
**Volume Spikes:**
- Sudden increase in volume height indicates institutional activity or strong conviction
- Compare volume between timeframes to identify where the real money is moving
- Look for volume spikes that appear across multiple timeframes simultaneously
**Bullish vs Bearish Volume:**
- **Green volume bars:** Price closed higher (buying pressure)
- **Red volume bars:** Price closed lower (selling pressure)
- High green volume during uptrend = confirmation of strength
- High red volume during downtrend = confirmation of weakness
- High volume opposite to trend = potential reversal warning
**Multi-Timeframe Context:**
- **5m/15m:** Scalping and day trading activity
- **1H/4H:** Swing trading and intraday institutional flows
- **Daily/Weekly:** Major position building and long-term trends
**Divergences:**
- Price making new highs but volume declining = weakening trend
- Volume increasing while price consolidates = potential breakout brewing
- Price breaks level but volume doesn't confirm = likely false breakout
### Practical Examples
**Example 1 - Institutional Confirmation:**
Price breaks above resistance. Check volume across timeframes:
- 5m shows spike = retail interest
- 15m + 1H + 4H all show spikes = institutional confirmation
- **Trade confidence: HIGH**
**Example 2 - False Breakout Detection:**
Price breaks resistance with:
- High volume on 5m only
- Normal/low volume on 1H and 4H
- **Interpretation:** Likely retail trap, institutions not participating
- **Action:** Wait for pullback or avoid
**Example 3 - Accumulation Phase:**
Price ranges sideways but:
- Daily volume gradually increasing
- Weekly volume above average
- **Interpretation:** Smart money accumulating
- **Action:** Prepare for breakout in direction of volume
**Example 4 - Volume Divergence:**
Price makes new high:
- Current high has lower volume than previous high across all timeframes
- **Interpretation:** Weakening momentum
- **Action:** Consider profit-taking or reversal trade
## Configuration Parameters
### Timeframe Settings
- **HTF 1-6:** Select timeframes (must be higher than chart timeframe)
- **Max Display:** Number of candles to show per timeframe (1-50)
- **Limit to Next HTFs:** Display only first N enabled timeframes (1-6)
### Styling
- **Bull/Bear Colors:** Separate colors for body, border, and wick
- **Padding from current candles:** Distance offset from live price action
- **Space between candles:** Gap between individual volume bars
- **Space between Higher Timeframes:** Gap between different timeframe groups
- **Candle Width:** Thickness of volume bars (1-4, multiplied by 2)
### Volume Settings
- **Volume Scale Method:** Choose 1, 2, or 3
- 1 = Auto Scale per HTF (each TF independent)
- 2 = Global Auto Scale (all TF unified)
- 3 = Manual Scale (user-defined max)
- **Auto Scale Volume:** Enable/disable automatic scaling
- **Manual Scale Max Volume:** Set maximum when using Method 3
### Label Settings
- **HTF Label:** Show/hide timeframe names with color and size options
- **Label Positions:** Display at Top, Bottom, or Both
- **Label Alignment:** Align centered or Follow Candles
- **Remaining Time:** Show countdown timer until next HTF candle
- **Interval Value:** Display day-of-week or time on each candle
### Custom Daily Candle
- **Enable Custom Daily:** Override default daily candle timing
- **Open Time Options:**
- **Midnight:** Standard 00:00 ET daily open
- **8:30 AM:** Align with economic data releases
- **9:30 AM:** Align with NYSE market open
- Useful for specific trading strategies or market alignment
### Advanced Settings
- **Fix gaps in non-trading hours:** Maintains alignment during extended hours and weekends (recommended: ON)
- Prevents visual gaps during forex weekend closures
- Ensures consistent display during crypto 24/7 trading
- Improves backtesting reliability
## Best Practices
1. **Pair with Price Action:** Use alongside HTF price candles indicator for complete picture
2. **Start Simple:** Enable 2-3 timeframes initially (e.g., 15m, 1H, 4H), add more as needed
3. **Match Settings:** Use same candle width/spacing as companion price indicator for visual alignment
4. **Scale Appropriately:**
- Use **Global scale** (Method 2) when comparing timeframes
- Use **Per-HTF scale** (Method 1) for pattern analysis within each timeframe
- Use **Manual scale** (Method 3) for consistent day-to-day comparison
5. **Watch for Volume Clusters:** High volume appearing simultaneously across multiple HTFs signals significant market events
6. **Confirm Breakouts:** Always check if volume supports the price movement across higher timeframes
7. **Extended Hours:** Keep "Fix gaps" enabled for 24/7 markets (Forex, Crypto) and weekend analysis
## Technical Notes
- **Timezone:** All calculations use America/New_York timezone for consistency
- **Real-time Updates:** Volume and timers update on each tick during market hours
- **Performance:** Optimized with max_bars_back=5000 for extensive historical analysis
- **Compatibility:** Works on all instruments with volume data (Stocks, Forex, Crypto, Futures)
- **Gap Handling:** Uses `barmerge.gaps_off` to fill data gaps during non-trading periods
- **Backtesting:** Uses `lookahead=barmerge.lookahead_on` for stable historical data without repainting
- **Data Continuity:** Automatically handles market closures, weekends, and extended hours
## Updates & Improvements
**Version 2.0 (Current):**
- ✅ Fixed alignment issues during extended hours and weekends
- ✅ Eliminated repainting in backtesting
- ✅ Added gap-filling technology for continuous display
- ✅ Improved data synchronization across all timeframes
- ✅ Enhanced NA value handling for data integrity
- ✅ Added advanced settings group for user control
## Support
For questions, suggestions, or feedback, please comment on the publication or message the author.
---
**Disclaimer:** This indicator is for educational and informational purposes only. It does not constitute financial advice. Past performance is not indicative of future results. Always perform your own analysis and implement proper risk management before making trading decisions.

Vip Pro Realtime VipPro Realtime — Technical Overview
VipPro Realtime is a multi-layer analytical indicator designed for real-time liquidity and momentum tracking across all markets on TradingView.
It integrates price structure, volatility, and volume dynamics into a unified dashboard that allows traders to visually interpret market phases in seconds.
🔹 Core Components
Directional Framework (Trend Logic)
VipPro Realtime uses a dual-EMA structure to determine short- and mid-term momentum alignment.
When both layers confirm, the background color changes to visualize the prevailing trend:
🟢 Green → bullish momentum
🔴 Red → bearish momentum
⚪ Gray → corrective or neutral phase
Liquidity & Volume Mapping
The script evaluates volume pressure relative to its moving average and applies a dynamic volume-to-volatility ratio.
This helps detect where actual market participation occurs instead of relying only on price movement.
RSI & Volatility Filters
RSI and ATR values are normalized to reduce noise.
The indicator highlights overbought/oversold conditions and provides contextual volatility levels to help avoid false signals in low-liquidity environments.
VWAP Integration
A VWAP baseline defines fair-value zones and helps identify extension points for potential mean reversion setups.
Open Interest Layer (OI Monitor)
When available, the indicator requests aggregated open interest data from related perpetual markets and calculates short-term deltas to visualize:
📈 Increasing OI with rising price → potential long buildup
📉 Increasing OI with falling price → potential short buildup
⚠️ Decreasing OI → profit-taking or liquidation reduction
Wave & Fibonacci Targeting
The tool automatically identifies impulsive and corrective phases and projects short-term expansion levels (1.27 and 1.61) based on recent swings.
Dashboard Interface
The top-center table summarizes all key parameters:
Trend direction
Liquidity state
Momentum strength
Volatility context
RSI condition
Signal status
OI condition
🔹 Use Case
VipPro Realtime is built for traders who need quantitative confirmation of price behavior rather than subjective pattern recognition.
It helps interpret when a movement is supported by real liquidity inflow/outflow, allowing better timing for entries and exits across intraday or swing strategies.
🔹 Compatibility
✅ Works on all TradingView timeframes
✅ Applicable to crypto, forex, stocks, and commodities
✅ Requires no external data feeds or third-party services
🔹 Important Note
This script does not provide financial advice or guaranteed results.
Its purpose is to enhance situational awareness by merging multiple layers of market data (trend, volume, momentum, and OI) into one simplified view.
Traders should always confirm signals with their own risk management and market understanding.
Feel free to ask any questions at amr@mobeline.de .

Advanced Weis Wave Volume [Afnan]Advanced Weis Wave Volume is an enhanced upgrade of the classic Weis Wave concept. It measures accumulated volume within price swings to show where buying and selling pressure truly shift — but with one major edge: optional consolidation detection.
Most wave volume indicators simply plot bullish and bearish waves. Advanced Weis Wave Volume goes further by giving you the choice to highlight sideways or low-momentum consolidation phases, making it easy to spot when the market lacks real momentum. This helps traders instantly filter out weak, low-probability setups and focus only on the high-energy waves that truly matter.
⚙️ Key Features
Weis Wave Method – Uses ATR-based wave calculation to identify directional volume accumulation with precision.
Optional Consolidation Highlighting – You control it. Enable or disable consolidation detection based on your trading style. When enabled, it visually marks low-momentum or range-bound conditions, helping you instantly recognize when the market is consolidating.
Smart Volume Alignment – Choose to include or exclude the reversal candle's volume in new waves for more accurate readings.
Clear Visuals – Color-coded waves for Bullish (Green), Bearish (Red), and optional Consolidation (Orange) phases.
Compact Status Table – Displays the current market condition (Bullish, Bearish, or Consolidation) directly on your chart.
Flexible Display Options – Plot all waves above zero line, customize colors, and control what information you see.
💡 Why This Indicator Is Superior
✅ vs. Other Wave Volume Indicators:
Others only show waves; they can't identify consolidation. Advanced Weis Wave Volume gives you the option to enable consolidation detection — saving you time by automatically filtering weak market phases when you need it.
✅ vs. Standard Volume Bars:
Regular volume bars show isolated candle data. Advanced Weis Wave Volume shows accumulated directional pressure, revealing true trend strength and institutional activity.
✅ vs. Basic Weis Wave Indicators:
Standard Weis Wave indicators lack consolidation awareness. This indicator adds that layer of intelligence while keeping the classic wave calculation intact.
Bottom Line:
This is the only Weis Wave volume indicator that gives you control over consolidation filtering. Others show every move equally — Advanced Weis Wave Volume shows what actually matters, when you want it to.
📈 How to Use
Trading with the Waves:
🟢 Green Waves (Bullish): Building buying pressure — look for long setups.
🔴 Red Waves (Bearish): Rising selling pressure
🟠 Orange Zones (Consolidation): (When enabled) Market is ranging — avoid new trades .
Large waves: Strong trends and high-probability continuations.
Shrinking waves: Weakening momentum or possible reversal ahead.
Critical Insight - Avoiding False Volume Signals:
Large waves aren't always reliable. If you see a wave colored in orange (consolidation), it means the market was moving sideways but no real directional momentum.
This is crucial because:
❌ A big green wave in consolidation ≠ strong upside buying
❌ A big red wave in consolidation ≠ strong downside selling
✅ These are just range-bound volume accumulations that mislead traders
With consolidation detection enabled, you can instantly identify and ignore these deceptive Consolidation waves, focusing only on directional volume that actually reflects true buying or selling pressure. This prevents you from entering trades based on false volume signals during sideways markets.
📌 Practical Applications:
Breakout Confirmation: Real breakouts show expanding volume waves; false breakouts show weak waves or consolidation-marked volume.
Trend Validation: In a healthy trend, waves in the direction of the move are stronger, larger, and show clear directional color (green/red).
Consolidation Avoidance: (When enabled) Orange zones warn you to step aside and preserve capital — even if the wave looks large. Size doesn't matter if momentum is absent.
Filter False Volume: Avoid trading large waves that occur during consolidation — they don't represent genuine directional moves, just sideways accumulation.
Divergence Detection: Price makes new highs/lows, but wave volume shrinks — a sign of exhaustion or reversal.
Analyzing Ranges: During accumulation or distribution, Advanced Weis Wave Volume helps identify how institutional players are participating within the range — revealing when a breakout is likely to occur.
✨ The Competitive Advantage
Many Weis Wave indicators exist on TradingView - they all show volume waves. Only Advanced Weis Wave Volume gives you optional consolidation detection. That single feature transforms wave volume from a pure analysis tool into a flexible trading system that adapts to your style.

JOPA Channel (Dual-Volumed) v1 [JopAlgo]JOPA Channel (Dual-Volumed) v1
Short title: JOPAV1 • License: MPL-2.0 • Provider: JopAlgo
We have developed our own, first channel-based trading indicator and we’re making it available to all traders. The goal was a channel that breathes with the tape—built on a volume-weighted backbone—so the outcome stays lively instead of static. That led to the JOPA Channel.
All important features (at a glance)
In one line: A Rolling-VWAP channel whose width adapts with two volumes (RVOL + dollar-flow), adds order-flow asymmetry (OBV tilt) and regime awareness (Efficiency Ratio), and frames risk with outer containment bands from residual extremes—so you see fair value, momentum, and exhaustion in one view.
Feature list
Rolling VWAP centerline: Tracks where volume traded (fair value).
Dual-volume width: Bands expand/contract with relative volume and value traded (price×volume).
OBV tilt: Upper/lower widths skew toward the side actually pushing.
Regime adapter (ER): Tighter in trend, wider in chop—automatically.
Outer containment rails: Residual-extreme ceilings/floors, smoothed + margin.
20% / 80% guides: 20% light blue (discount), 80% light red (premium).
Squeeze dots (optional): Orange circles below candles during compression.
Non-repainting: Uses rolling sums and past-only math; no lookahead.
Default visual in this release
Containment rails + fill: ON (stepline, medium).
Inner Value rails + fill: Rails OFF (stepline, thin), fill ON (drawn only if rails are shown).
20% & 80% guides: ON (dashed, thin; 20% light blue, 80% light red).
Squeeze dots: OFF by default (orange circles when enabled).
What you see on the chart
RVWAP (centerline): Your compass for fair value.
Inner Value Bands (optional): Tight rails for breakouts and pullback timing.
Outer Containment Bands (default ON): High-confidence ceilings/floors for targets and fades.
20% / 80% guides: Quick read of “where in the channel” price is sitting.
Squeeze dots (optional): Volatility compression heads-up (no text labels).
Non-repainting note: The indicator does not revise closed bars. Forecast-Lock uses linear regression to extrapolate 1–3 bars ahead without using future data.
How to use it
Core reads (works on any timeframe)
Bias: Above a rising RVWAP → long bias; below a falling RVWAP → short bias.
Breakouts (momentum): Close beyond an Inner Value rail with RVOL ≥ threshold (alert provided).
Reversions (fades): Tag Outer Containment, stall, then close back inside → expect mean reversion toward RVWAP.
20/80 timing:
At/above 80% (light red) → premium/exhaustion risk; trim longs or consider fades if RVOL cools.
At/below 20% (light blue) → discount/exhaustion risk; trim shorts or consider longs if RVOL cools.
Squeeze clusters: When dots bunch up, expect a range break; use the Breakout alert as confirmation.
Playbooks by trading style
Day Trading (1–5m)
Setup: Keep the chart clean (Containment ON, Value rails OFF). Toggle Inner Value ON when hunting a breakout or timing a pullback.
Pullback Long: Dip to RVWAP / Lower Value with sub-threshold RVOL, then a close back above RVWAP → long.
Stop: Just beyond Lower Containment or the pullback swing.
Targets (1:1:1): ⅓ at RVWAP, ⅓ at Upper Value, ⅓ trail toward Upper Containment.
Breakout Long: After a squeeze cluster, take the Breakout Long alert (close > Upper Value, RVOL ≥ min). If no retest, demand the next bar holds outside.
Range Fade: Only when RVWAP is flat and dots cluster; short Upper Containment → RVWAP (mirror for longs at the lower rail).
Intraday (15m–1H)
HTF compass: Take bias from 4H.
Pullback Long: “Touch & reclaim” of RVWAP while RVOL cools; enter on the reclaim close or break of that candle’s high.
Breakout: Run Inner Value ON; act on Breakout alerts (RVOL gate ≈ 1.10–1.15 typical).
Avoid low-probability fades against the 4H slope unless RVWAP is flat.
Swing (4H–1D)
Continuation: In uptrends, buy pullbacks to RVWAP / Lower Value with sub-threshold RVOL; scale at Upper Containment.
Adds: Post-squeeze Breakout Long adds; trail on RVWAP or Lower Value.
Fades: Prefer when RVWAP flattens and price oscillates between containments.
Position (1D+)
Framework: Daily RVWAP slope + position within containment.
Add rule: Each reclaim of RVWAP after a dip is an add; trim into Upper Containment or near 80% light red.
Sizing: Containment distance is larger—size down and trail on RVWAP.
Inputs & Settings (complete)
Core
Source: Price input for RVWAP.
Rolling VWAP Length: Window of the centerline (higher = smoother).
Volume Baseline (RVOL): SMA window for relative volume.
Inner Value Bands (volatility-based width)
k·StdDev(residuals), k·ATR, k·MAD(residuals): Blend three measures into base width.
StdDev / ATR / MAD Lengths: Lookbacks for each.
Two-Volume Fusion
RVOL Exponent: How aggressively width responds to relative volume.
Dollar-Flow Gain: Adds push from price×volume (value traded).
Dollar-Flow Z-Window: Standardization window for dollar-flow.
Asymmetry (Order-Flow Tilt)
Enable Tilt (OBV): Lets flow skew upper/lower widths.
Tilt Strength (0..1): Gain applied to OBV slope z-score.
OBV Slope Z-Window: Window to standardize OBV slope.
Regime Adapter
Efficiency Ratio Lookback: Measures trend vs chop.
ER Width Min/Max: Maps ER into a width factor (tighter in trend, wider in chop).
Band Tracking (inner value rails)
Tracking Mode:
Base: Pure base rails.
Parallel-Lock: Smooth RVWAP & width; track in parallel.
Slope-Lock: Adds a fraction of recent slope (momentum-friendly).
Forecast-Lock: 1–3 bar extrapolation via linreg (non-repainting on closed bars).
Attach Strength (0..1): Blend tracked rails vs base rails.
Tracking Smooth Length: EMA smoothing of RVWAP and width.
Slope Influence / Forecast Lead Bars: Gains for the chosen mode.
Outer Containment Bands
Show Containment Bands: Master toggle (default ON).
Residual Extremes Lookback: Highest/lowest residual window.
Extreme Smoothing (EMA): Stability on extreme lines.
Margin vs inner width: Extra padding relative to smoothed inner width.
Squeeze & Alerts
Squeeze Window / Threshold: Width vs average; at/under threshold = dot (when enabled).
Min RVOL for Breakout: Required RVOL for breakout alerts.
Style (defaults in this release)
Inner Value rails: OFF (stepline, thin).
Inner & Containment fills: ON.
Containment rails: ON (stepline, medium).
20% / 80% guides: ON — 20% light blue, 80% light red, dashed, thin.
Squeeze dots: OFF by default (orange circles below candles when enabled).
Practical templates (copy/paste into a plan)
Momentum Breakout
Context: Squeeze cluster near RVWAP; Inner Value ON.
Trigger: Breakout Long (close > Upper Value & RVOL ≥ min).
Stop: Below Lower Value (tight) or below RVWAP (safer).
Targets (1:1:1): ⅓ Value → ⅓ Containment → ⅓ trail on RVWAP.
Pullback Continuation
Context: Uptrend; dip to RVWAP / Lower Value with cooling RVOL.
Trigger: Close back above RVWAP or break of reclaim candle’s high.
Stop: Just outside Lower Containment or pullback swing.
Targets: RVWAP → Upper Value → Upper Containment.
Containment Reversion (range)
Context: RVWAP flat; repeated containment tags.
Trigger: Stall at containment, then close back inside.
Stop: A step beyond that containment.
Target: RVWAP; runner only if RVOL stays muted.
Alerts included
DVWAP Breakout Long / Short (Value Bands)
Top Zone / Bottom Zone (20% / 80% guides)
Tip: On lower TFs, act on Breakout alerts with higher-TF bias (e.g., trade 5–15m in the direction of 1H/4H RVWAP slope/position).
Best practices
Let RVWAP be the compass; if unsure, wait until price picks a side.
Respect RVOL; low-RVOL breaks are prone to fail.
Use guides for timing, not certainty. Pair 20/80 zones with flow context.
Start with defaults; change one knob at a time.
Common pitfalls
Fading every containment touch → only fade when RVWAP is flat or RVOL cools.
Over-tuning inputs → the defaults are robust; small tweaks go a long way.
Fighting the higher timeframe on low TFs → expensive habit.
Footer — License & Publishing
License: Mozilla Public License 2.0 (MPL-2.0). You may modify and redistribute; keep this file under MPL and provide source for this file.
Originality: © 2025 JopAlgo. No third-party code reused; Pine built-ins and common formulas only.
Publishing: Keep this header/description intact when releasing on TradingView. Avoid promotional links in the public script text.

Smart MACD Volume Trader# Smart MACD Volume Trader
## Overview
Smart MACD Volume Trader is an enhanced momentum indicator that combines the classic MACD (Moving Average Convergence Divergence) oscillator with an intelligent high-volume filter. This combination significantly reduces false signals by ensuring that trading signals are only generated when price momentum is confirmed by substantial volume activity.
The indicator supports over 24 different instruments including major and exotic forex pairs, precious metals (gold and silver), energy commodities (crude oil, natural gas), and industrial metals (copper). For forex and commodity traders, the indicator automatically maps to CME and COMEX futures contracts to provide accurate institutional-grade volume data.
## Originality and Core Concept
Traditional MACD indicators generate signals based solely on price momentum, which can result in numerous false signals during low-activity periods or ranging markets. This indicator addresses this critical weakness by introducing a volume confirmation layer with automatic institutional volume integration.
**What makes this approach original:**
- Signals are triggered only when MACD crossovers coincide with elevated volume activity
- Implements a lookback mechanism to detect volume spikes within recent bars
- Automatically detects and maps 24+ forex pairs and commodities to their corresponding CME and COMEX futures contracts
- Provides real institutional volume data for forex pairs where spot volume is unreliable
- Combines two independent market dimensions (price momentum and volume) into a single, actionable signal
- Includes intelligent asset detection that works across multiple exchanges and ticker formats
**The underlying principle:** Volume validates price movement. When institutional money enters the market, it creates volume signatures. By requiring high volume confirmation and using actual institutional volume data from futures markets, this indicator filters out weak price movements and focuses on trades backed by genuine market participation. The automatic futures mapping ensures that forex and commodity traders always have access to the most accurate volume data available, without manual configuration.
## How It Works
### MACD Component
The indicator calculates MACD using standard methodology:
1. **Fast EMA (default: 12 periods)** - Tracks short-term price momentum
2. **Slow EMA (default: 26 periods)** - Tracks longer-term price momentum
3. **MACD Line** - Difference between Fast EMA and Slow EMA
4. **Signal Line (default: 9-period SMA)** - Smoothed average of MACD line
**Crossover signals:**
- **Bullish:** MACD line crosses above Signal line (momentum turning positive)
- **Bearish:** MACD line crosses below Signal line (momentum turning negative)
### Volume Filter Component
The volume filter adds an essential confirmation layer:
1. **Volume Moving Average** - Calculates exponential MA of volume (default: 20 periods)
2. **High Volume Threshold** - Multiplies MA by ratio (default: 2.0x or 200%)
3. **Volume Detection** - Identifies bars where current volume exceeds threshold
4. **Lookback Period** - Checks if high volume occurred in recent bars (default: 5 bars)
**Signal logic:**
- Buy/Sell signals only trigger when BOTH conditions are met:
- MACD crossover/crossunder occurs
- High volume detected within lookback period
### Automatic CME Futures Integration
For forex traders, spot FX volume data can be unreliable or non-existent. This indicator solves this problem by automatically detecting forex pairs and mapping them to corresponding CME futures contracts with real institutional volume data.
**Supported Major Forex Pairs (7):**
- EURUSD → CME:6E1! (Euro FX Futures)
- GBPUSD → CME:6B1! (British Pound Futures)
- AUDUSD → CME:6A1! (Australian Dollar Futures)
- USDJPY → CME:6J1! (Japanese Yen Futures)
- USDCAD → CME:6C1! (Canadian Dollar Futures)
- USDCHF → CME:6S1! (Swiss Franc Futures)
- NZDUSD → CME:6N1! (New Zealand Dollar Futures)
**Supported Exotic Forex Pairs (4):**
- USDMXN → CME:6M1! (Mexican Peso Futures)
- USDRUB → CME:6R1! (Russian Ruble Futures)
- USDBRL → CME:6L1! (Brazilian Real Futures)
- USDZAR → CME:6Z1! (South African Rand Futures)
**Supported Cross Pairs (6):**
- EURJPY → CME:6E1! (Uses Euro Futures)
- GBPJPY → CME:6B1! (Uses British Pound Futures)
- EURGBP → CME:6E1! (Uses Euro Futures)
- AUDJPY → CME:6A1! (Uses Australian Dollar Futures)
- EURAUD → CME:6E1! (Uses Euro Futures)
- GBPAUD → CME:6B1! (Uses British Pound Futures)
**Supported Precious Metals (2):**
- Gold (XAUUSD, GOLD) → COMEX:GC1! (Gold Futures)
- Silver (XAGUSD, SILVER) → COMEX:SI1! (Silver Futures)
**Supported Energy Commodities (3):**
- WTI Crude Oil (USOIL, WTIUSD) → NYMEX:CL1! (Crude Oil Futures)
- Brent Oil (UKOIL) → NYMEX:BZ1! (Brent Crude Futures)
- Natural Gas (NATGAS) → NYMEX:NG1! (Natural Gas Futures)
**Supported Industrial Metals (1):**
- Copper (COPPER) → COMEX:HG1! (Copper Futures)
**How the automatic detection works:**
The indicator intelligently identifies the asset type by analyzing:
1. Exchange name (FX, OANDA, TVC, COMEX, NYMEX, etc.)
2. Currency pair pattern (6-letter codes like EURUSD, GBPUSD)
3. Commodity identifiers (XAU for gold, XAG for silver, OIL for crude)
When a supported instrument is detected, the indicator automatically switches to the corresponding futures contract for volume analysis. For stocks, cryptocurrencies, and other assets, the indicator uses the native volume data from the current chart.
**Visual feedback:**
An information table appears in the top-right corner of the MACD pane showing:
- Current chart symbol
- Exchange name
- Currency pair or asset name
- Volume source being used (highlighted in orange for futures, yellow for native volume)
- Current high volume status
This provides complete transparency about which data source the indicator is using for its volume analysis.
## How to Use
### Basic Setup
1. Add the indicator to your chart
2. The indicator displays in a separate pane (MACD) and overlay (signals/volume bars)
3. Default settings work well for most assets, but can be customized
### Signal Interpretation
### Visual Signals
**Visual Signals:**
- **Green "BUY" label** - Bullish MACD crossover confirmed by high volume
- **Red "SELL" label** - Bearish MACD crossunder confirmed by high volume
- **Green/Red candles** - Highlight bars with volume exceeding the threshold
- **Light green/red background** - Emphasizes signal bars on the chart
**Information Table:**
A detailed information table appears in the top-right corner of the MACD pane, providing real-time transparency about the indicator's operation:
- **Chart:** Current symbol being analyzed
- **Exchange:** The exchange or data feed being used
- **Pair:** The currency pair or asset name extracted from the ticker
- **Volume From:** The actual symbol used for volume analysis
- Orange color indicates CME or COMEX futures are being used (automatic institutional volume)
- Yellow color indicates native volume from the chart symbol is being used
- Hover tooltip shows whether automatic futures mapping is active
- **High Volume:** Current status showing YES (green) when volume exceeds threshold, NO (gray) otherwise
This table ensures complete transparency and allows you to verify that the correct volume source is being used for your analysis.
**Volume Analysis:**
- Gray histogram bars = Normal volume
- Red histogram bars = High volume (exceeds threshold)
- Green line = Volume moving average baseline
**MACD Analysis:**
- Blue line = MACD line (momentum indicator)
- Orange line = Signal line (trend confirmation)
- Gray dotted line = Zero line (bullish above, bearish below)
### Parameter Customization
**MACD Parameters:**
- Adjust Fast/Slow EMA lengths for different sensitivities
- Shorter periods = More signals, faster response
- Longer periods = Fewer signals, less noise
**Volume Parameters:**
- **Volume MA Period:** Higher values smooth volume analysis
- **High Volume Ratio:** Lower values (1.5x) = More signals; Higher values (3.0x) = Fewer, stronger signals
- **Volume Lookback Bars:** Controls how recent the volume spike must be
**Direction Filters:**
- **Only Buy Signals:** Enables long-only strategy mode
- **Only Sell Signals:** Enables short-only strategy mode
### Alert Configuration
The indicator includes three alert types:
1. **Buy Signal Alert** - Triggers when bullish signal appears
2. **Sell Signal Alert** - Triggers when bearish signal appears
3. **High Volume Alert** - Triggers when volume exceeds threshold
To set up alerts:
1. Click the indicator name → "Add alert on Smart MACD Volume Trader"
2. Select desired alert condition
3. Configure notification method (popup, email, webhook, etc.)
## Trading Strategy Guidelines
### Best Practices
**Recommended markets:**
- Liquid stocks (large-cap, high daily volume)
- Major forex pairs (EURUSD, GBPUSD, USDJPY, AUDUSD, USDCAD, USDCHF, NZDUSD)
- Exotic forex pairs (USDMXN, USDRUB, USDBRL, USDZAR)
- Cross pairs (EURJPY, GBPJPY, EURGBP, AUDJPY, EURAUD, GBPAUD)
- Precious metals (Gold, Silver with automatic COMEX futures mapping)
- Energy commodities (Crude Oil, Natural Gas with automatic NYMEX futures mapping)
- Industrial metals (Copper with automatic COMEX futures mapping)
- Major cryptocurrency pairs
- Index futures and ETFs
**Timeframe recommendations:**
- **Day trading:** 5-minute to 15-minute charts
- **Swing trading:** 1-hour to 4-hour charts
- **Position trading:** Daily charts
**Risk management:**
- Use signals as entry confirmation, not standalone strategy
- Combine with support/resistance levels
- Consider overall market trend direction
- Always use stop-loss orders
### Strategy Examples
**Trend Following Strategy:**
1. Identify overall trend using higher timeframe (e.g., daily chart)
2. Trade only in trend direction
3. Use "Only Buy" filter in uptrends, "Only Sell" in downtrends
4. Enter on signal, exit on opposite signal or at resistance/support
**Volume Breakout Strategy:**
1. Wait for consolidation period (low volume, tight MACD range)
2. Enter when signal appears with high volume (confirms breakout)
3. Target previous swing highs/lows
4. Stop loss below/above recent consolidation
**Forex Scalping Strategy (with automatic CME futures):**
1. The indicator automatically detects forex pairs and uses CME futures volume
2. Trade during active sessions only (use session filter)
3. Focus on quick profits (10-20 pips)
4. Exit at opposite signal or profit target
**Commodities Trading Strategy (Gold, Silver, Oil):**
1. The indicator automatically maps to COMEX and NYMEX futures contracts
2. Trade during high-liquidity sessions (overlap of major markets)
3. Use the high volume confirmation to identify institutional entry points
4. Combine with key support and resistance levels for entries
5. Monitor the information table to confirm futures volume is being used (orange color)
6. Exit on opposite MACD signal or at predefined profit targets
## Why This Combination Works
### The Volume Advantage
Studies consistently show that price movements accompanied by high volume are more likely to continue, while low-volume movements often reverse. This indicator leverages this principle by requiring volume confirmation.
**Key benefits:**
1. **Reduced False Signals:** Eliminates MACD whipsaws during low-volume consolidation
2. **Confirmation Bias:** Two independent indicators (price momentum + volume) agreeing
3. **Institutional Alignment:** High volume often indicates institutional participation
4. **Trend Validation:** Volume confirms that price momentum has "conviction"
### Statistical Edge
By combining two uncorrelated signals (MACD crossovers and volume spikes), the indicator creates a higher-probability setup than either signal alone. The lookback mechanism ensures signals aren't missed if volume spike slightly precedes the MACD cross.
## Supported Exchanges and Automatic Detection
The indicator includes intelligent asset detection that works across multiple exchanges and ticker formats:
**Forex Exchanges (Automatic CME Mapping):**
- FX (TradingView forex feed)
- OANDA
- FXCM
- SAXO
- FOREXCOM
- PEPPERSTONE
- EASYMARKETS
- FX_IDC
**Commodity Exchanges (Automatic COMEX/NYMEX Mapping):**
- TVC (TradingView commodity feed)
- COMEX (directly)
- NYMEX (directly)
- ICEUS
**Other Asset Classes (Native Volume):**
- Stock exchanges (NASDAQ, NYSE, AMEX, etc.)
- Cryptocurrency exchanges (BINANCE, COINBASE, KRAKEN, etc.)
- Index providers (SP, DJ, etc.)
The detection algorithm analyzes three factors:
1. Exchange prefix in the ticker symbol
2. Pattern matching for currency pairs (6-letter codes)
3. Commodity identifiers in the symbol name
This ensures accurate automatic detection regardless of which data feed or exchange you use for charting. The information table in the top-right corner always displays which volume source is being used, providing complete transparency.
## Technical Details
**Calculations:**
- MACD Fast MA: EMA(close, fastLength)
- MACD Slow MA: EMA(close, slowLength)
- MACD Line: Fast MA - Slow MA
- Signal Line: SMA(MACD Line, signalLength)
- Volume MA: Exponential MA of volume
- High Volume: Current volume >= Volume MA × Ratio
**Signal logic:**
```
Buy Signal = (MACD crosses above Signal) AND (High volume in last N bars)
Sell Signal = (MACD crosses below Signal) AND (High volume in last N bars)
```
## Parameters Reference
| Parameter | Default | Description |
|-----------|---------|-------------|
| Volume Symbol | Blank | Manual override for volume source (leave blank for automatic detection) |
| Use CME Futures | False | Legacy option (automatic detection is now built-in) |
| Alert Session | 1530-2200 | Active session time range for alerts |
| Timezone | UTC+1 | Timezone for alert sessions |
| Volume MA Period | 20 | Number of periods for volume moving average |
| High Volume Ratio | 2.0 | Volume threshold multiplier (2.0 = 200% of average) |
| Volume Lookback | 5 | Number of bars to check for high volume confirmation |
| MACD Fast Length | 12 | Fast EMA period for MACD calculation |
| MACD Slow Length | 26 | Slow EMA period for MACD calculation |
| MACD Signal Length | 9 | Signal line SMA period |
| Only Buy | False | Filter to show only bullish signals |
| Only Sell | False | Filter to show only bearish signals |
| Show Signals | True | Display buy and sell labels on chart |
## Optimization Tips
**For volatile markets (crypto, small caps):**
- Increase High Volume Ratio to 2.5-3.0
- Reduce Volume Lookback to 3-4 bars
- Consider faster MACD settings (8, 17, 9)
**For stable markets (large-cap stocks, bonds):**
- Decrease High Volume Ratio to 1.5-1.8
- Increase Volume MA Period to 30-50
- Use standard MACD settings
**For forex (with automatic CME futures):**
- The indicator automatically uses CME futures when forex pairs are detected
- Set appropriate trading session based on your timezone
- Use Volume Lookback of 5-7 bars
- Consider session-based alerts only
- Monitor the information table to verify correct futures mapping
**For commodities (Gold, Silver, Oil, Copper):**
- The indicator automatically maps to COMEX and NYMEX futures
- Increase High Volume Ratio to 2.0-2.5 for metals
- Use slightly higher Volume MA Period (25-30) for smoother analysis
- Trade during active market hours for best volume data
- The information table will show the futures contract being used (orange highlight)
## Limitations and Considerations
**What this indicator does NOT do:**
- Does not predict future price direction
- Does not guarantee profitable trades
- Does not replace proper risk management
- Does not work well in extremely low-volume conditions
**Market conditions to avoid:**
- Pre-market and after-hours sessions (low volume)
- Major news events (volatile, unpredictable volume)
- Holidays and low-liquidity periods
- Extremely low float stocks
## Conclusion
Smart MACD Volume Trader represents a significant evolution of the traditional MACD indicator by combining volume confirmation with automatic institutional volume integration. This dual-confirmation approach significantly improves signal quality by filtering out low-conviction price movements and ensuring traders work with accurate volume data.
The indicator's automatic detection and mapping system supports over 24 instruments across forex, commodities, and metals markets. By intelligently switching to CME and COMEX futures contracts when appropriate, the indicator provides forex and commodity traders with the same quality of volume data that stock traders naturally have access to.
This indicator is particularly valuable for traders who want to:
- Align their entries with institutional money flow
- Avoid getting trapped in false breakouts
- Trade forex pairs with reliable volume data
- Access accurate volume information for gold, silver, and energy commodities
- Combine momentum and volume analysis in a single, streamlined tool
Whether you are day trading stocks, swing trading forex pairs, or positioning in commodities markets, this indicator provides a robust framework for identifying high-probability momentum trades backed by genuine institutional participation. The automatic futures mapping works seamlessly across all supported instruments, requiring no manual configuration or expertise in futures markets.
---
## Support and Updates
This indicator is actively maintained and updated based on user feedback and market conditions. For questions about implementation or custom modifications, please use the comments section below.
**Disclaimer:** This indicator is for educational and informational purposes only. Past performance does not guarantee future results. Always conduct your own analysis and risk management before trading.

ten2 Cipher v.1Created and built by ten2crypto
This is not just another "Market Cipher" clone. This is my personal, ground-up build of a comprehensive momentum and divergence toolkit, designed to provide a deeper, more nuanced view of the market. The ten2 Cipher Divergence Engine combines the best aspects of classic momentum oscillators with a powerful, multi-layered divergence system.
This indicator was built for my own trading and is now being shared with the community.
OBTrendDelta Volume Delta & Order Block SuiteOB Trend Delta V1 - Order Block & Volume Delta Indicator
━━━━━━━━━━━━━━━━━━━━━━━━━━━━━━━━━━━━━━━━━━━━━━━━━━━━━━━━━━━━━━━━━━━━━━
📊 OVERVIEW
OB Trend Delta V1 is a technical indicator that combines Order Blocks analysis (institutional support/resistance zones) with Volume Delta (buying vs selling pressure) to provide insights on setup quality and market dynamics.
The indicator visually displays zones of interest, volume pressure, and a quality scoring system to assist in technical analysis of any market.
━━━━━━━━━━━━━━━━━━━━━━━━━━━━━━━━━━━━━━━━━━━━━━━━━━━━━━━━━━━━━━━━━━━━━━━
🎯 CORE CONCEPT
▸ ORDER BLOCKS
Order Blocks are price zones where large institutions executed significant operations. These areas tend to act as support (Bull OB) or resistance (Bear OB) when price returns to them.
How to interpret:
🟢 Bull Order Block: Green zone where institutional buyers entered strongly → Potential support
🔴 Bear Order Block: Red zone where institutional sellers entered strongly → Potential resistance
▸ VOLUME DELTA
Volume Delta measures the difference between buying and selling volume in each candle, revealing which side of the market is dominating.
How to interpret:
✅ Positive Delta (green histogram): Buyers dominating → Bullish pressure
❌ Negative Delta (red histogram): Sellers dominating → Bearish pressure
━━━━━━━━━━━━━━━━━━━━━━━━━━━━━━━━━━━━━━━━━━━━━━━━━━━━━━━━━━━━━━━━━━━━━━
📈 WHAT THE INDICATOR SHOWS
1️⃣ TREND DETECTION
The indicator identifies the main market direction using moving averages and trend strength analysis (ADX), visually highlighting when the market is in:
Uptrend (Bullish Trend)
Downtrend (Bearish Trend)
Ranging (Sideways market/no clear trend)
2️⃣ SETUP QUALITY SYSTEM
Each trading opportunity is evaluated on 6 independent criteria:
✅ Price inside a valid Order Block
✅ Volume Delta confirming the direction
✅ Order Block is recent and "fresh"
✅ Few previous retests (OB still strong)
✅ Volume confirmation above average
✅ Favorable market regime
Setup Quality Score: 0 to 6 points
Score 6: Perfect setup (all criteria met)
Score 5: Excellent setup (5 of 6 criteria)
Score 4: Good setup (4 of 6 criteria)
Score 0-3: Weak setup or forming
━━━━━━━━━━━━━━━━━━━━━━━━━━━━━━━━━━━━━━━━━━━━━━━━━━━━━━━━━━━━━━━━━━━━━━━
🔧 VISUAL COMPONENTS IN THE INDICATOR
▸ VOLUME DELTA HISTOGRAM
🟢 Green Bars: Buying volume > selling volume (bullish pressure)
🔴 Red Bars: Selling volume > buying volume (bearish pressure)
📊 Intensity: The larger the bar, the greater the pressure
▸ ORDER BLOCK ZONES
🟢 Green Boxes (Bull OB): Institutional support zones
🔴 Red Boxes (Bear OB): Institutional resistance zones
🔄 Projection: OBs are extended to the right until invalidated
▸ SETUP QUALITY SIGNALS
📊 Score Labels: Show setup quality (Q4, Q5, Q6)
• Q6: Perfect setup (all 6 criteria met)
• Q5: Excellent setup (5 of 6 criteria)
• Q4: Good setup (4 of 6 criteria)
━━━━━━━━━━━━━━━━━━━━━━━━━━━━━━━━━━━━━━━━━━━━━━━━━━━━━━━━━━━━━━━━━━━━━━
💡 HOW TO INTERPRET THE INFORMATION
Observe trend direction (EMAs and ADX)
Identify active Order Blocks:
• Bull OBs (green): Potential support zones
• Bear OBs (red): Potential resistance zones
Analyze Volume Delta:
• Green bars: Dominant buying pressure
• Red bars: Dominant selling pressure
Check Setup Quality Score:
• Q5-Q6: Setups with multiple confirmations
• Q4: Setup with moderate confirmations
• Q0-Q3: Few criteria met
⚠️ NOTE: The indicator provides technical information. Trading decisions are exclusively yours.
━━━━━━━━━━━━━━━━━━━━━━━━━━━━━━━━━━━━━━━━━━━━━━━━━━━━━━━━━━━━━━━━━━━━━━━
📊 TECHNICAL CHARACTERISTICS
▸ RECOMMENDED TIMEFRAMES
5 minutes: Scalping / Fast day trading
15 minutes: Day trading
1 hour: Swing trading
4 hours: Medium-term positions
Daily: Long-term analysis
▸ COMPATIBLE MARKETS
✅ Forex (all pairs)
✅ Cryptocurrencies (BTC, ETH, altcoins)
✅ Indices (S&P500, Nasdaq, etc)
✅ Commodities (Gold, Oil, etc)
✅ Stocks and CFDs
⚠️ Requirement: Volume data is necessary for Volume Delta calculation
━━━━━━━━━━━━━━━━━━━━━━━━━━━━━━━━━━━━━━━━━━━━━━━━━━━━━━━━━━━━━━━━━━━━━━━
⚠️ IMPORTANT WARNINGS
▸ EDUCATIONAL USE
📊 This indicator is an educational technical analysis tool
⚠️ The indicator does NOT provide buy or sell signals
⚠️ The indicator does NOT guarantee results
⚠️ All trading decisions are your responsibility
▸ RISK MANAGEMENT
⚠️ Always use proper risk management
⚠️ Never trade with money you cannot afford to lose
⚠️ Test the indicator on a demo account before using real money
⚠️ Combine with your own analysis and strategy
▸ LIMITATIONS
❌ No indicator is 100% accurate
❌ Markets can behave unpredictably
❌ Requires confirmation with other analyses
❌ Volume Delta requires reliable volume data
▸ DISCLAIMER
📢 This indicator is educational and does not constitute investment advice.
The indicator shows technical information, not trading signals
Past results do not guarantee future results
Trading involves risk of total capital loss
You are 100% responsible for your trading decisions
Consult a financial professional before investing
━━━━━━━━━━━━━━━━━━━━━━━━━━━━━━━━━━━━━━━━━━━━━━━━━━━━━━━━━━━━━━━━━━━━━━━
📚 ADVANCED CONCEPTS
▸ WHAT ARE ORDER BLOCKS?
Order Blocks represent zones where "smart money" (institutions, whales) accumulated or distributed positions. When price returns to these zones, there is high probability of reaction due to:
Pending limit orders
Psychological levels
Institutional value zones
▸ VOLUME DELTA VS NORMAL VOLUME
Normal volume shows only QUANTITY of trades.
Volume Delta shows DIRECTION (who is winning the battle):
High volume + Positive delta = Strong accumulation 🚀
High volume + Negative delta = Strong distribution 📉
▸ MARKET REGIME (ADX)
ADX measures TREND STRENGTH:
ADX > 25: Strong trend (best time to trade)
ADX < 20: Sideways/ranging market (avoid trades)
━━━━━━━━━━━━━━━━━━━━━━━━━━━━━━━━━━━━━━━━━━━━━━━━━━━━━━━━━━━━━━━━━━━━━━━
✅ BEFORE USING THIS INDICATOR
Make sure you:
☑ Understand the Order Blocks concept
☑ Know how to interpret Volume Delta
☑ Understand trend analysis
☑ Have your own trading strategy
☑ Know risk management
☑ Understand the indicator does NOT provide buy/sell signals
☑ Are aware of trading risks
☑ Test on demo account before using real money
━━━━━━━━━━━━━━━━━━━━━━━━━━━━━━━━━━━━━━━━━━━━━━━━━━━━━━━━━━━━━━━━━━━━━━━
📊 USE AS AN ANALYSIS TOOL, NOT AS AN AUTOMATIC DECISION SYSTEM!
The indicator provides information. You make the decisions.
―――――――――――――――――――――――――――――――――――――――――
Version: 1.0 | Type: Order Block + Volume Delta + Trend Analysis | Update: October 2024

Kei_VWAP_EMA_PublicENGLISH (for TradingView description)
Kei_VWAP_EMA_Public — VWAP + EMA(9/21) with optional “blue +” reclaim signals (JP 5m ready)
What it does
Overlays VWAP and EMA 9/21.
Optional blue “+” markers when price reclaims VWAP and EMA9 > EMA21 (momentum resume).
Optional volume confirmation (e.g., ×1.2 of the 5-bar average).
Optional manual POC band “+” (enter your POC level and a small band to show bounce attempts).
Optional 9:30 JST vertical line for Japan cash open routine.
Why
Keep you out of the noise zone and focus on two repeatable setups:
VWAP Reclaim (trend), 2) POC Bounce (mean-revert).
How to use (playbook, 5-min tuned)
Timeframe: 5m (works 1–15m).
VWAP Reclaim “+”: consider a buy stop above the signal bar’s high.
TP1 ≈ +1×ATR, TP2 ≈ +2×ATR; SL = EMA21 break or VWAP failure.
If it doesn’t progress within 10–15 minutes, consider a time stop.
POC Bounce “+”: enable in inputs, set POC level and band (e.g., ±3). Aim for quick pop to EMA9 → VWAP.
Risk guardrails: no averaging-down, always OCO, daily loss cap ≈ 0.8% of total active trading equity (JP+US combined).
Inputs
Show VWAP / EMA9 / EMA21, Line width
Show blue “+” markers, Require volume boost, Volume multiplier
Enable POC band “+”, POC level, POC band width
Show 9:30 line (JP)
Notes
This is the PUBLIC / visual version—no alerts or risk logic. A private Pro version with alerts exists for personal use.
Educational use only — not financial advice.
日本語(TradingView説明文)
Kei_VWAP_EMA_Public — VWAPとEMA(9/21)+「青+」シグナル(5分足チューニング)
機能
VWAP と EMA9/EMA21 を表示。
価格がVWAPを再奪回し、かつ EMA9>EMA21 のときに**「青+」**を表示(モメンタム再点火)。
任意で出来高ブースト条件(5本平均の×1.2など)を追加可能。
任意でPOC反発の「青+」(POC価格と許容帯を手入力)。
9:30(日本時間) の縦ラインを任意表示。
狙い
ノイズ帯での新規を避け、
VWAP奪回の順張り、2) POC反発の逆張り短距離、の2セットアップに集中。
使い方(5分足想定)
VWAP奪回「青+」:シグナル足の高値上に買いストップを置く案。
TP1= +1×ATR、TP2= +2×ATR/SL= EMA21割れやVWAP失敗。
10–15分で進展がない場合は時間損切も検討。
POC反発「青+」:入力でPOCを設定、バンド(±3など)内の下ヒゲ+出来高↑でEMA9→VWAP手前までの短距離狙い。
リスク管理:平均値下げ禁止、常時OCO、日次ドローダウン上限は**合算0.8%**目安(日本株+米株のアクティブ資金)。
入力項目
VWAP/EMA9/EMA21の表示、線幅
「青+」表示、出来高ブーストON/OFF、倍率
POC反発ON/OFF、POCレベル、バンド幅
9:30ライン表示
注意
これは公開用のライト版です(アラート/リスクロジックは未搭載)。実運用は非公開のPro版で行っています。
※投資助言ではありません。自己責任でご利用ください。

Cumulative Hybrid Delta# 📊 CUMULATIVE HYBRID DELTA
## The Most Advanced Volume Delta Indicator for Crypto & Forex Traders
---
## WHAT IS IT?
**Cumulative Hybrid Delta** reveals **who is in control of the market** — buyers or sellers — in real-time. By analyzing volume imbalances and their accumulation over time, this indicator detects market pressure before price moves, giving you the edge you need.
**Stop guessing the market's direction. Start seeing it.**
---
## WHAT IT SHOWS
### 🟢 Buying Pressure
Green signals indicate accumulated buyer dominance. Watch for rising green accumulation in downtrends for reversal opportunities.
### 🔴 Selling Pressure
Red signals show accumulated seller control. Perfect for catching trend exhaustion and potential corrections.
### 💛 Cumulative Delta Line (Yellow)
The heart of the indicator. This line accumulates all delta pressure over your selected period. Rising = bullish momentum building. Falling = bearish pressure intensifying.
### 📊 Delta Bars
Individual bar pressure shown as histogram. Each bar tells you the exact buy/sell imbalance for that candle. Track momentum strength in real-time.
### 🕯️ Wick Analysis
Upper wicks show rejected resistance (seller pressure). Lower wicks reveal bounces from support (buyer pressure). Critical for spotting reversals before they happen.
### ⚡ Extreme Zones (Red & Green Lines)
Auto-calculated overbought and oversold levels. When delta enters these zones, market reversal becomes highly probable. Perfect for taking profits or entering counter-trades.
---
## WHY TRADERS LOVE IT
✅ **5 Hybrid Algorithms** - Switch between different delta calculation methods (Price Position, Wick-Corrected, Close-Open Ratio, Classic, or Full Hybrid)
✅ **Adaptive Technology** - Works perfectly on ANY timeframe and market condition (calm days, volatile days, crypto rallies, forex ranges)
✅ **Spot & Futures Ready** - Whether you trade Bitcoin spot on Binance or micro contracts, this indicator adapts seamlessly
✅ **Real-Time Alerts** - 5 automated alerts catch key turning points so you never miss a setup
✅ **Professional Dashboard** - Live metrics table shows bar delta, cumulative delta, wicks, zone status, and trend at a glance
✅ **Bilingual** - English and Russian interface. Switch languages in settings instantly
✅ **No Repainting** - Calculated from pure OHLCV data. Reliable backtesting. No fake signals
---
## KEY SETTINGS EXPLAINED
### 🧠 DELTA ALGORITHM (Core Feature)
- **Hybrid** (Recommended) - Combines price position (70%) + wick analysis (30%) for maximum accuracy
- **Price Position** - Pure price location in the range (simple & effective)
- **Wick Corrected** - Focuses on rejected pressure (great for reversals)
- **Close-Open** - Traditional bar momentum
- **Classic** - Standard fixed ratio method
### 📊 AGGREGATION TYPE
- **Sum** (Default) - Total delta over period (best for signals)
- **SMA** - Smoothed average (cleaner chart)
- **EMA** - Exponential weighted (faster response)
- **Cumulative** - Pure running total (academic analysis)
### 🤖 ADAPTIVE MODES
- **ATR-Based** (Recommended) - Adjusts to volatility using Average True Range
- **Volatility-Based** - Uses standard deviation for adaptation
- **Range-Based** - Adjusts to candle size
**Why adaptive?** Because a signal on a calm day is different from a signal on an explosive rally. The indicator learns your market and adapts automatically.
### ⚡ CUSTOMIZATION
- Change all colors to match your chart theme
- Adjust zone sensitivity (manual or auto)
- Choose number format (K, M, B notation or full numbers)
- Display in USD or volume units
- Pick table position (9 locations available)
- Set font size (tiny to huge)
---
## WHAT YOU GET AT A GLANCE
**The Live Metrics Table Shows:**
- Current bar delta (buy vs sell pressure RIGHT NOW)
- Cumulative delta (accumulated pressure over time)
- Delta % (strength of pressure as a percentage)
- Upper wick (rejected resistance)
- Lower wick (bounces from support)
- Adaptive coefficient (volatility multiplier)
- Zone status (OVERBOUGHT / NORMAL / OVERSOLD)
- Trend direction (RISING / FALLING / FLAT)
**All updated in real-time. All on one clean dashboard.**
---
## THE 5 TRADING SIGNALS
1. **Zero Cross Alert** - Cumulative delta crosses zero = momentum shift detected
2. **Overbought Alert** - Enters red zone = buyers exhausted, sell signal
3. **Oversold Alert** - Enters green zone = sellers exhausted, buy signal
4. **Bullish Delta** - Bar delta turns positive = buying starts
5. **Bearish Delta** - Bar delta turns negative = selling starts
**Each alert can trigger notifications on your phone. Never miss a setup again.**
---
## WHO SHOULD USE THIS?
✅ **Crypto Traders** - Bitcoin, Ethereum, Altcoins (spot and futures)
✅ **Forex Traders** - EUR/USD, GBP/USD, and all pairs
✅ **Scalpers** - 1m-5m timeframes with instant alerts
✅ **Day Traders** - 15m-1h for quick reversals and continuations
✅ **Swing Traders** - 4h-1d for major trend changes
✅ **Position Traders** - Weekly/monthly for macro reversals
**Works on all timeframes. All markets. All strategies.**
---
## WHAT MAKES IT DIFFERENT?
While 99% of volume indicators just show raw volume, **Cumulative Hybrid Delta** does something revolutionary:
- It separates BUYING volume from SELLING volume with precision
- It accumulates this pressure to show market intention
- It adapts to your specific market and timeframe
- It alerts you to extremes before they reverse
- It works on crypto, forex, stocks, futures — everything
**This is what institutional traders pay thousands for. Now it's free.**
---
## QUICK START
1. Add to chart (search "Cumulative Hybrid Delta" on TradingView)
2. Open settings
3. Choose your algorithm (recommend starting with "Hybrid")
4. Set your timeframe
5. Watch the magic happen
**First signal comes within minutes. First reversal catch comes today.**
---
## PROVEN ON
✅ Bitcoin (1m, 5m, 15m, 1h, 4h, 1d)
✅ Altcoins (Ethereum, Solana, XRP, and 100+ pairs)
✅ Forex (EURUSD, GBPUSD, GOLD, CRYPTO pairs)
✅ All exchanges (Binance, OKX, Bybit, Coinbase, Kraken)
✅ All market conditions (bullish, bearish, ranging, volatile)
---
## START TRADING SMARTER TODAY
Stop trading blind. Stop guessing market direction.
**Cumulative Hybrid Delta** shows you exactly where the power is. Whether buyers or sellers are winning. When reversals are coming. When to enter. When to take profit.
**Download now. Change your trading forever.**
---
## FEATURES SNAPSHOT
| Feature | Details |
|---------|---------|
| **Algorithms** | 5 professional delta calculation methods |
| **Timeframes** | 1m to 1M (all supported) |
| **Markets** | Crypto, Forex, Stocks, Futures, Commodities |
| **Alerts** | 5 automated trading signals |
| **Adaptation** | 3 automatic market-condition adjustments |
| **Languages** | English & Russian |
| **Customization** | 50+ adjustable settings |
| **Dashboard** | 9-metric live table with zone status |
| **Colors** | Fully customizable to match any chart |
| **Performance** | Zero repainting, pure OHLCV calculation |
---
---
## READY TO DOMINATE?
**Your edge is waiting.**
This indicator gives professional-grade volume analysis at zero cost. Institutional traders charge thousands for this insight. You get it free.
**Download Cumulative Hybrid Delta now and see what professional traders see.**
---
*Cumulative Hybrid Delta - Where Smart Money Meets Retail Traders*
**Available exclusively on TradingView. Free. Forever. No subscription. No hidden costs.**

Hello Crypto! Modern Combo Snapshot
Unified long/short analyzer blending EMA structure, SuperTrend, WaveTrend, QQE, and volume pressure.
Background shading flags “watch” and “ready” states; optional long/short modules let you focus on one side.
Alerts fire when every checklist item aligns, while the side-panel table summarizes trend, momentum, liquidity, and overall score in real time.
Indicator → Trend Analysis
Indicator → Momentum Oscillators
Indicator → Volume Indicators
Tags:
cryptocurrency, bitcoin, altcoins, trend-following, momentum, volume, ema, supertrend, intraday, swing-trading, alerts, checklist, trading-strategy, risk-management

LANZ Origins🔷 LANZ Origins – Multi-Framework Liquidity, Structure & Risk Management Overlay
LANZ Origins is an advanced multi-framework visualization toolkit that unifies key institutional concepts into one efficient interface. Designed for professional traders, it merges session mapping, liquidity analysis, imbalance detection, multi-account risk control, and higher-timeframe candle tracing — all in a single overlay.
🧩 Core Components
🈵 Asian Range Liquidity
Automatically detects and projects the Asian session range (19:00–02:00 NY) with an optional mid-price line (50 %). This provides visual context for intraday liquidity and manipulation zones commonly referenced in ICT-style analysis.
📊 Imbalance Detector
Highlights Fair Value Gaps (FVG), Opening Gaps (OG), and Volume Imbalances (VI) directly on-chart, using separate color schemes for bullish and bearish inefficiencies. Each element can be customized by width, ATR filter, and extension length.
🕯️ Higher-Timeframe Candles (ICT Style)
Displays multi-timeframe candles (HTF1–HTF6) simultaneously — e.g., 5 m, 30 m, 1 h, 4 h, 1 D, 1 W — each rendered with independent wick, border, and fill settings. Includes remaining-time counters, timeframe labels, and optional imbalance shading between bodies.
📈 Market Structure (ZigZag 30 m)
Replicates 30-minute swing structure to all active timeframes, producing dynamic pivots with live extension. Ideal for contextualizing BOS/CHoCH events across multiple scales.
💸 Multi-Account Lot Size Panel
Calculates position size for up to five accounts simultaneously, using your defined capital, risk %, and fixed SL distance (in pips). Results appear in a clean table at the bottom-right corner of the chart.
🎨 Session Visualization
Colored backgrounds mark key trading phases:
🟢 Day division
🔴 No-action zone
🔵 Kill-zone
🟡 Hold session
⚙️ Customization & Performance
Every module can be toggled individually, with full color, opacity, and style control. The script is optimized for overlay use and supports up to 500 boxes, lines, and labels with efficient resource handling.
🧠 Best Use Case
LANZ Origins is ideal for traders who follow:
Smart Money Concepts / ICT methodology
Liquidity & Imbalance-based trading
Multi-timeframe confluence setups
Risk-based position sizing workflows
Use it to observe how price interacts with liquidity pools, higher-timeframe candles, and imbalances within key sessions — while monitoring lot size risk in real time.
📌 Recommended Setup
Timeframes: 30m - 5m – 3m
Pairs: FX
Session Timezone: New York (EST/EDT)
Combine with: LANZ Strategy series for execution and journaling
💬 Note
This indicator does not generate buy/sell signals. It’s a visual and analytical tool built to support your own decision-making process.

Volume Surprise [LuxAlgo]The Volume Surprise tool displays the trading volume alongside the expected volume at that time, allowing users to spot unexpected trading activity on the chart easily.
The tool includes an extrapolation of the estimated volume for future periods, allowing forecasting future trading activity.
🔶 USAGE
We define Volume Surprise as a situation where the actual trading volume deviates significantly from its expected value at a given time.
Being able to determine if trading activity is higher or lower than expected allows us to precisely gauge the interest of market participants in specific trends.
A histogram constructed from the difference between the volume and expected volume is provided to easily highlight the difference between the two and may be used as a standalone.
The tool can also help quantify the impact of specific market events, such as news about an instrument. For example, an important announcement leading to volume below expectations might be a sign of market participants underestimating the impact of the announcement.
Like in the example above, it is possible to observe cases where the volume significantly differs from the expected one, which might be interpreted as an anomaly leading to a correction.
🔹 Detecting Rare Trading Activity
Expected volume is defined as the mean (or median if we want to limit the impact of outliers) of the volume grouped at a specific point in time. This value depends on grouping volume based on periods, which can be user-defined.
However, it is possible to adjust the indicator to overestimate/underestimate expected volume, allowing for highlighting excessively high or low volume at specific times.
In order to do this, select "Percentiles" as the summary method, and change the percentiles value to a value that is close to 100 (overestimate expected volume) or to 0 (underestimate expected volume).
In the example above, we are only interested in detecting volume that is excessively high, we use the 95th percentile to do so, effectively highlighting when volume is higher than 95% of the volumes recorded at that time.
🔶 DETAILS
🔹 Choosing the Right Periods
Our expected volume value depends on grouping volume based on periods, which can be user-defined.
For example, if only the hourly period is selected, volumes are grouped by their respective hours. As such, to get the expected volume for the hour 7 PM, we collect and group the historical volumes that occurred at 7 PM and average them to get our expected value at that time.
Users are not limited to selecting a single period, and can group volume using a combination of all the available periods.
Do note that when on lower timeframes, only having higher periods will lead to less precise expected values. Enabling periods that are too low might prevent grouping. Finally, enabling a lot of periods will, on the other hand, lead to a lot of groups, preventing the ability to get effective expected values.
In order to avoid changing periods by navigating across multiple timeframes, an "Auto Selection" setting is provided.
🔹 Group Length
The length setting allows controlling the maximum size of a volume group. Using higher lengths will provide an expected value on more historical data, further highlighting recurring patterns.
🔹 Recommended Assets
Obtaining the expected volume for a specific period (time of the day, day of the week, quarter, etc) is most effective when on assets showing higher signs of periodicity in their trading activity.
This is visible on stocks, futures, and forex pairs, which tend to have a defined, recognizable interval with usually higher trading activity.
Assets such as cryptocurrencies will usually not have a clearly defined periodic trading activity, which lowers the validity of forecasts produced by the tool, as well as any conclusions originating from the volume to expected volume comparisons.
🔶 SETTINGS
Length: Maximum number of records in a volume group for a specific period. Older values are discarded.
Smooth: Period of a SMA used to smooth volume. The smoothing affects the expected value.
🔹 Periods
Auto Selection: Automatically choose a practical combination of periods based on the chart timeframe.
Custom periods can be used if disabling "Auto Selection". Available periods include:
- Minutes
- Hours
- Days (can be: Day of Week, Day of Month, Day of Year)
- Months
- Quarters
🔹 Summary
Method: Method used to obtain the expected value. Options include Mean (default) or Percentile.
Percentile: Percentile number used if "Method" is set to "Percentile". A value of 50 will effectively use a median for the expected value.
🔹 Forecast
Forecast Window: Number of bars ahead for which the expected volume is predicted.
Style: Style settings of the forecast.

Pivot Regime Anchored VWAP [CHE] Pivot Regime Anchored VWAP — Detects body-based pivot regimes to classify swing highs and lows, anchoring volume-weighted average price lines directly at higher highs and lower lows for adaptive reference levels.
Summary
This indicator identifies shifts between top and bottom regimes through breakouts in candle body highs and lows, labeling swing points as higher highs, lower highs, lower lows, or higher lows. It then draws anchored volume-weighted average price lines starting from the most recent higher high and lower low, providing dynamic support and resistance that evolve with volume flow. These anchored lines differ from standard volume-weighted averages by resetting only at confirmed swing extremes, reducing noise in ranging markets while highlighting momentum shifts in trends.
Motivation: Why this design?
Traders often struggle with static reference lines that fail to adapt to changing market structures, leading to false breaks in volatile conditions or missed continuations in trends. By anchoring volume-weighted average price calculations to body pivot regimes—specifically at higher highs for resistance and lower lows for support—this design creates reference levels tied directly to price structure extremes. This approach addresses the problem of generic moving averages lagging behind swing confirmations, offering a more context-aware tool for intraday or swing trading.
What’s different vs. standard approaches?
- Baseline reference: Traditional volume-weighted average price indicators compute a running total from session start or fixed periods, often ignoring price structure.
- Architecture differences:
- Regime detection via body breakout logic switches between high and low focus dynamically.
- Anchoring limited to confirmed higher highs and lower lows, with historical recalculation for accurate line drawing.
- Polyline rendering rebuilds only on the last bar to manage performance.
- Practical effect: Charts show fewer, more meaningful lines that start at swing points, making it easier to spot confluences with structure breaks rather than cluttered overlays from continuous calculations.
How it works (technical)
The indicator first calculates the maximum and minimum of each candle's open and close to define body highs and lows. It then scans a lookback window for the highest body high and lowest body low. A top regime triggers when the body high from the lookback period exceeds the window's highest, and a bottom regime when the body low falls below the window's lowest. These regime shifts confirm pivots only when crossing from one state to the other.
For top pivots, it compares the new body high against the previous swing high: if greater, it marks a higher high and anchors a new line; otherwise, a lower high. The same logic applies inversely for bottom pivots. Anchored lines use cumulative price-volume products and volumes from the anchor bar onward, subtracting prior cumulatives to isolate the segment. On pivot confirmation, it loops backward from the current bar to the anchor, computing and storing points for the line. New points append as bars advance, ensuring the line reflects ongoing volume weighting.
Initialization uses persistent variables to track the last swing values and anchor bars, starting with neutral states. Data flows from regime detection to pivot classification, then to anchoring and point accumulation, with lines rendered globally on the final bar.
Parameter Guide
Pivot Length — Controls the lookback window for detecting body breakouts, influencing pivot frequency and sensitivity to recent action. Shorter values catch more pivots in choppy conditions; longer smooths for major swings. Default: 30 (bars). Trade-offs/Tips: Min 1; for intraday, try 10–20 to reduce lag but watch for noise; on daily, 50+ for stability.
Show Pivot Labels — Toggles display of text markers at swing points, aiding quick identification of higher highs, lower highs, lower lows, or higher lows. Default: true. Trade-offs/Tips: Disable in multi-indicator setups to declutter; useful for backtesting structure.
HH Color — Sets the line and label color for higher high anchored lines, distinguishing resistance levels. Default: Red (solid). Trade-offs/Tips: Choose contrasting hues for dark/light themes; pair with opacity for fills if added later.
LL Color — Sets the line and label color for lower low anchored lines, distinguishing support levels. Default: Lime (solid). Trade-offs/Tips: As above; green shades work well for bullish contexts without overpowering candles.
Reading & Interpretation
Higher high labels and red lines indicate potential resistance zones where volume weighting begins at a new swing top, suggesting sellers may defend prior highs. Lower low labels and lime lines mark support from a fresh swing bottom, with the line's slope reflecting buyer commitment via volume. Lower highs or higher lows appear as labels without new anchors, signaling possible range-bound action. Line proximity to price shows overextension; crosses may hint at regime shifts, but confirm with volume spikes.
Practical Workflows & Combinations
- Trend following: Enter longs above a rising lower low anchored line after higher low confirmation; filter with rising higher highs for uptrends. Use line breaks as trailing stops.
- Exits/Stops: In downtrends, exit shorts below a higher high line; set aggressive stops above it for scalps, conservative below for swings. Pair with momentum oscillators for divergence.
- Multi-asset/Multi-TF: Defaults suit forex/stocks on 1H–4H; on crypto 15M, shorten length to 15. Scale colors for dark themes; combine with higher timeframe anchors for confluence.
Behavior, Constraints & Performance
Closed-bar logic ensures pivots confirm after the lookback period, with no repainting on historical bars—live bars may adjust until regime shift. No higher timeframe calls, so minimal repaint risk beyond standard delays. Resources include a 2000-bar history limit, label/polyline caps at 200/50, and loops for historical point filling (up to current bar count from anchor, typically under 500 iterations). Known limits: In extreme gaps or low-volume periods, anchors may skew; lines absent until first pivots.
Sensible Defaults & Quick Tuning
Start with the 30-bar length for balanced pivot detection across most assets. For too-frequent pivots in ranges, increase to 50 for fewer signals. If lines lag in trends, reduce to 20 and enable labels for visual cues. In low-volatility assets, widen color contrasts; test on 100-bar history to verify stability.
What this indicator is—and isn’t
This is a structure-aware visualization layer for anchoring volume-weighted references at swing extremes, enhancing manual analysis of regimes and levels. It is not a standalone signal generator or predictive model—always integrate with broader context like order flow or news. Use alongside risk management and position sizing, not as isolated buy/sell triggers.
Many thanks to LuxAlgo for the original script "McDonald's Pattern ". The implementation for body pivots instead of wicks uses a = max(open, close), b = min(open, close) and then highest(a, length) / lowest(b, length). This filters noise from the wicks and detects breakouts over/under bodies. Unusual and targeted, super innovative.
Disclaimer
The content provided, including all code and materials, is strictly for educational and informational purposes only. It is not intended as, and should not be interpreted as, financial advice, a recommendation to buy or sell any financial instrument, or an offer of any financial product or service. All strategies, tools, and examples discussed are provided for illustrative purposes to demonstrate coding techniques and the functionality of Pine Script within a trading context.
Any results from strategies or tools provided are hypothetical, and past performance is not indicative of future results. Trading and investing involve high risk, including the potential loss of principal, and may not be suitable for all individuals. Before making any trading decisions, please consult with a qualified financial professional to understand the risks involved.
By using this script, you acknowledge and agree that any trading decisions are made solely at your discretion and risk.
Do not use this indicator on Heikin-Ashi, Renko, Kagi, Point-and-Figure, or Range charts, as these chart types can produce unrealistic results for signal markers and alerts.
Best regards and happy trading
Chervolino

Previous TPOIndicator Summary
This Pine Script indicator, "Previous TPO," is designed to calculate and display five key price levels from the previous trading day's market activity. It uses a 30-minute TPO (Time Price Opportunity) profile, which is a method of organizing price by time to find areas of high and low activity.
The five levels it plots on the current day are:
1. Previous Value Area High (VAH)
2. Previous Value Area Low (VAL)
3. Previous Point of Control (POC)
4. Previous Initial Balance High (IBH)
5. Previous Initial Balance Low (IBL)
The script is built to be efficient, running its main calculation only once at the beginning of each new day. It also includes an automatic line management system to delete old lines, preventing the "Too many lines" error and keeping the chart clean.
How the Code Works
1. Data Collection: At the start of a new day (00:00), the script looks back at the chart's history. It uses request.security to access 30-minute bar data.
2. Collector Loop: It then loops backward, bar by bar, to find and store 48 unique 30-minute High/Low data points, which represents the full 24-hour range of the previous day.
3. TPO Profile: With this 30-minute data, it builds a TPO profile. It divides the previous day's price range into small bins (price levels) and counts how many 30-minute periods "touched" each price bin.
4. Level Calculation:
o POC: It finds the price bin with the highest TPO count (the most traded price) and sets it as the Point of Control.
o VAH/VAL: It starts at the POC and expands outward, adding the next-most-traded price bins until 70% (or the user-defined percentage) of the day's TPOs are included. The highest and lowest prices of this range are the Value Area High and Value Area Low.
o IBH/IBL: It identifies the high and low of the first hour (the first two 30-minute bars) of the previous day to set the Initial Balance High and Initial Balance Low.
5. Drawing: The script draws these five levels as horizontal lines across the current trading day, providing a constant reference.
6. Line Management: It keeps track of all lines in an array. When the total number of lines exceeds the user's limit (e.g., 50 days * 5 lines = 250), it automatically deletes the oldest lines from the chart.
Usefulness for Trading
This indicator provides a powerful framework for intraday traders by contextualizing the current day's price action against the previous day's "auction."
• Key Support/Resistance: The VAH, VAL, and POC act as significant support and resistance lev-els. Price reacting at these levels can signal mean reversion, while acceptance beyond them can signal a trend or expansion day.
• Value Area as Context: Trading inside the previous day's value area (between VAH and VAL) is often seen as "balanced" or "range-bound" trading. Trading outside of it is "unbalanced" or "trending."
• POC as a "Magnet": The POC, being the area of highest volume/time, often acts as a "magnet" or "center of gravity" for price.
• Opening Range: The Initial Balance (IB) levels show the opening range. A breakout from this range is often a key signal for the day's initial direction.
• 80% Rule: The script contains (currently commented-out) setup logic for the "80% Rule." This is a specific Market Profile strategy where:
1. The market opens inside the previous day's Value Area.
2. The Initial Balance fails to extend outside the VA (e.g., in a short setup, the IB high stays below the VAH).
3. This setup suggests an 80% probability that the price will rotate and test the other side of the Value Area (e.g., test the VAL).
Publication and restrictions
This script is published under the Mozilla Public Licence 2.0 (MPL 2.0) and is therefore suitable for publi-cation as an open source indicator on TradingView.
Timeframe limitation: The indicator is designed for intraday timeframes. Timeframes below 10 minutes do not work and lead to an error. Recommended time frame 30 minutes.
It will not work correctly on:
Time frame under 10 minutes: The data collection loop (max_bars_to_check = 3000) is not large enough to collect the bars required for a full day on a 5-minute chart or smaller.
High time frames (e.g. 1H, 4H, Daily): The script's logic is based on a chart timeframe 30-minute data that it requests. If higher time frames are selected, the script works but the zones are no longer correct or become irrelevant.

Wick Bias - by TenAMTraderWick Bias - by TenAMTrader
Wick Bias helps traders quickly visualize market pressure by analyzing candle wicks and bodies over a user-defined number of bars. By comparing top and bottom wicks, the indicator identifies whether buying or selling pressure has been dominant, providing a clear Indicator Bias signal (Bullish, Bearish, or Neutral).
Key Features:
Shows Top Wicks %, Bottom Wicks %, and optional Body % for recent candles.
Highlights Indicator Bias to indicate short-term market trends.
Fully customizable colors for table rows and bias labels.
Option to show or hide body percentage.
Alerts trigger on bias flips, with optional on-chart labels.
Table can be placed in any chart corner.
Updates in real-time with each new bar.
Recommended Use:
Ideal for intraday and swing traders looking for a quick visual cue of short-term market momentum.
Can be combined with other technical analysis tools to confirm trade setups or potential reversals.
Disclaimer / Legal Notice:
This indicator is for educational and informational purposes only. It is not financial advice and should not be used as the sole basis for trading decisions. Past performance does not guarantee future results. Users are responsible for their own trades. The developer is not liable for any losses or damages resulting from the use of this indicator.

AUTOMATIC ANALYSIS MODULE🧭 Overview
“Automatic Analysis Module” is a professional, multi-indicator system that interprets market conditions in real time using TSI, RSI, and ATR metrics.
It automatically detects trend reversals, volatility compressions, and momentum exhaustion, helping traders identify high-probability setups without manual analysis.
⚙️ Core Logic
The script continuously evaluates:
TSI (True Strength Index) → trend direction, strength, and early reversal zones.
RSI (Relative Strength Index) → momentum extremes and technical divergences.
ATR (Average True Range) → volatility expansion or compression phases.
Multi-timeframe ATR comparison → detects whether the weekly structure supports or contradicts the local move.
The system combines these signals to produce an automatic interpretation displayed directly on the chart.
📊 Interpretation Table
At every new bar close, the indicator updates a compact dashboard (bottom right corner) showing:
🔵 Main interpretation → trend, reversal, exhaustion, or trap scenario.
🟢 Micro ATR context → volatility check and flow analysis (stable / expanding / contracting).
Each condition is expressed in plain English for quick decision-making — ideal for professional traders who manage multiple charts.
📈 How to Use
1️⃣ Load the indicator on your preferred asset and timeframe (recommended: Daily or 4H).
2️⃣ Watch the blue line message for the main trend interpretation.
3️⃣ Use the green line message as a volatility gauge before entering.
4️⃣ Confirm entries with your own strategy or price structure.
Typical examples:
“Possible bullish reversal” → early accumulation signal.
“Compression phase → wait for breakout” → avoid premature trades.
“Confirmed uptrend” → trend continuation zone.
⚡ Key Features
Real-time auto-interpretation of TSI/RSI/ATR signals.
Detects both bull/bear traps and trend exhaustion zones.
Highlights volatility transitions before breakouts occur.
Works across all assets and timeframes.
No repainting — stable on historical data.
✅ Ideal For
Swing traders, position traders, and institutional analysts who want automated context recognition instead of manual indicator reading.

HTF Candles with PVSRA Volume Coloring (PCS Series)This indicator displays higher timeframe (HTF) candles using a PVSRA-inspired color model that blends price and volume strength, allowing traders to visualize higher-timeframe activity directly on lower-timeframe charts without switching screens.
OVERVIEW
This script visualizes higher-timeframe (HTF) candles directly on lower-timeframe charts using a custom PVSRA (Price, Volume & Support/Resistance Analysis) color model.
Unlike standard HTF indicators, it aggregates real-time OHLC and volume data bar-by-bar and dynamically draws synthetic HTF candles that update as the higher-timeframe bar evolves.
This allows traders to interpret momentum, trend continuation, and volume pressure from broader market structures without switching charts.
INTEGRATION LOGIC
This script merges higher-timeframe candle projection with PVSRA volume analysis to provide a single, multi-timeframe momentum view.
The HTF structure reveals directional context, while PVSRA coloring exposes the underlying strength of buying and selling pressure.
By combining both, traders can see when a higher-timeframe candle is building with strong or weak volume, enabling more informed intraday decisions than either tool could offer alone.
HOW IT WORKS
Aggregates price data : Groups lower-timeframe bars to calculate higher-timeframe Open, High, Low, Close, and total Volume.
Applies PVSRA logic : Compares each HTF candle’s volume to the average of the last 10 bars:
• >200% of average = strong activity
• >150% of average = moderate activity
• ≤150% = normal activity
Assigns colors :
• Green/Blue = bullish high-volume
• Red/Fuchsia = bearish high-volume
• White/Gray = neutral or low-volume moves
Draws dynamic outlines : Outlines update live while the current HTF candle is forming.
Supports symbol override : Calculations can use another instrument for correlation analysis.
This multi-timeframe aggregation avoids repainting issues in request.security() and ensures accurate real-time HTF representation.
FEATURES
Dual HTF Display : Visualize two higher timeframes simultaneously (e.g., 4H and 1D).
Dynamic PVSRA Coloring : Volume-weighted candle colors reveal bullish or bearish dominance.
Customizable Layout : Adjust candle width, spacing, offset, and color schemes.
Candle Outlines : Highlight the forming HTF candle to monitor developing structure.
Symbol Override : Display HTF candles from another instrument for cross-analysis.
SETTINGS
HTF 1 & HTF 2 : enable/disable, set timeframes, choose label colors, show/hide outlines.
Number of Candles : choose how many HTF candles to plot (1–10).
Offset Position : distance to the right of the current price where HTF candles begin.
Spacing & Width : adjust separation and scaling of candle groups.
Show Wicks/Borders : toggle wick and border visibility.
PVSRA Colors : enable or disable volume-based coloring.
Symbol Override : use a secondary ticker for HTF data if desired.
USAGE TIPS
Set the indicator’s visual order to “Bring to front.”
Always choose HTFs higher than your active chart timeframe.
Use PVSRA colors to identify strong momentum and potential reversals.
Adjust candle spacing and width for your chart layout.
Outlines are not shown on chart timeframes below 5 minutes.
TRADING STRATEGY
Strategy Overview : Combine HTF structure and PVSRA volume signals to
• Identify zones of high institutional activity and potential reversals.
• Wait for confirmation through consolidation or a pullback to key levels.
• Trade in alignment with dominant higher-timeframe structure rather than chasing volatility.
Setup :
• Chart timeframe: lower (5m, 15m, 1H)
• HTF 1: 4H or 1D
• HTF 2: 1D or 1W
• PVSRA Colors: enabled
• Outlines: enabled
Entry Concept :
High-volume candles (green or red) often indicate market-maker activity , such zones often reflect liquidity absorption by larger players and are not necessarily ideal entry points.
Wait for the next consolidation or pullback toward a support or resistance level before acting.
Bullish scenario :
• After a high-volume or rejection candle near a low, price consolidates and forms a higher low.
• Enter long only when structure confirms strength above support.
Bearish scenario :
• After a high-volume or rejection candle near a top, price consolidates and forms a lower high.
• Enter short once resistance holds and momentum weakens.
Exit Guidelines :
• Exit when next HTF candle shifts in color or momentum fades.
• Exit if price structure breaks opposite to your trade direction.
• Always use stop-loss and take-profit levels.
Additional Tips :
• Never enter directly on strong green/red high-volume candles, these are usually areas of institutional absorption.
• Wait for market structure confirmation and volume normalization.
• Combine with RSI, moving averages, or support/resistance for timing.
• Avoid trading when HTF candles are mixed or low-volume (unclear bias).
• Outlines hidden below 5m charts.
Risk Management :
• Use stop-loss and take-profit on all positions.
• Limit risk to 1–2% per trade.
• Adjust position size for volatility.
FINAL NOTES
This script helps traders synchronize lower-timeframe execution with higher-timeframe momentum and volume dynamics.
Test it on demo before live use, and adjust settings to fit your trading style.
DISCLAIMER
This script is for educational purposes only and does not constitute financial advice.
SUPPORT & UPDATES
Future improvements may include alert conditions and additional visualization modes. Feedback is welcome in the comments section.
CREDITS & LICENSE
Created by @seoco — open source for community learning.
Licensed under Mozilla Public License 2.0 .

Smart Money Dynamics Blocks — Pearson MatrixSmart Money Dynamics Blocks — Pearson Matrix
A structural fusion of Prime Number Theory, Pearson Correlation, and Cumulative Delta Geometry.
1. Mathematical Foundation
This indicator is built on the intersection of Prime Number Theory and the Pearson correlation coefficient, creating a structural framework that quantifies how price and time evolve together.
Prime numbers — unique, indivisible, and irregular — are used here as nonlinear time intervals. Each prime length (2, 3, 5, 7, 11…97) represents a regression horizon where correlation is measured between price and time. The result is a multi-scale correlation lattice — a geometric matrix that captures hidden directional strength and temporal bias beyond traditional moving averages.
2. The Pearson Matrix Logic
For every prime interval p, the indicator calculates the linear correlation:
r_p = corr(price, bar_index, p)
Each r_p reflects how closely price and time move together across a prime-defined window. All r_p values are then averaged to create avgR, a single adaptive coefficient summarizing overall structural coherence.
- When avgR > 0.8 → strong positive correlation (labeled R+).
- When avgR < -0.8 → strong negative correlation (labeled R−).
This approach gives a mathematically grounded definition of trend — one that isn’t based on pattern recognition, but on measurable correlation strength.
3. Sequential Prime Slope and Median Pivot
Using the ordered sequence of 25 prime intervals, the model computes sequential slopes between adjacent primes. These slopes represent the rate of change of structure between two prime scales. A robust median aggregator smooths the slopes, producing a clean, stable directional vector.
The system anchors this slope to the 41-bar pivot — the median of the first 25 primes — serving as the geometric midpoint of the prime lattice. The resulting yellow line on the chart is not an ordinary regression line; it’s a dynamic prime-slope function, adapting continuously with correlation feedback.
4. Regression-Style Parallel Bands
Around this prime-slope line, the indicator constructs parallel bands using standard deviation envelopes — conceptually similar to a regression channel but recalculated through the prime–Pearson matrix.
These bands adjust dynamically to:
- Volatility, via standard deviation of residuals.
- Correlation strength, via avgR sign weighting.
Together, they visualize statistical deviation geometry, making it easier to observe symmetry, expansion, and contraction phases of price structure.
5. Volume and Cumulative Delta Peaks
Below the geometric layer, the indicator incorporates a custom lower-timeframe volume feed — by default using 15-second data (custom_tf_input_volume = “15S”). This allows precise delta computation between up-volume and down-volume even on higher timeframe charts.
From this feed, the indicator accumulates delta over a configurable period (default: 100 bars). When cumulative delta reaches a local maximum or minimum, peak and trough markers appear, showing the precise bar where buying or selling pressure statistically peaked.
This combination of geometry and order flow reveals the intersection of market structure and energy — where liquidity pressure expresses itself through mathematical form.
6. Chart Interpretation
The primary chart view represents the live execution of the indicator. It displays the relationship between structural correlation and volume behavior in real time.
Orange “R+” and blue “R−” labels indicate regions of strong positive or negative Pearson correlation across the prime matrix. The yellow median prime-slope line serves as the structural backbone of the indicator, while green and red parallel bands act as dynamic regression boundaries derived from the underlying correlation strength. Peaks and troughs in cumulative delta — displayed as numerical annotations — mark statistically significant shifts in buying and selling pressure.
The secondary visualization (Prime Regression Concept) expands on this by illustrating how regression behavior evolves across prime intervals. Each colored regression fan corresponds to a prime number window (2, 3, 5, 7, …, 97), demonstrating how multiple regression lines would appear if drawn independently. The indicator integrates these into one unified geometric model — eliminating the need to plot tens of regression lines manually. It’s a conceptual tool to help visualize the internal logic: the synthesis of many small-scale regressions into a single coherent structure.
7. Interpretive Insight
This model is not a prediction tool; it’s an instrument of mathematical observation. By translating price dynamics into a prime-structured correlation space, it reveals how coherence unfolds through time — not as a forecast, but as a measurable evolution of structure.
It unifies three analytical domains:
- Prime distribution — defines a nonlinear temporal architecture.
- Pearson correlation — quantifies statistical cohesion.
- Cumulative delta — expresses behavioral imbalance in order flow.
The synthesis creates a geometric analysis of liquidity and time — where structure meets energy, and where the invisible rhythm of market flow becomes measurable.
8. Contribution & Feedback
Share your observations in the comments:
- The time gap and alternation between R+ and R− clusters.
- How different timeframes change delta sensitivity or reveal compression/expansion.
- Prime intervals/clusters that tend to sit near turning points or liquidity shifts.
- How avgR behaves across assets or regimes (trending, ranging, high-vol).
- Notable interactions with the parallel bands (touches, breaks, mean-revert).
Your field notes help others read the model more effectively and compare contexts.
Summary
- Primes define the structure.
- Pearson quantifies coherence.
- Slope median stabilizes geometry.
- Regression bands visualize deviation.
- Cumulative delta locates imbalance.
Together, they construct a framework where mathematics meets market behavior.
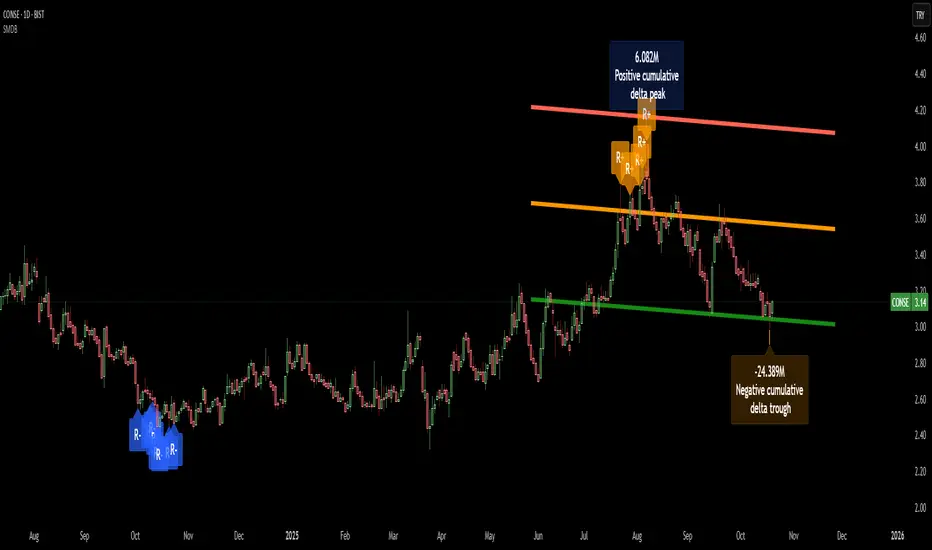
ORBs, EMAs, SMAs, AVWAPThis is an update to a previously published script. In short the difference is the added capability to adjust the length of EMAs. Also added 3 customizable SMAs. Enjoy! Let me know what you think of the script please. This is only second one I have ever done. Through practice and people like @LuxAlgo and other Pinescripters this isn't possible. Tedious hrs with ChatGPT to correct nuances, who doesnt seem to learn from (insert pronoun) mistakes
This all-in-one indicator combines key institutional tools into a unified framework for intraday and swing trading. Designed for traders who use multi-session analysis and dynamic levels, it automatically maps out global session breakouts, moving averages, and volume-weighted anchors with high clarity.
Features include:
🕓 Tokyo, London, and New York ORBs (Opening Range Breakouts) — 30-minute configurable range boxes that persist until the next New York open.
📈 Anchored VWAP with Standard Deviation Bands — dynamically anchorable to session, week, or month for institutional-grade price tracking.
📊 Exponential Moving Averages (9, 20, 113, 200) — for short-, mid-, and long-term momentum structure.
📉 Simple Moving Averages (20, 50, 100) — fully customizable lengths, colors, and visibility toggles for trend confirmation.
🏁 Prior High/Low Levels (PDH/PDL, PWH/PWL, PMH/PML) — automatically plotted from previous day, week, and month, with labels placed at each session’s midpoint.
🎛️ Session-Aligned Time Logic — all time calculations use New York session anchors with DST awareness.
💡 Clean Visualization Options — every component can be toggled on/off, recolored, or customized for your workflow.
Best used for:
ORB break-and-retest setups
VWAP and EMA rejections
Confluence-based trading around key session levels
Multi-session momentum tracking

Key Levels (PA, MAs, VWAPs, Volume Profile, rVWAPs)This indicator marks all kinds of key levels so that users can keep an overview of their specified levels in a convenient non chart cluttering way. It can highlight levels of confluence or display each level seperately.
The indicator includes markers for the following levels:
Price Action: Opens, Previous High/Low, Monday Range
Moving Averages: H4, D1 and W1 with customisable lengths
VWAPs: Developing and Previous VWAPs with their respective VAL/VAH (1 Standard Deviation)
Rolling VWAPs
Volume Profile: Developing and Previous VAL/VAH/POC
What makes this indicator different is its vast customisation options and big library of levels…
… users can choose to merge all levels that are aligned in a specified % threshold and additionally they can choose to color them the same color to highlight confluence levels.
… users have the choice between Full Label Markers or Abbreviations of those Labels.
… users have the choice of a few presets making level switching fast and convenient (Price Action, Volume Profile, VWAP, Volume or Custom).
… users can specify if they prefer to highlight Simple Moving Averages or Exponential Moving Averages. They have calculations available on three different timeframes and can change the lengths of each.
… users can color all levels the same with one click instead of having to manually change all of them.
… when users choose Volume Profile Levels they can either let the script auto calculate the row size making asset switching simple or they can manually input row size.
With the custom preset users can show and hide whichever levels they want.
(To have them the same every time you freshly load the indicator save your settings as default in the lower left corner of the settings tab).
Purpose
This indicator is designed to serve as a level visualisation tool that has the ability to highlight levels of confluence. It may assist in keeping an overview of where all levels are currently located but does not produce signals or trade recommendations.

🐼 Panda EMA-OBV Dual SignalPanda EMA-OBV Dual Signal
Description:
The Panda EMA-OBV Dual Signal combines exponential moving averages (EMAs) with On-Balance Volume (OBV) to identify both trend direction and momentum strength.
This script is designed for professional traders who want clear visual confirmations for reversals and trend continuations.
Main Features:
• Multi-layer EMA system (14 / 20 / 50 / 100 periods) for trend alignment
• OBV divergence detection (Bullish / Bearish)
• RSI confirmation filter for extra accuracy
• Auto signal arrows for buy/sell opportunities
• Works on all timeframes (H1 / H4 / D / W / MN)
How to use:
1️⃣ Look for Buy signal when OBV shows Bullish divergence and price closes above EMA 20.
2️⃣ Look for Sell signal when OBV shows Bearish divergence and price closes below EMA 20.
3️⃣ Use EMA crossovers as confirmation for trend continuation.
Tip:
The script is optimized for XAUUSD and BTCUSD but can also be applied to other assets for swing or intraday analysis.
Created by Millionbears | For educational and analytical purposes only.
