(VIP) VSA Scanner v2This script is major rewritten from scratch analysis of Volume Spread Analysis in comparison to previous version. New definitions have been added, calculations of Spread, Volume and Trend have been optimised and signals are much more accurate. I created script based on definitions coming from methodology of Volume Spread Analysis. Signals appearing below candle are treated as SOS (Signal of Strength) and those above candles - SOW (Signal of Weakness). Also we can see automatic identification of Bullish / Bearish Volume . Script is judging Spread and Volume used for identifying VSA Signals based on multiple factors. Also analysis of Effort & Result have been added, easily allowing to spot continuations of trend and divergences.
All major signals from VSA have been added like Stopping Volume, Climaxes, End of Rising Market, Bag Holding etc.
In case of interest, please contact me directly via DM on Tradingview or please see link to documentation from my signature where you can find more information about Subscription and script itself.
VSA

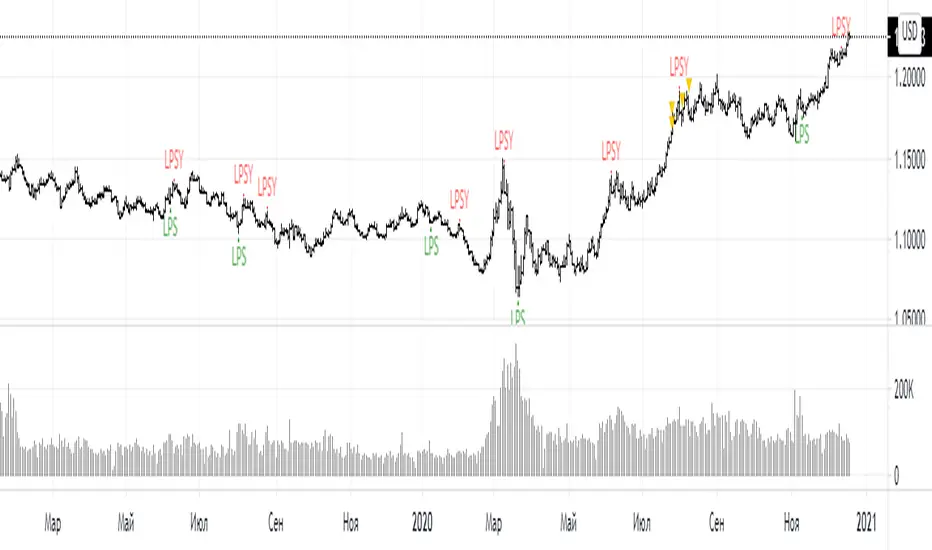
LPS PLSY INDICATOR for VSA( Google translation from Russian.)
Signal conditions:
1. There is a bar with an increased volume
2. The next bar after the bar with increased volume closes in the other direction
Arguments:
Comparison period - the period during which the volumes are compared with each other to calculate the bars with the increased volume.
sensitivity of increased volumes - according to the percentrank indicator - the border above which the volume will be considered large, the same as in the Volume on bar VSA indicator - indicator V2 - for clarity of how it works, I recommend looking at it.
efficiency of the next bar - (efficiency of the next bar from 0 to 100) ") - the efficiency of buying or selling on the next bar, bar field with a large volume. If the value is closer to 100, then the bars whose spread corresponds to the inserted volume will be taken into account, if closer to 0, then bars with a small spread and a large volume can be taken into account.
This argument is calculated similarly to the efficiency of bulls and bears for VSA
Attention.
In its original form, this indicator can give a large number of false signals. To filter out false signals, it should be used after studying the theory of VSA.
Russian language
Условия для сигнала:
1. Имеется бар с повышенным объёмом
2. Следующий бар после бара с повышенным объемом закрывается в другую сторону
Аргументы:
период для сравнения – период, на котором сравниваются между собой объёмы, для вычисления баров с повышенным объемом.
чувствительность повышенных объемов – согласно индикатору percentrank – граница выше которой̆ объем будет считаться большим, то же самое, что в индикаторе Volume on bar VSA - indicator V2 – для наглядности как это работает рекомендую посмотреть его.
эффективность следующего бара от 0 до 100 - эффективность покупок или продаж на следующем баре, поле бара с большим объемом. Если значение ближе к 100 то будут учитываться бары у которых спред соответствует вложенному объему, если ближе к 0 то могут учитываться бары у которых спред маленький а объем большой.
Расчёт этого аргумента производится аналогично индикатору efficiency of bulls and bears for VSA
Примечание
В исходном виде этот индикатор может давать большое количество ложных сигналов. Для отсеивания ложных сигналов его следует применять после изучения теории VSA.
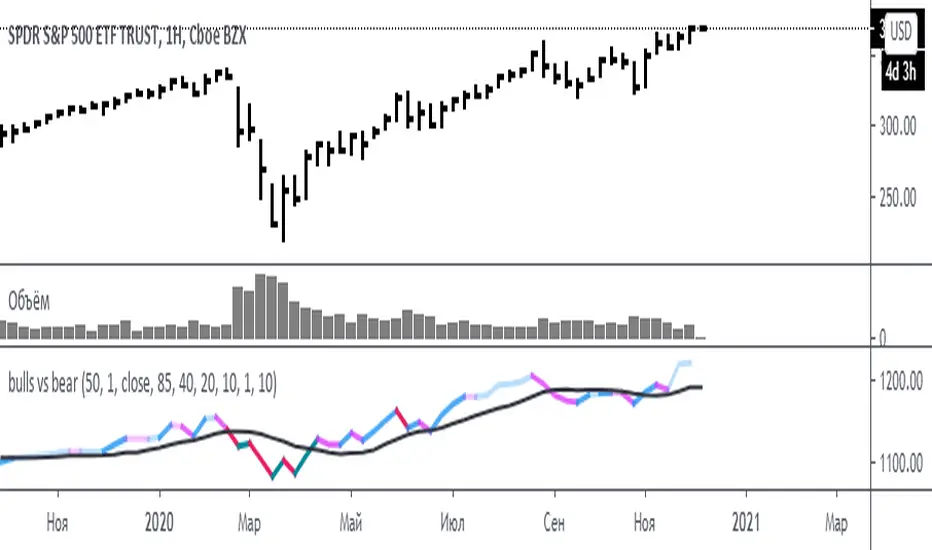
bulls vs bear for VSA(Google translation from Russian.)
This indicator is based on the efficiency of bulls and bears for VSA and has the same parameters.
Its only difference is that all the values of the efficiency of bulls and bears for VSA indicator are sequentially added here.
I want to note that the Period spread - Bars from close to close argument was made for experimental purposes, and shows interesting results for values 3-4-5, in theory this is not very logical. Because then the estimate of the spread for this interval (3-4-5) will be divided by the estimate of the volume of the current bar.
Also added here is a moving average with a default period of 10 - theoretically, if the indicator is above the moving average - the initiative is behind the bulls - if below - the initiative is behind the bears.
It is recommended to use this indicator with the indicator:
efficiency of bulls and bears for VSA
Volume on bar VSA - indicator V2
Russian language.
Этот индикатор сделан на основе efficiency of bulls and bears for VSA и имеет такие же параметры.
Единственное отличие его в том, что тут последовательно складываются все значения индикатора efficiency of bulls and bears for VSA .
Хочу отметить, что аргумент Period spread - Bars from close to close (Период спреда - Баров от закрытия до закрытия) сделан в экспериментальных целях, и показывает интересные результаты на значения 3-4-5, в теории это не очень логично. Потому-что тогда будет делиться оценка спреда за этот интервал (3-4-5), на оценку величины объема текущего бара.
Также тут добавлена скользящая средняя с периодом по умолчанию 10 – теоретически, если индикатор над скользящей средней – инициатива за быками – если ниже – инициатива за медведями.
Это индикатор рекомендуется использовать с индикатором:
efficiency of bulls and bears for VSA
Volume on bar VSA - indicator V2
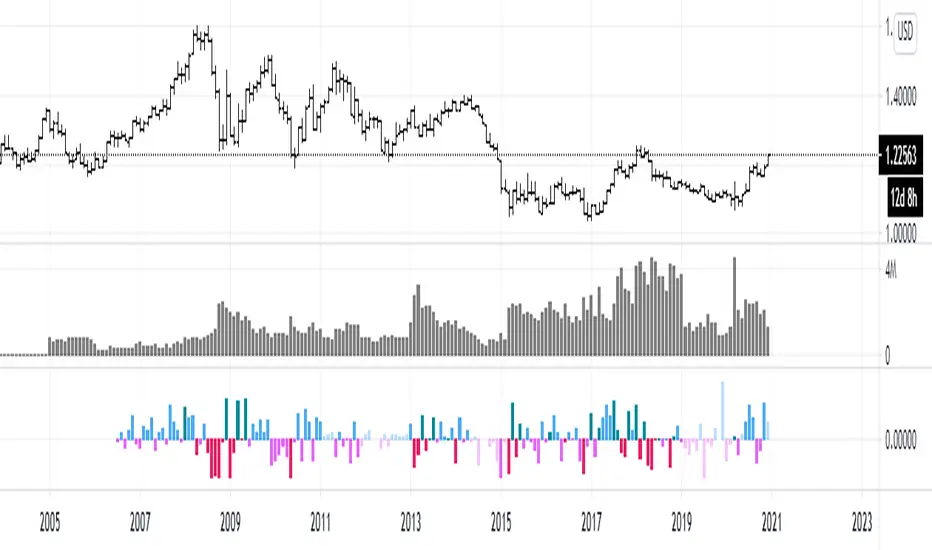
efficiency of bulls and bears for VSA(Google translation from Russian.)
This indicator shows the effectiveness of selling or buying.
It is calculated as follows: using percentrank, the volume and the value of the spread are estimated (momentum = 1)
the resulting estimate of the volume value is divided by the estimate of the spread (momentum = 1) and thus we obtain the value. The larger it is, the more efficient and easier the price movement was.
If the indicator value is small, then this means that the movement was ineffective, because the volume (money) was invested. but no result.
The color of the volume bars is assigned as follows:
Buyers:
If the volume is large - Blue - green
If middle, then blue
Small - light blue
Sellers:
If the volume is large - Burgundy color
If middle, then purple
Small volume - light purple
Indicator parameters:
Comparison period - the period at which the volumes and spread are compared with each other - by default it is 50, selected as the most universal period suitable for different timeframes. But for daytime ones. Weekly and monthly timeframes may need to be shortened. This is true after significant spikes in volume that are exceptional over the long term.
Period spread - Bars from close to close - or in other words, it is momentum - defaults to 1
sensitivity of increased volumes - according to the percentrank indicator - the limit above which the volume will be considered large, the same as in the Volume on bar VSA - indicator V2 - for clarity, I recommend looking at it.
The default is 85, which means. that if the current value of the volume is greater than 85% of the remaining values in this period, then such a value of the volume will be considered high.
medium volume sensitivity - the same sensitivity of increased volumes but for medium volumes.
multiplier of increased volumes - this is an empirical factor to emphasize the importance of increased volumes - default = 20
multiplier of average volumes - the same. As above, but for medium volumes - the default is 10
reduced volume multiplier - Default is 1.
Knowledge of VSA is required to read this indicator
This indicator is recommended for use with indicators:
Volume on bar VSA - indicator V2
BAR for VSA
Russian language
Этот индикатор показывает эффективность продаж или покупок.
Рассчитывается следующим образом: с помощью percentrank оценивается величина объема и велечина спреда (momentum = 1)
полученная оценка велечины объема делится на оценку спреда (momentum = 1) и таким образом получаем значение. Чем оно больше, тем движение цены было эффективнее и легче.
Если значение индикатора маленькое, то это означает, что движение было неэффективным, поскольку объем (деньги) вложили. а результата нет.
Цвет барам объемов присваиваются следующим образом:
У покупателей:
Если объем большой - Сине – зелёный цвет
Если средний – то голубой
Маленький – свело-голубой
У продавцов:
Если объем большой - Бордовый цвет
Если средний – то пурпурный
Маленький объем – светло-пурпурный
Параметры индикатора:
Comparison period (период для сравнения) – период на котором между собой сравниваются объемы и спред – по умолчанию равно 50 , выбрано как наиболее универсальный период подходящий для различных таймфреймов. Но для дневных. Недельных и месячных таймфреймов может потребоваться уменьшить период. Это актуально после значительных всплесков объемов, которые являются исключительными на длительном периоде.
Period spread - Bars from close to close (Период спреда - Баров от закрытия до закрытия) – или другими словами это momentum – по умолчанию равно 1
sensitivity of increased volumes (чувствительность повышенных объемов) – согласно индикатору percentrank – граница выше которой объем будет считаться большим, то же самое, что в индикаторе Volume on bar VSA - indicator V2 – для наглядности как это работает рекомендую посмотреть его.
По умолчанию задано 85 – это означает. что если текущее значение объема больше, чем 85% остальных значений на этом периоде, то такое значение объема будет считаться высоким.
medium volume sensitivity (чувствительность средних объемов) – то же самое sensitivity of increased volumes но для средних объемов.
multiplier of increased volumes (множитель (вес) повышенных объемов) – это эмперический коэффициент для придания особой важности повышенным объемам- по умолчанию = 20
multiplier of average volumes (множитель (вес) средних объемов) – то же самое. Что и выше, но для средних объемов – по умолчанию равно 10
reduced volume multiplier (множитель (вес) пониженных объемов) – по умолчанию равно 1.
Для чтения данного индикатора необходимо знание VSA
Этот индикатор рекомендуется использовать с индикаторами:
Volume on bar VSA - indicator V2
BAR for VSA
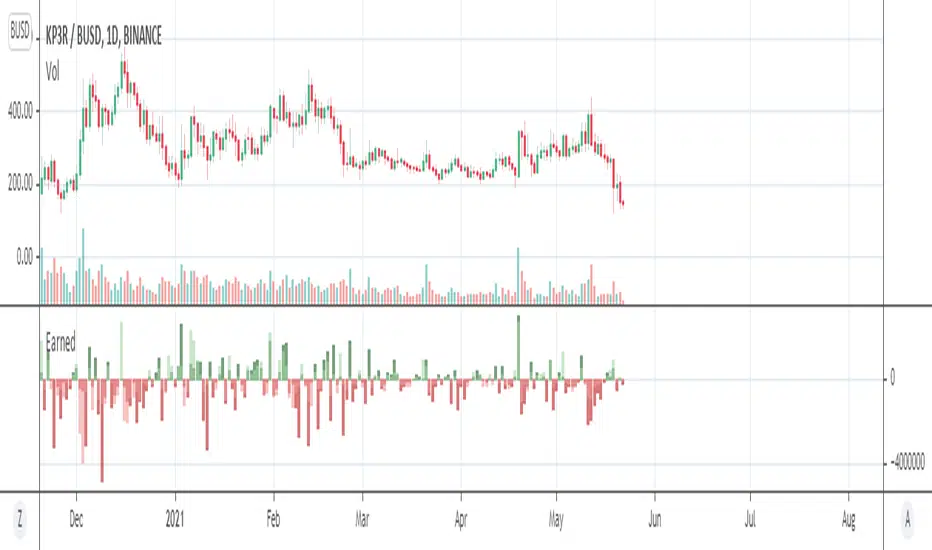
EarnedHello friends. I am glad to present for your attention one of my products based on the X-Volume indicator code. The "Earned" indicator shows how much money is earned on the market relative to actual timeframe. Accuracy is relative but nevertheless it is close to actual calculated figures.
How this information can help you? Moust easy interpritation -
1) Trend up - earnings up - bulls in the market.
2) Downward trend and earnings up - bears in the market.
3) Trend up - earnings down - fake growth.
4) Downward trend - earnings down - fake bears.
Volume+DeltaIndicator shows Volume and Delta, if Delta is positive - its green, if negative - its red

VF Indicator - VSA tradeIn order to see inside the market, and what the insiders and market makers are doing, we have one tool at our disposal which reveals their activity instantly, and that tool is VOLUME . Volume is the catalyst which when combined with price, provides the foundation stone that is volume price analysis. Base on this concept, Volume Flow Indicator been create. Volume Flow Indicator is an indicator to track buy/sell volume relative to price movement.
Volume Flow Indicator is builds on 2 line, Volume Line and Price line.
1. When Price Line trade below Volume Line, VF will turn RED – Trigger SELL
2. When Price Line trade above Volume Line, VF will turn GREEN – Trigger BUY
The 2 Line move direction also will show the weakness or strength of the background of the chart. When both line moving down, the rebound will likely end up a trap and price will continues move lower.
Price moving sideways - When VF pointing downwards it mean distribution and when VF start to turn Green, it mean end of accumulation.
VF best work when stock price is in pullback. Pullback buying climax occurs when the market makers wish to restock their empty warehouse, and here the trigger is fear of a loss. The market is generally moved fast into a price fall, usually on news, with investors then selling in panic, and with the market makers then stepping in to buy & stop the stock falling further, once buying is complete (Pullback completed) price action begins. VF will trigger buy ( Green Dot ) when the pullback is completed and in continues in Green zone when price continues moving up. However if pullback fail to rebound, VF will turn sell (Red Dot).
Wyckoff’s second law then introduces the concept of time as enshrined in the law of cause and effect. Here the law states that if the cause is large then the effect should also be large if the two are in agreement. In other words, if the time taken to build the next phase of a campaign by the market makers is large, then we should expect to see this reflected in an extended move in the price action as a result.
You can think of this as the effect of winding the spring of a clockwork toy. The more the spring are wound, the greater the energy stored, and the greater the distance the car will travel, once it is released. This is the basic principle of cause and effect.
VF indicator will show this in the area between Volume Line and Price Line. More thicker the Green Zone or Red Zone will show how much the Bullish momentum or Bearish momentum.
Volume reveals the truth behind price action, with VF indicator both volume and price can be easily monitor along the chart real time.

Heatmap Volume [xdecow]This indicator colors the volume bars and candles according to the volume traded. The calculation of the heat map zones is done as follows:
how many standard deviations the volume are distant from the average volume?
For a better visual experience, place the borders and wicks of the candles in a neutral color.

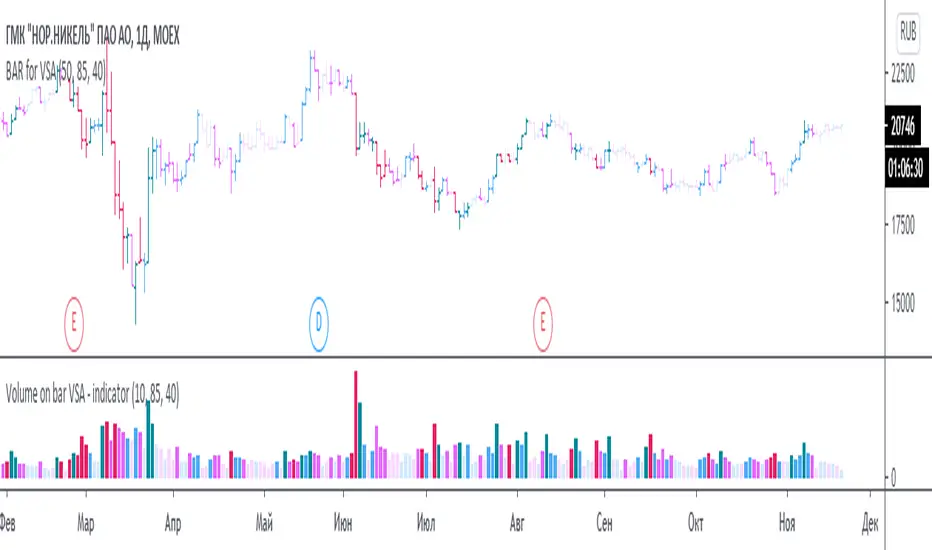
BAR for VSABars in which the open is equal to the previous close.
Bars are colored according to the indicator Volume on bar VSA - indicator V2
(Made for analysis by ICA ).
Бары в которых открытие равно предыдущему закрытию.
Бары раскрашиваюся согласно индикатору Volume on bar VSA - indicator V2
(Сделано для анализа по ВСА).
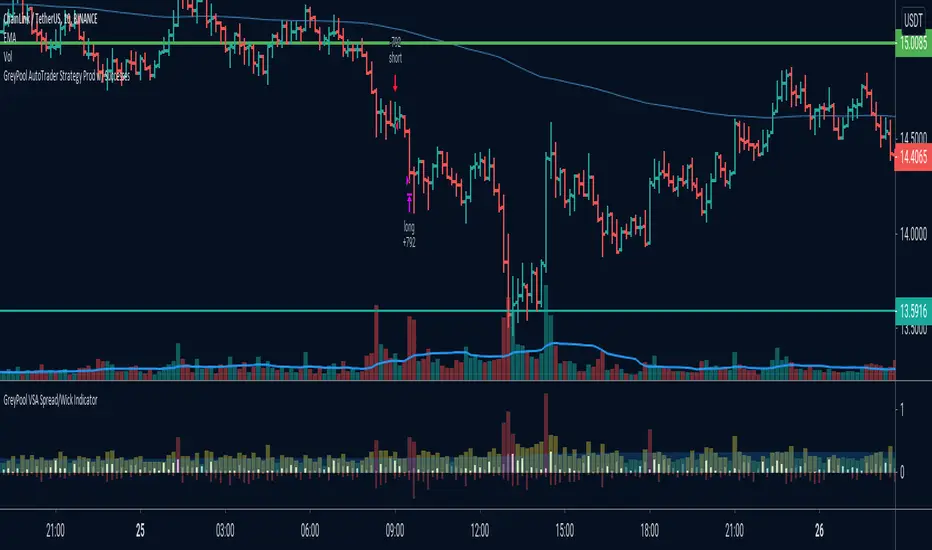
GreyPool VSA Signal ScannerThis Indicator combines powerful Climactic Action Volume Spread Analysis (VSA) signals and displays them on multiple time frames and 8 symbols simultaneously.
Climactic Action is defined as - Excessively large volume or an excessively large price change within a relatively short amount of time where "hidden" buying or selling is indicated.
Glossary:
Climactic Down Bar - A bar closing lower than the previous bar with above average volume and a large spread wherein the close of the bar is significantly higher than the low of the bar (Indicates "hidden" buying).
Climactic Up Bar - A bar closing higher than the previous bar with above average volume and a large spread wherein the close of the bar is significantly lower than the high of the bar (Indicates "hidden" selling).
Trap Down Bar - Also known as a "Shakeout" and occurs when price makes a new low and quickly retraces to close near the high of the bar with excessively large volume and a large spread (Indicates "hidden" buying).
Trap Up Bar - Also known as a "Shakeout" and occurs when price makes a new high and quickly retraces to close near the low of the bar with excessively large volume and a large spread (Indicates "hidden" selling).
Green Buy Signals:
- Created when Climactic Down or Trap Down bars are formed within a range of 3 bars wherein the volume is at the high or very high level and volume is consecutively increasing
Red Sell Signals:
- Created when Climactic Up or Trap Up bars are formed within a range of 3 bars wherein the volume is at the high or very high level and volume is consecutively increasing
How to Use:
1. Choose your favorite 8 trading pairs and signals will be generated for each and on the time frame that you set.
2. Setting the time frame of the indicator higher than your current chart time frame is a way to receive reliably powerful signals from this indicator the 1 hour and 2 hour time frames are particularly helpful.
3. It is also possible to add the indicator to your chart more than once and set a different time frame for each instance.
These signals do not occur often but when they do the market responds in the indicated direction with a high degree of probability.
ALERT FUNCTION INCLUDED
-You can set an alert to trigger when a signal occurs (buy or sell)

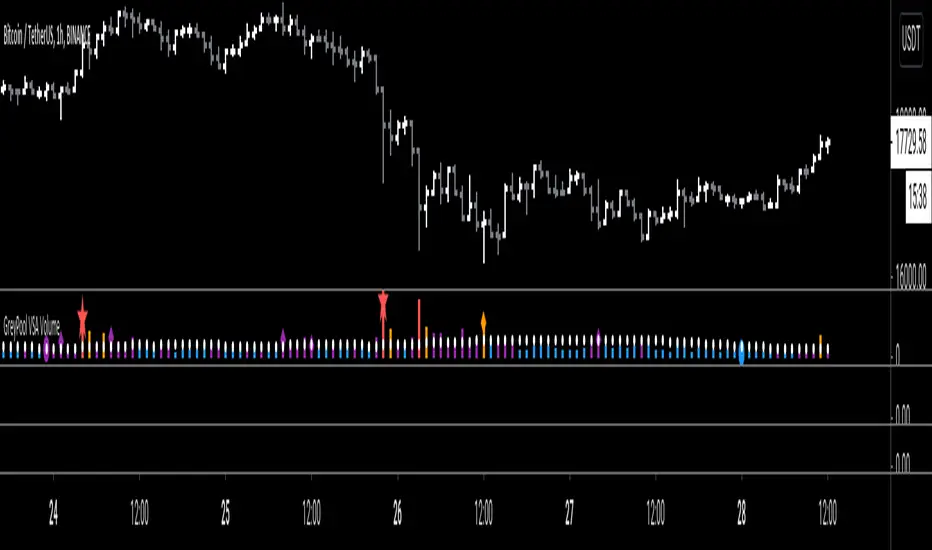
GreyPool VSA VolumeGreyPool VSA Volume Indicator
Color Key:
Blue = Below Average or Low Volume
Purple = Average Volume
Orange = High Volume
Red = Very High Volume
Symbol Key:
Circle = Test on Low Volume
Diamond = TrapUp or TrapDown Bar on High or Very High Volume
Star = Climactic Action Bar
Background Highlight Key:
Green Background = Last 3 bar were increasing high or very high volume including a climactic action DOWN bar or trap DOWN bar
Red Background = Last 3 bars were increasing high or very high volume including a climactic action UP bar or trap UP bar
Available Alerts:
When a Green or Red background appears
When a Climactic Action Up or Down bar appears
Biggest VolumeShows the biggest volume.Seems to me so strange, but i didnt find that kind of indicator, so i post it.
Truenomic's Universal BTC and ETH VolumeA simple indicator to display the total volume of BTC or ETH from different exchanges. The difference between this indicator and others is the ability to see the total volume in BTC or ETH (not USD) from all exchanges simultaneously, including derivative ones.
Spot Exchanges:
Binance;
Coinbase;
Kraken;
Gemini;
Bitfinex;
Bitstamp;
Derivatives Exchanges:
Bitmex;
Okex;
Deribit;
FTX;
Binance;
This list is relevant only at the time of publication, stay tuned for further indicator updates!

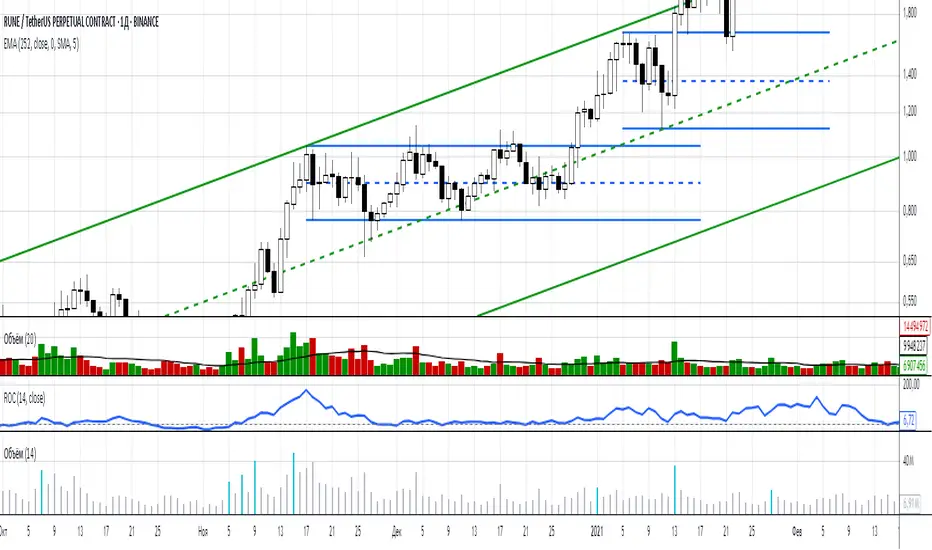
GreyPool ZigZag Cumulative VolumeThis indicator shows the cumulative volume between the zigzag segments (waves) and plots the percentage change from the previous segment
Let us know if there's anything you'd like added to the indicator and please click LIKE to support us

GreyPool VSA Spread/Wick Divergence IndicatorThe purpose of this indicator is to determine the distance between the spread of a bar/candle and the wick at a glance (Spread is defined as the range between the open and close and the wick is any part of the bar/candle that is beyond that range).
Climactic action bars typically have large spreads and a pronounced wick which indicates hidden buying or selling.
Definitions of Colors:
Light Blue Area - Average spread size of the last x bars where x is the set MA period
Red Column - Indicates a very high spread that is far beyond the average
Yellow Column - Indicates spreads that are at the average line or just above it
Green Column - Indicates a very low spread
Thin Red Histogram - Indicates the size of the bottom wick (Either the distance between the close and low of down bars or the open and low or up bars)
Thin Blue Histogram - Indicates the size of the top wick (Either the distance between the open and high for down bars or the close and high for up bars)
*** Please Click The LIKE Button to Support Us, Thank You ***
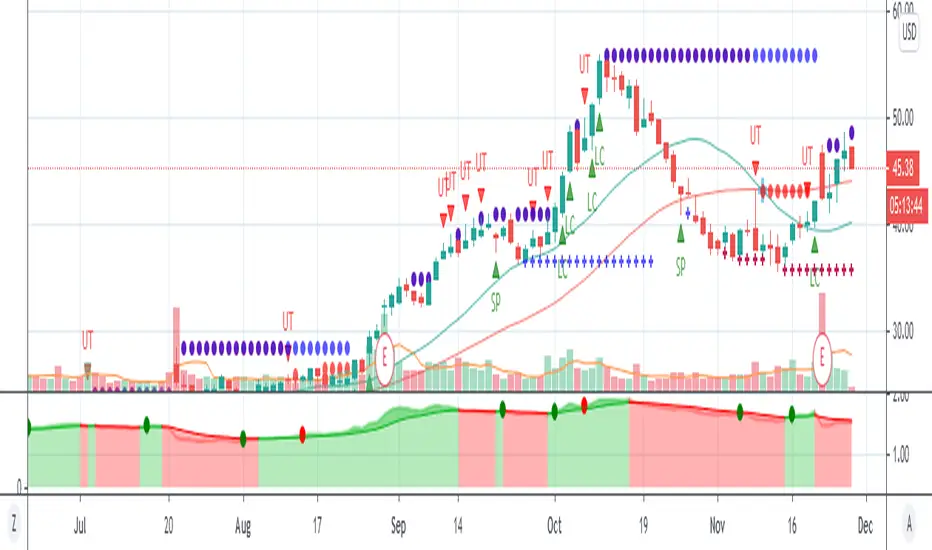
paratradevsa2Volume spread analysis is basically a tool to discover the correlation of price in relation to volume , in order to determine the short-term outcome of price action, in other words, where the market might be moving next.
I have developed this indicator called VSA. It tracks smart money activity and suggests the potential direction of the market.
This indicator gives signals which can be used in following ways-
-> SOW-
1. Buying Climax - For Sell.
2. Upthrust - For Sell.
-> SOS-
1. Selling Climax - For Buy.
2. Stopping Volume - For Buy.
I hope it helps people who use it and give them profitable results.
The script will be updated regularly if there are any issues.
THANK YOU.
No Repaint No Repaint on the closed candles
Access is through invite only
Do you want to use this Indicator .
To Get access - Send me a private chat message in tradingview.com to get access or request in comment section below.
If you like the script and if this useful like comment share.
Best regards and happy trading.

Vandoppler Low Vol DetectorThis indicator works with the VSA methodology
Its designed to detect No Supply and No Demand AREAS no just Individual Bars

VSA indicatorGoogle translation from Russian:
This is VSA bar-by-bar analysis.
Spread, volume and progress are analyzed.
Spread is the difference between the current closing price and the previous one.
Progress is determined by dividing price by volume.
For each parameter (spread, volume, progress), a score is assigned according to the following assessment system:
Great value - 3 points
Average value - 2 points
Small value - 1 point
If the volume is small, i.e. 0 points, the other parameters are not evaluated.
Green bars represent a buyer and red bars represent a seller. It is selected based on the location of the closing price between the high and low prices of the bar. If the closing price is closer to the maximum, then these are purchases, if to the minimum, then these are sales.
The higher the bar value, the stronger the player. The maximum value on the bar is 9 (indicates the maximum values for all parameters of spread, volume and progress).
The blue line is the average value for the last 5 bars (the value changes in the settings), it can be interpreted as the balance of forces for the last 5 bars. The centerline value is multiplied by a scale factor of 2 for better display.
It should be borne in mind that to use the indicator, you need to know the VSA theory, since this indicator cannot assess the result of price changes, breaking through important levels, as well as the context in general.
Это побарный анализ VSA.
Анализируется спред, объем и прогресс.
Спред это – разница между текущей ценой закрытия и предыдущей.
Прогресс определяется делением цены на объем.
По каждому параметру (спред, объем, прогресс) присваивается балл по следующей системе оценке:
Большое значение – 3 балла
Среднее значение – 2 балла
Маленько значение – 1 балл
Если объем маленький, т.е. 0 баллов, то остальные параметры не оцениваются.
Зелёные бары обозначают покупателя, а красные продавца. Выбирается на основании расположения цены закрытия между максимальной и минимальной ценой бара. Если цена закрытия расположена ближе к максимуму, то это покупки, если к минимуму, то это продажи.
Чем больше значение бара, тем сильнее игрок. Максимальное значение на баре равно 9 (указывает максимальные значения по всем параметрам спреду, объему и прогрессу).
Синяя линия это среднее значение по последним 5 барам (значение меняется в настройках), его можно интерпретировать как баланс сил по последним 5 барам. Значение средней линии умножено на масштабный коэффициент равный 2 для лучшего отображения.
Следует учитывать, что для пользования индикатором необходимо знать теорию VSA, поскольку этот индикатор не может оценить результат изменения цены, пробитие важных уровней, а также в целом контекст.

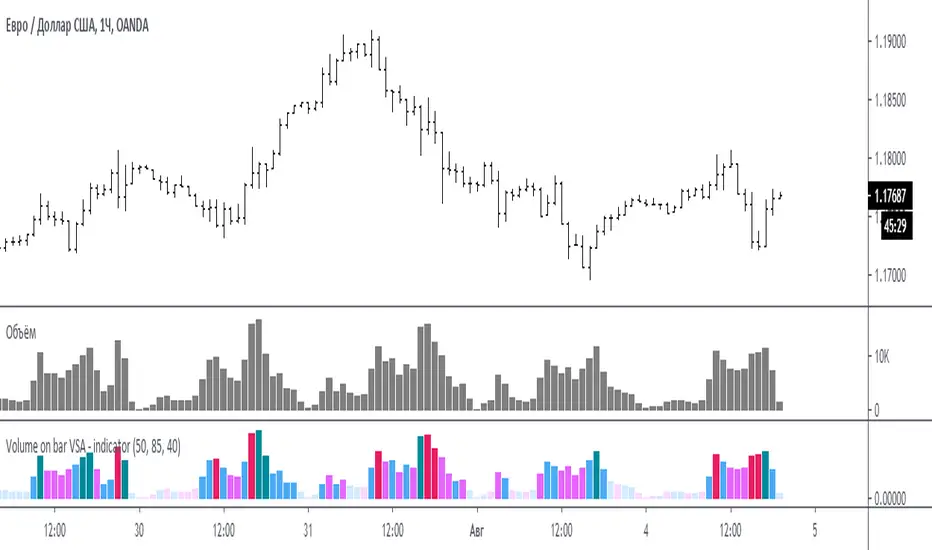
Volume on bar VSA - signal V2Google translate.
This indicator marks bars on the chart with high and medium volumes. The direction of the effort depends on whether the tail is on the bar, bullish or bearish.
In the settings you can set (sensitivity) for tinting volumes of high and medium
This indicator highlights volumes just like here
Этот индикатор помечает бары на графике с повышенными и средними объемами. Направление усилия зависимости от того какой хвост на баре, бычий или медвежий.
В настройках можно задать (чувствительность) для подкрашивания объемов повышенных и средних.
Этот индикатор выделяет объемы точно также как

Volume on bar VSA - indicator V2Google translate.
This indicator compares the volume with its average value and tints it depending on whether the tail on the bar is bullish or bearish.
In the settings you can set (sensitivity) for tinting volumes of high and medium
Этот индикатор сравнивает объем со средним его значением и подкрашивает его в зависимости от того какой хвост на баре, бычий или медвежий.
В настройках можно задать (чувствительность) для подкрашивания объемов повышенных и средних
Candles for VSACandles in which the open is equal to the previous close. (For VSA theory)
Свечи в которых открытие равно предыдущему закрытию. (Сделано для анализа по ВСА).

DeltalexИндикатор связывает спред (momentum=1) и объем. Если они большие на конкретном баре, то индикатор будет повышенным.
Также учитывается хвосты продаж и покупок. Например спред положительный, объем тоже, но хвост покупок составляет всего 10% от диапазона изменения цены на баре, тогда индикатор будет умножен на эти 10%, тем самым уменьшив его и показывая как бы, что да покупки есть но плохие.
Индикатор подкрашивается в зависимости от направления спреда, зелёный если momentum>1, красный если momentum<1
Скрип следует использовать с теорией VSA
Google translate:
The indicator connects spread (momentum = 1) and volume . If they are large on a particular bar, then the indicator will be raised.
The tails of sales and purchases are also taken into account. For example, the spread is positive, the volume is also, but the buy tail is only 10% of the price change range on the bar, then the indicator will be multiplied by these 10%, thereby decreasing it and showing, as it were, that there are but bad buys.
The indicator is colored depending on the direction of the spread, green if momentum> 1, red if momentum <1
Squeak should be used with VSA theory
