Intraday ORB-Anchored VWAP Structure [Arjo]Intraday ORB-Anchored VWAP Structure
This indicator is built for intraday traders. This tool helps them to see how the market is behaving today. It uses Opening Range, VWAP, and commonly used reference levels to show the market's general direction.
It will not tell you exactly when to buy or sell. Instead, it provides a clear picture of the market so you can make better decisions on your own.
What This Indicator Does
1. Defines the Trading Session
The indicator works only during the selected intraday session (for example, the Indian market). All levels reset automatically at the start of each new trading day.
2. Calculates the Opening Range (ORB)
The Opening Range is the high and low formed during the first few minutes of the session (e.g., first 15 minutes). This range helps identify early market direction.
3. Determines Early Directional Bias
After the Opening Range ends, a smooth trend filter (using a smooth function) evaluates whether price behavior is more bullish or bearish.
This step is used only to decide where VWAP should be anchored , not to generate signals.
4. Anchors VWAP from the Opening Range
If early price behavior is bullish, VWAP is anchored from the Opening Range High
If early price behavior is bearish, VWAP is anchored from the Opening Range Low
5. Plots Important Reference Levels
Previous Day High (PDH) and Low (PDL)
Central Pivot Range (TC, PP, BC)
Opening Range High and Low
Optional Opening Range box
Anchored VWAP for the current session only
How You Can Use This Indicator
Use Opening Range High and Low to understand where the market found early support and resistance.
Observe how price behaves relative to the anchored VWAP :
Staying above VWAP suggests intraday strength
Staying below VWAP suggests intraday weakness
Use PDH, PDL, and CPR levels as reference zones where price may react.
Combine these levels with your own entry rules, confirmation tools, and risk management.
Notes
This indicator is a visual reference and structure tool only.
It does not predict price, provide trade calls, or guarantee outcomes .
All calculations are non-repainting once the Opening Range is complete.
Designed for educational, discretionary, and semi-systematic intraday analysis.
Disclaimer:
This script is intended for market analysis and educational purposes only . Trading involves risk, and users are responsible for their own trading decisions.
Happy Trading
Volume Weighted Average Price (VWAP)

Intraday Sentiment DynamicsThe purpose of this script is to create a structured model of intraday sentiment by analyzing how price behaves relative to VWAP. Instead of treating VWAP deviation as a simple overbought or oversold measure, the script aims to understand the dynamics behind that deviation — how quickly sentiment is shifting, whether that shift is strengthening or weakening, and when abrupt changes in behaviour occur. Its goal is to provide a standardized, volatility‑adjusted framework that helps traders identify trend continuation, trend exhaustion, mean‑reversion setups, and early regime shifts.
To achieve this, the script begins by calculating the difference between the bar’s midpoint and VWAP. This raw deviation is then standardized using a rolling mean and standard deviation, producing a z‑score that expresses how far price is from VWAP in statistical terms. Standardization removes volatility bias, session drift, and asset‑specific scaling issues, making the signal comparable across different market conditions. A weighted moving average smooths this standardized deviation to reduce noise and prepare it for slope‑based analysis.
The core of the script is a slope‑normalization mechanism that measures how the standardized VWAP deviation changes over time. For each bar, the script computes the slope over a user‑defined length, separates positive and negative slope events, and maintains these in arrays that track their recent behaviour. From these arrays, it calculates average magnitudes and standard deviations, allowing it to normalize the current slope into a consistent, volatility‑adjusted scale. This ensures that both small and extreme slope events are interpreted meaningfully.
This normalization function is applied recursively to generate three higher‑order derivatives. The first derivative, velocity, represents the rate at which sentiment is moving toward or away from VWAP. The second derivative, acceleration, measures whether this movement is strengthening or weakening. The third derivative, jerk, captures sudden changes in acceleration and serves as an early indicator of shifts in market behaviour. Together, these derivatives form a multi‑layered behavioural model that reveals the internal structure of intraday sentiment.
The script visualizes these components using distinct color families and filled regions that highlight positive and negative behaviour. Background shading reinforces the dominant direction of each derivative, making it easy to see when sentiment is building, fading, or reversing. The standardized VWAP deviation is plotted alongside these derivatives, and horizontal lines at ±1, ±2, and ±3 standard deviations provide a statistical frame of reference for identifying extreme conditions.
In practical trading terms, the indicator helps identify strong continuation environments when velocity, acceleration, and jerk align in the same direction. It highlights early signs of trend exhaustion when jerk flips before acceleration, often preceding reversals. It supports mean‑reversion trades when VWAP deviation reaches extreme levels and the derivative chain begins to weaken. It also detects regime shifts when jerk spikes, helping traders avoid traps during sudden liquidity events or fake breakouts. By converting VWAP deviation into a structured, derivative‑based model, the script provides a clear and actionable view of intraday sentiment dynamics.

Smart Impulse PRO v1.0Smart Impulse PRO (Invite‑Only) — Comprehensive Guide for TradingView
***
## English Version
Smart Impulse PRO (Invite‑Only) — Comprehensive Guide for TradingView
Strategy Concept & Uniqueness
Smart Impulse PRO is a trend‑following impulse continuation strategy built specifically for volatile crypto pairs . It uses a custom price×volume impulse signal normalized with Z‑score , then filters these impulses through multi‑timeframe trend conditions and a layered guard system that blocks structurally weak trades (flat, overextension, exhaustion).
Backtest Summary (Crypto Pairs)
Smart Impulse PRO was backtested on several volatile crypto perpetual pairs (including ETHUSDT, BTCUSDT and other majors/alts) on 1h charts in the period 01 Jan 2023 – 26 Dec 2025. On this sample, typical results were:
- Total trades per pair : ≈100–130
- Win rate range : ≈ 90–94%
- Profit factor range : ≈ 3.0–3.9
These values are historical backtest metrics on specific symbols and settings and do not guarantee similar performance in the future .
Why It’s Special
✅ Custom price×volume impulse model (Z‑score‑based) : Measures how unusual each bar’s move is in its recent context, not just simple MA/RSI crossovers
✅ 15+ Exhaustion & Structure Guards : Automatically block bad contexts (flat, low vol, overextended candles, climax volume)
✅ Dynamic TP Grid : Take‑profit levels adapt to current impulse strength |Z|
✅ Visual Transparency : Bubbles show exactly why signals were blocked
✅ Invite‑Only Logic : The concrete impulse model and guard interactions are proprietary and therefore published as invite‑only with protected source, as allowed by TradingView’s script rules.
***
### 1. What the Script Does (User View)
Smart Impulse PRO acts as an automated decision engine for volatile crypto pairs (e.g., ETHUSDT, BTCUSDT) on intraday and swing timeframes (15m–4h). It:
- Generates Long/Short entries only when both trend and impulse conditions align.
- Manages exits with a multi‑level TP grid, breakeven logic, optional trailing stop and time‑based exit.
- Visually shows both taken trades and blocked signals , including a short text reason for rejection.
This lets users trade crypto trends with a clear explanation of when and why the strategy chooses to act or stay out.
***
Entry Rules
Long (Buy):
Price is above EMA200 (long‑term trend is up)
Z‑score impulse > Z_threshold (e.g., 1.5)
Volume above recent average
ADX > Min ADX (e.g., 25)
ATR regime OK (ATR > ATR_floor and not in volatility squeeze)
All active guards pass (no overextended candle, no extreme wick against direction, no climax volume lock, no distance violation vs EMA200/VWAP, no Z‑streak lock)
Short (Sell):
Price is below EMA200 (long‑term trend is down)
Z‑score impulse > Z_threshold
Volume above recent average
ADX > Min ADX
ATR regime OK
All active guards pass (same checks, mirrored for shorts)
Logic:
The script first checks that the market is trending (EMA200 side + ADX + volatility filters), then validates that the current bar is a statistically strong price×volume impulse, and finally makes sure the bar is not an exhaustion spike or overextended move according to the guard system. Only if all three layers agree, a trade is opened.
Exit Rules
Stop‑Loss:
Initial stop‑loss is placed at a user‑defined distance (percent or ATR‑based), and position size is calculated so that a full stop equals Max Risk per Trade (%).
Take‑Profit grid:
Up to 10 TP levels.
Step type: Percent, ATR% or Hybrid.
Optional “Breathing grid”: TP distances are increased in proportion to |Z‑score| at entry (capped), so stronger impulses receive wider, more ambitious targets.
TP Profile (Equal / Aggressive / Balanced / Defensive) decides how much size is closed at each level.
Breakeven and Trailing:
Optional breakeven: after TP1 is hit, stop can be moved to entry price plus a small offset.
Optional ATR‑based trailing stop activates only after TP3 to avoid being shaken out too early by noise.
Time‑based Exit:
If enabled, any open trade that does not hit TP or SL within the chosen time limit (bars or minutes) is closed at market, to avoid very long, stagnant positions.
### 2. How the Script Works (Internals)
2.1 Impulse Engine (Custom Z‑Score Model)
At the core is a price×volume impulse series with Z‑score normalisation:
- Raw impulse:
`delta_impulse = (close - close ) * volume`
- Normalisation over N bars (default N = 20):
`zscore = (delta_impulse - avg(delta_impulse, N)) / stdev(delta_impulse, N)`
A bar becomes an impulse candidate only when:
- `abs(zscore) > Z_threshold` (default 1.5), and
- volume is above its recent average.
This is a custom implementation of a price×volume impulse model based on Z‑score; the exact combination of inputs, window, thresholds and how this signal feeds guards and exits is part of the proprietary logic.
2.2 Trend & Volatility Context — Why the Mashup Exists
The strategy combines several classic tools, but each covers a specific failure mode. The mashup is intentional:
| Component | What it checks | Why it is needed |
|----------|----------------|------------------|
| EMA200 | Long‑term bias (price above/below) | Prevents counter‑trend trading |
| EMA200 slope | Steepness of EMA over K bars | Filters flat/ranging phases even above/below EMA |
| VWAP | Distance of price from volume‑weighted fair value | Avoids entering when price is far from value (overextension) |
| ADX | Trend strength | Disables signals in low‑trend, choppy markets |
| ATR vs AvgATR50 | Current volatility vs recent average | Detects volatility squeezes and abnormally calm regimes |
| ATR% floor (Anti‑Flat Gate) | ATR as % of price | Hard “no‑trade” mode in ultra‑tight ranges |
An impulse alone is not sufficient in crypto; only impulses inside a suitable trend and volatility context are allowed to become trades.
2.3 Guard System (Exhaustion & Overextension)
Above trend filters, Smart Impulse PRO adds a guard layer designed from typical crypto problems (late entries, news spikes, “buying the top”):
- Max body / ATR : Rejects abnormally large real bodies (e.g., body > 3× ATR), often at the end of a move.
- Max range / ATR : Blocks extremely long high‑low bars.
- Upper/lower wick filters :
- Longs blocked when upper wick dominates (rejection from above).
- Shorts blocked when lower wick dominates (rejection from below).
- Z‑streak guard : After several consecutive impulse bars in the same direction, new entries in that direction are disabled to avoid chasing.
- Climax volume + cool‑off : When volume spikes above a multiple of its recent average, new trades are paused for N bars.
- Distance guards : Excessive distance (in ATR multiples) from EMA200 and VWAP can block trades.
These checks interact with the impulse model so that the final decision reflects a coherent risk framework rather than a loose collection of filters.
2.4 Dynamic TP Grid (Exit Logic)
- Up to 10 TP levels; step type: Percent, ATR% or Hybrid.
- With Breathing grid , TP spacing is increased by a factor of `k * abs(zscore)` (capped) at entry.
- Stronger impulses (higher |z|) → wider distances between TP levels; weaker impulses → tighter TP spacing.
- TP profiles (Equal / Aggressive / Balanced / Defensive) control how much position size is allocated to early vs late targets.
- Optional breakeven: move SL to entry (plus offset) after TP1.
- Optional trailing: ATR‑based trailing stop activates after TP3.
This links entry strength and exit geometry using the same impulse signal.
***
### 3. How to Use the Script (Practical Guide)
3.1 Quick Start
1. Add Smart Impulse PRO to a volatile crypto pair (e.g., ETHUSDT, BTCUSDT) on 15m–4h.
2. Keep the default preset and observe executed trades and blocked bubbles.
3. Use the dashboard to see which filters are active and which ones are blocking most trades (e.g., ADX, Flat, Exhaust).
4. If there are too few trades, gradually lower Z_threshold or Min ADX , or slightly relax guard limits — change one parameter at a time .
5. Set Max Risk per Trade (%) , stop distance, TP count/profile and optional trailing in line with your risk tolerance.
3.2 Example Profiles
- Aggressive intraday (15m)
- Z‑threshold 1.2
- Min ADX 20
- ATR% floor 0.2%
- Some exhaustion guards disabled (e.g., less strict wick limits).
- Conservative swing (1h–4h)
- Z‑threshold 1.5
- Min ADX 25–30
- ATR% floor 0.3–0.4%
- All guards enabled, higher‑timeframe filters ON.
3.3 Risk Management & Position Sizing
- Max Risk per Trade (%) — percentage of equity at risk if the full stop‑loss is hit.
- Position size is computed automatically from Max Risk %, stop distance and instrument price.
- Breakeven and trailing can be enabled to reduce open risk after partial profit is taken.
- Time‑based exit closes trades that stay open beyond a user‑defined duration without reaching TP or SL.
3.4 Alerts
Alerts use `strategy.order.alert_message` to send JSON containing side (long/short), entry, stop and TP levels. This allows users to connect the strategy with external bots or dashboards without exposing internal code.
***
### 4. Why This Script Is Invite‑Only (Originality Justification)
TradingView asks invite‑only scripts to explain why their logic is original and why source protection is justified. Smart Impulse PRO does that by:
- Implementing a custom price×volume impulse model based on Z‑score normalisation and integrating it with exits through the breathing TP grid.
- Using a coordinated guard framework that explicitly targets typical crypto issues (late chase entries, overextension vs VWAP/EMA200, volatility squeezes, volume spikes).
- Providing a structured indicator mashup where EMA200, VWAP, ADX, ATR and Anti‑Flat Gate each address different dimensions (trend, volatility, structure) and are designed to work together as a context gate for the impulse signal.
On ETHUSDT, BTCUSDT and a group of other volatile crypto pairs, Smart Impulse PRO showed approximately 90–94% win rate and profit factor above 3.0 in 2023–2025 backtests under default risk and filter settings. These numbers are illustrative only and do not promise or guarantee similar live results.
Risk Disclaimer
Trading cryptocurrencies involves substantial risk. Backtests are hypothetical and assume perfect execution without additional slippage, liquidity constraints or exchange issues. Always test the strategy on your own symbols and timeframes and keep risk per trade at a level you are comfortable with.
FAQ
Q: Does the strategy guarantee profit?
A: No. It is a rule‑based decision engine; all results depend on market conditions, parameters and execution, and backtests do not guarantee future performance.
Q: Can I use it on any crypto pair?
A: The logic is designed for volatile crypto pairs. It has been backtested on ETHUSDT, BTCUSDT and several other majors/alts, but each symbol should be tested and, if needed, re‑tuned by the user.
Q: Which timeframe is best?
A: The engine is intended for intraday and swing charts between 15m and 4h. Lower timeframes will generally produce more signals and more noise; higher ones will produce fewer, slower signals.
Q: Can I disable some filters or guards?
A: Yes. Trend filters, the Anti‑Flat Gate and most exhaustion guards can be turned on or off. It is recommended to change one setting at a time and monitor how it affects blocked signals and the equity curve.
Q: How are alerts meant to be used?
A: Alerts send a JSON payload with side, entry, stop and TP levels via strategy.order.alert_message, so users can connect the strategy to external bots or dashboards if they wish.
***
## Русская версия
Smart Impulse PRO (по приглашению) — Полное руководство для TradingView
Концепция и уникальность
Smart Impulse PRO — стратегия продолжения импульсов, разработанная под волатильные криптовалютные пары . В ней используется пользовательская модель импульса “цена×объём”, нормализованная через Z‑score , после чего такие импульсы проходят фильтрацию по тренду на разных таймфреймах и через каскад гардов, блокирующих слабые и рискованные сетапы (флэт, перетянутость, истощение).
Сводка тестов (крипто‑пары)
Стратегия тестировалась на нескольких волатильных крипто‑парах (перпетуальные контракты, включая ETHUSDT, BTCUSDT и ряд других мейджоров/альтов) на часовом таймфрейме за период 01.01.2023 – 26.12.2025. Типичные значения по этим тестам:
- Количество сделок на пару : ≈100–130
- Диапазон винрейта : ≈ 90–94%
- Диапазон фактора прибыли : ≈ 3.0–3.9
Это результаты тестов на истории по конкретным инструментам и настройкам и не гарантируют такой же доходности в будущем .
Почему она оригинальная
✅ Пользовательская модель импульса цена×объём (Z‑score) : измеряет “редкость” бара в его статистическом окружении, а не просто пересечение стандартных индикаторов
✅ 15+ гардов : системно защищают от догоняния, пампов, торговли в “пиле” и на перетянутых уровнях
✅ “Дышащая” TP‑сетка : цели автоматически подстраиваются под силу текущего импульса |Z|
✅ Прозрачность : пузырьки показывают причины каждого отказа от сделки
✅ Формат по приглашению : логика импульса и взаимодействие гардов публикуются как закрытый скрипт с Invite‑Only доступом, что соответствует правилам TradingView.
***
### 1. Что делает скрипт (для пользователя)
Smart Impulse PRO выступает как движок принятия решений для торговли волатильными крипто‑парами (ETHUSDT, BTCUSDT и др.) на таймфреймах от 15 минут до 4 часов:
- Открывает лонги/шорты только при одновременном совпадении трендовых и импульсных условий.
- Управляет выходом через многоуровневую сетку TP, безубыток, по желанию — трейлинг‑стоп и тайм‑стоп.
- Отображает как реальные сделки , так и отклонённые сигналы с короткой подписью причины блокировки.
Задача — структурировать трендовую торговлю криптой и сделать логику решений максимально понятной.
***
### 2. Как работает скрипт (внутренняя логика)
2.1 Импульсное ядро (кастомная модель на Z‑score)
В основе лежит ряд дельта×объём :
- Сырой импульс:
`delta_impulse = (close - close ) * volume`
- Нормализация по окну N баров (по умолчанию 20):
`zscore = (delta_impulse - среднее(delta_impulse, N)) / стд(delta_impulse, N)`
Бар считается кандидатом на импульс , только если:
- `abs(zscore) > Z_threshold` (по умолчанию 1.5);
- объём выше своей недавней средней.
Это собственная реализация импульсного сигнала цена×объём , нормализованного по Z‑score; выбор входных данных, окна, порогов и связка с гардами и выходами формируют проприетарную часть стратегии.
2.2 Зачем нужен “мэшап” индикаторов (тренд и волатильность)
Комбинация EMA200, VWAP, ADX, ATR и Anti‑Flat Gate собрана так, чтобы каждый компонент покрывал отдельный вид риска:
| Компонент | Что проверяет | Зачем нужен |
|----------|---------------|------------|
| EMA200 | Долгосрочный уклон (цена выше/ниже) | Защита от контртрендовых входов |
| Наклон EMA200 | Наклон за K баров | Отсекает участки со слабым трендом (флэт) |
| VWAP | Удалённость цены от “центра объёма” | Не даёт входить в явной перетянутости от справедливой цены |
| ADX | Силу тренда | Запрещает торговлю в пиле и боковике |
| ATR vs AvgATR50 | Текущую волатильность к средней | Находит режимы сжатия и аномально низкой волатильности |
| ATR% пол (Anti‑Flat Gate) | ATR в % от цены | Жёсткий запрет торговли в очень узком диапазоне |
Импульс может быть сильным, но без нормального тренда и адекватной волатильности сделка не допускается.
2.3 Система гардов (истощение, перетянутость)
- Макс тело/ATR : слишком большая свеча относительно ATR трактуется как возможное окончание движения.
- Макс диапазон/ATR : блокирует экстремальные по размеру бары.
- Фильтры по хвостам :
- Лонги блокируются при доминирующем верхнем хвосте (отторжение сверху).
- Шорты — при доминирующем нижнем хвосте.
- Z‑streak : после серии импульсных баров в одну сторону новые входы по этому направлению отключаются.
- Climax‑объём + пауза : при объёме выше кратности к средней входы на несколько баров ставятся на паузу.
- Дистанционные гарды : чрезмерное удаление цены от EMA200 и VWAP в ATR‑мультипликаторах может блокировать вход.
Эти условия работают совместно с импульсным ядром и трендовыми фильтрами, формируя связанную модель риска.
2.4 Динамическая TP‑сетка
- До 10 тейк‑профитов; шаг — в %, ATR% или гибридный.
- При включённой опции “Breathing grid” шаг между TP увеличивается пропорционально `|zscore|` (в пределах лимита).
- Сильные импульсы → более широкая сетка и шанс забрать длинное движение, слабые → более плотная сетка.
- Профили TP (равный / агрессивный / сбалансированный / защитный) задают распределение объёма между ближними и дальними целями.
- Можно включить перевод стопа в безубыток после TP1 и трейлинг‑стоп по ATR после TP3.
***
### 3. Как использовать стратегию (практика)
3.1 Быстрый старт
1. Откройте график волатильной крипто‑пары (ETHUSDT, BTCUSDT и т.п.) на ТФ 15m–4h и добавьте стратегию.
2. Оставьте настройки по умолчанию и наблюдайте маркеры сделок и пузырьки отклонённых сигналов.
3. Через дашборд смотрите, какие фильтры чаще всего блокируют сделки (ADX, Flat, Exhaust и др.).
4. Если сделок мало, по шагу снижайте порог Z‑score или ADX либо ослабляйте некоторые гарды — всегда меняйте только один параметр за раз.
5. Настройте Max Risk per Trade , размер стопа, количество и профиль TP, а также при необходимости безубыток и трейлинг‑стоп.
3.2 Типовые профили
- Агрессивный скальпинг (15m)
- Z‑порог 1.2
- ADX min 20
- ATR% пол 0.2%
- Несколько гардов истощения отключены.
- Консервативный свинг (1h–4h)
- Z‑порог 1.5
- ADX min 25–30
- ATR% пол 0.3–0.4%
- Все гарды включены, HTF‑фильтры активны.
3.3 Риск и размер позиции
- Max Risk per Trade (%) задаёт долю капитала, которую допускается потерять при полном срабатывании стоп‑лосса.
- Стратегия рассчитывает размер позиции из риска, стопа и цены инструмента.
- Можно включить перевод стопа в безубыток после TP1 и трейлинг‑стоп после TP3.
- Тайм‑стоп закрывает сделки, которые слишком долго остаются открытыми без достижения TP/SL.
3.4 Алерты
Алерты формируют JSON‑строку с направлением, ценой входа, стопом и всеми TP‑уровнями через `strategy.order.alert_message`. Это позволяет подключать внешние боты и панели без раскрытия кода.
***
### 4. Почему скрипт по приглашению (обоснование оригинальности)
Стратегия не сводится к “набору индикаторов на графике”. Формат Invite‑Only обоснован тем, что в коде реализованы:
- Пользовательская модель импульса цена×объём на базе Z‑score и использование этого же сигнала для адаптивной TP‑геометрии.
- Связанный набор гардов , построенный вокруг реальных проблем крипто‑торговли (поздние входы после пампов, перетянутость от VWAP/EMA200, режимы сжатия, всплески объёма).
- Логика мэшапа : EMA200, VWAP, ADX, ATR и Anti‑Flat Gate работают согласованно как фильтр контекста для импульса, а не как независимые визуальные индикаторы.
На ETHUSDT, BTCUSDT и ряде других крипто‑пар Smart Impulse PRO показывала ≈90–94% винрейт и фактор прибыли выше 3.0 в тестах 2023–2025 годов при стандартных настройках фильтров и риска. Эти значения служат иллюстрацией поведения стратегии в прошлом и не являются обещанием аналогичных результатов в реальной торговле.
Предупреждение о рисках
Торговля криптовалютами связана с повышенным риском. Результаты бэктестов гипотетичны и предполагают идеальное исполнение без дополнительного проскальзывания и проблем с ликвидностью. Перед использованием стратегии на реальном счёте протестируйте её на своих инструментах и выбирайте риск на сделку в соответствии с личной толерантностью к убыткам.
FAQ
В: Гарантирует ли стратегия прибыль?
О: Нет. Это набор правил для принятия решений; результат зависит от рынка, настроек и исполнения. Любые бэктесты не гарантируют такую же доходность в будущем.
В: Можно ли использовать её на любой крипто‑паре?
О: Логика рассчитана на волатильные криптовалютные пары. Стратегия тестировалась на ETHUSDT, BTCUSDT и нескольких других мейджорах/альтах, но для каждого инструмента параметры желательно проверить и при необходимости подстроить.
В: Какой таймфрейм предпочтителен?
О: Стратегия рассчитана на внутридневную и свинговую торговлю в диапазоне 15m–4h. На младших ТФ сигналов больше и шума выше; на старших — сигналов меньше, но они формируются медленнее.
В: Можно ли отключать отдельные фильтры и гарды?
О: Можно. Трендовые фильтры, Anti‑Flat Gate и большинство гардов истощения включаются и выключаются отдельно. Рекомендуется менять настройки по одной и смотреть, как это влияет на заблокированные сигналы и кривую капитала.
В: Для чего нужны алерты?
О: Алерты отправляют JSON‑сообщение с направлением, ценой входа, стопом и уровнями TP через strategy.order.alert_message, что позволяет при желании подключать внешних ботов и панели управления риском.

VORB DJB Trades V1VORB by DJB Trades (Version 1) is a complete intraday framework built around the New York session Opening Range Breakout (ORB), combined with higher-timeframe VWAPs and precise Fair Value Gap mapping.
This tool is designed to give you context, levels and confluence at a glance – no more stacking 5 different indicators on your chart.
🔶 Core ORB Logic (NY Session)
• Uses the 09:30–09:45 NY time 15-minute ORB range.
• Draws an ORB box from high to low during the ORB window.
• Projects clean high/low ORB lines across the session (up to your chosen end time, default 18:00 NY).
• Displays the ORB size in points above the box
• 1 point = 4 ticks (futures-style logic).
This gives an instant sense of how “wide” or “tight” the opening drive was, and how much room you have for trend or mean-reversion plays.
📐 Daily VWAP (Intraday Bias)
• Custom anchor time (default 18:00, NY session close style).
• Plots Daily VWAP plus +/-1 standard deviation bands.
• Full styling controls: colors, line widths, band fill etc.
• You can limit visibility to specific timeframes via dropdown (e.g. only show on 1–5m, or just intraday).
VWAP +/-1 deviation bands gives you intraday bias and “fair value” zones to frame trades around the ORB.
🕒 Higher Timeframe VWAPs (Weekly, Monthly, Yearly)
All three higher-TF VWAPs are calculated the same way (volume-weighted, streaming) but anchored at different structural points:
• Weekly VWAP – resets at the start of each week
• Monthly VWAP – resets at the start of each month
• Yearly VWAP – resets at the start of each year
Each has:
• Main VWAP line
• ±/-1 standard deviation bands
• Independent color / width / band fill settings
• Timeframe visibility controls (“show from TF” & “show up to TF”) so you can do things like:
⁃ Weekly VWAP only from 5m and above
⁃ Monthly on 1h and higher
⁃ Yearly only on Daily/Weekly/Monthly
Use these as higher-timeframe bias references and key dynamic value areas above/below the ORB.
📊 1m FVGs (Outside ORB & VWAP Bands)
For precision entries:
• Detects 1-minute Fair Value Gaps (classic 3-candle pattern):
⁃ Bullish FVG: low > high
⁃ Bearish FVG: high < low
• Only plots FVGs that are:
⁃ Outside the ORB range, and
⁃ Outside the Daily VWAP +/-1 bands
• FVG boxes are auto-extended to the right (4× original width) for clear “liquidity pockets”.
• Separate colors for bullish and bearish FVGs.
This helps you focus only on “clean” imbalances away from the opening chop and mid-range value.
⚙️ Customisation & Use
• Works best on US indices, FX and futures during the NY session.
• Optimised for 1m–15m ORB trading, but higher-TF VWAPs shine on 5m, 15m, 1h and Daily.
• Every visual element (ORB box, lines, VWAPs, bands, FVGs, label text/bg) is fully customisable in the settings.
⚠️ Disclaimer
This script is for educational and informational purposes only.
It does not constitute financial advice or a signal service.
Always test on a demo account and use your own risk management before trading live.


Trend Speed & ALMA vs VWAP Oscillator# Trend Speed ALMA VWAP Oscillator (TSAV Osc)
## Overview
The **Trend Speed ALMA VWAP Oscillator** is a MACD-style oscillator that combines three powerful concepts: the Trend Speed Analyzer's dynamic EMA, ALMA (Arnaud Legoux Moving Average) bands, and Volume Weighted Average Price (VWAP). It measures trend strength and momentum relative to VWAP, providing clear visual signals for trend direction and potential reversals.
## Key Features
- **MACD-Style Display**: Familiar oscillator layout with lines, signal lines, and histogram
- **Multiple VWAP Types**: Session, Rolling (1-24 hours), and Weekly anchored VWAP
- **Dynamic Trend Analysis**: Adaptive EMA with acceleration factor from Trend Speed Analyzer
- **ALMA Band Integration**: Fast and slow ALMA for crossover signals
- **Chart Overlay**: Optional plots of Dynamic Trend, VWAP, and ALMA bands on price chart
- **VWAP Standard Deviation Bands**: +/- 1, 2, 3 standard deviation bands
## Indicator Components
### Oscillator Pane
| Component | Description |
|-----------|-------------|
| **Trend vs VWAP Line** | Distance between Dynamic Trend EMA and VWAP (blue) |
| **Trend Signal Line** | EMA of Trend vs VWAP for crossover signals (cyan) |
| **ALMA vs VWAP Line** | Distance between fast ALMA and VWAP (orange) |
| **ALMA Signal Line** | EMA of ALMA vs VWAP (yellow) |
| **Histogram** | Configurable: Trend Strength, Trend vs VWAP, or ALMA vs VWAP |
| **Zero Line** | White reference line at zero (VWAP level) |
### Chart Overlay (Optional)
| Component | Description |
|-----------|-------------|
| **Dynamic Trend** | Dotted line colored by histogram gradient |
| **VWAP** | Thick solid line, green above/red below trend |
| **VWAP Bands** | Standard deviation bands (+/- 1, 2, 3 std) |
| **ALMA Bands** | Fast and slow ALMA with optional fill |
### Signal Markers
| Signal | Shape | Meaning |
|--------|-------|---------|
| **Triangle Up** (green) | Bottom | Trend vs VWAP crossed above signal line |
| **Triangle Down** (red) | Top | Trend vs VWAP crossed below signal line |
| **X Cross** (green) | Zero line | Dynamic Trend crossed above VWAP |
| **X Cross** (red) | Zero line | Dynamic Trend crossed below VWAP |
| **Circle** (green) | Oscillator | ALMA bullish cross (configurable source) |
| **Circle** (red) | Oscillator | ALMA bearish cross (configurable source) |
| **Background Highlight** | Full bar | Ideal entry condition met |
## VWAP Types
### Session VWAP
Resets at a configurable anchor time (default 9:30 AM EST). Best for intraday trading with regular market hours.
### Rolling VWAP
Uses a moving window of 1, 2, 3, 4, 8, 12, or 24 hours. Best for continuous markets or when you want a shorter-term volume-weighted reference.
### Weekly VWAP
Resets at the start of each trading week using `timeframe.change("W")`. Works across all market types:
- **Stocks**: Resets Monday morning
- **Futures**: Resets at futures week open
- **Crypto**: Resets at calendar week start
## Settings Guide
### VWAP Settings
- **VWAP Type**: Session, Rolling, or Weekly
- **Anchor Time**: Reset time for Session VWAP (EST timezone)
- **Rolling Period**: Window size for Rolling VWAP
- **VWAP Source**: Price source for VWAP calculation (default: hlc3)
### Trend Speed Settings
- **Maximum Length**: Upper limit for dynamic moving average (default: 50)
- **Accelerator Multiplier**: Responsiveness to price changes (default: 5.0)
- **Speed Smoothing**: Hull MA period for speed smoothing (default: 5)
### ALMA Settings
- **ALMA 1 (Fast)**: Length, Offset, Sigma for fast ALMA
- **ALMA 2 (Slow)**: Length, Offset, Sigma for slow ALMA
### MACD Settings
- **Signal Line Length**: EMA period for signal lines (default: 9)
### Display Settings
- **Histogram Source**: Choose what the histogram displays
- **ALMA Cross Source**: "ALMA Bands" (ALMA1 vs ALMA2) or "Oscillator Signal" (vs signal line)
- **Show/Hide**: Toggle individual components
### Chart Overlay
- **Show Dynamic Trend**: Dotted trend line on chart
- **Show VWAP**: Thick VWAP line on chart
- **Show VWAP Std Dev Bands**: +/- 1, 2, 3 standard deviation bands
- **Show ALMA Bands**: ALMA1 and ALMA2 on chart
- **Show ALMA Fill**: Fill between ALMA bands
## Trading Guidelines
### Bullish Signals
1. Trend vs VWAP line crosses above signal line (triangle up)
2. Dynamic Trend crosses above zero/VWAP (green X)
3. ALMA bullish cross (green circle)
4. **Ideal Long**: All three align with positive histogram
### Bearish Signals
1. Trend vs VWAP line crosses below signal line (triangle down)
2. Dynamic Trend crosses below zero/VWAP (red X)
3. ALMA bearish cross (red circle)
4. **Ideal Short**: All three align with negative histogram
### Reading the Histogram
- **Bright Green**: Strong bullish momentum (trend accelerating up)
- **Light Green**: Weak bullish momentum (trend slowing)
- **Light Red**: Weak bearish momentum (trend slowing)
- **Bright Red**: Strong bearish momentum (trend accelerating down)
### VWAP as Support/Resistance
- Price above VWAP with positive oscillator = bullish bias
- Price below VWAP with negative oscillator = bearish bias
- Oscillator crossing zero = potential trend change at VWAP
## Installation
1. Copy the source code from `trend-speed-alma-vwap-oscillator.pine`
2. Open TradingView's Pine Editor
3. Paste the code and click "Add to Chart"
4. Configure settings based on your trading style
## Files Included
- `trend-speed-alma-vwap-oscillator.pine` - Main indicator implementation
- `README.md` - This documentation file
## Based On
- **Trend Speed Analyzer** by Zeiierman - Dynamic EMA and speed calculations
- **ALMA** (Arnaud Legoux Moving Average) - Built-in TradingView function
- **VWAP** - Volume Weighted Average Price with custom anchoring
## Disclaimer
Trading involves substantial risk of loss and is not suitable for all investors. Past performance is not indicative of future results. This indicator is for educational purposes only and should not be considered as investment advice.

[ASFX] Free Automatic VWAPsAutomatic VWAP & Key Levels
Overview
This indicator is designed to help traders evaluate VWAP interactions in context, rather than treating every VWAP touch as a trade opportunity. It combines VWAP with a momentum-based directional filter to highlight situations where price interaction with VWAP is supported by broader intraday momentum. This indicator also shows you the initial balance and opening range each day.
Concept and Originality
VWAP is commonly used as an institutional reference level, but VWAP alone does not distinguish between meaningful acceptance/rejection and random intraday chop. This script addresses that limitation by conditioning VWAP interactions with a momentum filter. Signals are only displayed when price location and momentum alignment occur together, allowing traders to focus on higher-quality VWAP reactions instead of monitoring multiple indicators separately.
How It Works
• VWAP is used as the primary price reference level.
• A momentum filter evaluates directional bias and participation.
• Visual signals appear only when price is interacting with VWAP and momentum confirms acceptance or rejection in the same direction.
• No signals are shown during low-momentum or sideways conditions around VWAP.
How to Use
This indicator is best used as a confirmation tool, not as a standalone trading system. It is intended to assist traders in filtering VWAP-based trade ideas by highlighting when conditions are aligned versus when price is simply chopping around VWAP.
Markets and Timeframes
• Designed for index futures such as ES and NQ
• Optimized for intraday trading
• Works best on lower timeframes (1–5 minute charts)
Limitations
• Not predictive
• Not a complete trading strategy
• Does not replace price action analysis, trade management, or risk control
• Signals should be evaluated alongside market structure and context

Anchored VWAP ProAnchored VWAP Pro - Multi-Timeframe VWAP System with Advanced Signal Filters
Core Functionality:
Plots five anchored VWAPs (NY Open, HOD, LOD, Start-of-Day at 18:00 ET, Previous Day) with optional standard deviation bands and generates high-probability mean reversion signals.
Key Features:
Multiple VWAP Anchors: Tracks price equilibrium from critical intraday levels
Standard Deviation Bands: 3-level configurable bands for NYO and SOD VWAPs
Opening Range Breakout (ORB): Customizable period (5-60 min) with high/low/midpoint levels
Midnight Open Reference: Horizontal line marking 00:00 ET open price
Signal Generation:
Buy Signal: Price retraces to NYO/SOD VWAP support, then closes above HOD VWAP
Sell Signal: Price retraces to NYO/SOD VWAP resistance, then closes below LOD VWAP
Advanced Filters (Optional):
Midnight Open Bias: Mean reversion logic using midnight price position (bullish/bearish/neutral states)
A+ Setup Window: Time-based signal quality designation with custom colors
Formation Delay: Minimum time requirement since HOD/LOD formation
Daily Signal Limit: Caps maximum signals per session
Candle Quality: Body percentage and directional alignment requirements
True Retracement: Requires price bounce before validating retracement signals
Customization:
All colors, widths, and line styles fully configurable
Flexible time windows for signals and A+ setups
Toggle individual VWAPs and features independently
Comprehensive alert system with detailed context
Use Cases:
Intraday mean reversion trading, VWAP-based support/resistance, institutional price level tracking, multi-timeframe confluence analysis.

F&O Auto Option Chain Pro🎯 Auto Option Chain - Live NSE F&O Dashboard
Transform your options trading experience with instant access to complete option chain data - right on your TradingView charts!
---
✨ WHAT YOU GET
See the complete option chain whenever you're viewing NSE options. No setup required - it just works!
📊 Live Data Display:
• Last Traded Price (LTP) for all strikes
• Trading Volume in lots
• VWAP levels
• Intraday price changes
• Put-Call Ratio (PCR) analysis
• ATM strike highlighting
🎯 Two Ways to Use:
AUTO MODE - Zero Setup
Simply view any NSE option like NIFTY or BANKNIFTY options, and the complete chain appears instantly around your selected strike.
MANUAL MODE - Universal Access
Use on any chart - equity, index, or options. Just select your underlying symbol, expiry date, and reference strike.
---
💼 SUPPORTED MARKETS
✅ NSE Index Options
• NIFTY
• BANKNIFTY
• FINNIFTY
• MIDCPNIFTY
✅ NSE Stock Options (200+ symbols)
• RELIANCE, HDFCBANK, TCS, ICICIBANK
• SBIN, INFY, ITC, BHARTIARTL
• KOTAKBANK, HINDUNILVR, MARUTI
• AXISBANK, BAJFINANCE, TATAMOTORS
• WIPRO, LT, HCLTECH, SUNPHARMA
• And 180+ more popular F&O stocks!
All symbols work seamlessly with correct strike intervals.
---
🎨 CUSTOMIZATION
Dashboard Position:
Choose from 9 screen positions to keep your charts clean and visible
Visual Style:
• 4 font sizes for comfortable viewing
• Custom colors for ATM strikes
• Color-coded profit/loss indicators
• Adjustable transparency
Data Range:
Control how many strikes you want to see (up to 8 strikes above and below ATM)
---
🔥 PERFECT FOR
✓ Intraday Option Traders
See live premium changes and volume shifts in real-time
✓ Spread Builders
Compare multiple strikes instantly for Iron Condors, Butterflies, and other strategies
✓ Options Sellers
Track volume concentration and decay throughout the trading day
✓ Market Analysts
Study option flow patterns and Put-Call Ratios for sentiment analysis
✓ Swing Traders
Plan weekly positions with complete visibility of the option chain
✓ Scalpers
Quick strike selection with live data updates
---
💡 TRADING APPLICATIONS
🎯 Identify Key Levels
High volume strikes often act as support and resistance zones
📊 Sentiment Analysis
Put-Call Ratio shows whether traders are positioned bullish or bearish
⚡ Premium Tracking
Watch real-time option value changes during volatile market moves
🔍 Spread Trading
Visual comparison makes it easy to select optimal strike combinations
💰 Entry Point Selection
Compare multiple strikes before entering positions
🏦 Smart Money Tracking
VWAP reveals institutional trading levels
---
📱 HOW TO USE
Getting Started - Auto Mode:
1. Open any NSE option chart
2. Add "Auto Option Chain" indicator
3. Complete chain displays automatically
4. Start trading with full visibility!
Alternative - Manual Mode:
1. Open any NSE chart (index, equity, or option)
2. Add the indicator
3. Switch to Manual mode
4. Enter your symbol (e.g., NIFTY)
5. Set expiry date in YYMMDD format (e.g., 251226 for Dec 26, 2025)
6. Set approximate ATM strike
7. Option chain appears instantly!
---
🌟 KEY BENEFITS
✅ CONVENIENCE
No need to switch between TradingView and external option chain websites
✅ SPEED
Instant data updates with every price tick
✅ EFFICIENCY
All strikes visible at once - no scrolling through multiple pages
✅ ACCURACY
Real-time data synchronized with your chart timeframe
✅ SIMPLICITY
Works automatically on option charts, manually on others
✅ FLEXIBILITY
View option chains while analyzing spot/futures charts
✅ INSIGHT
PCR and volume data aid better trading decisions
---
⚠️ IMPORTANT INFORMATION
• Works exclusively with NSE options (Indian market)
• Data quality depends on your TradingView subscription
• Best performance on 1-minute to daily timeframes
• Displays up to 8 strikes on each side of ATM
• Requires active market hours for live data
---
🎓 TIPS FOR SUCCESS
💡 Start with Auto mode when trading specific options
💡 Use Manual mode for pre-market planning
💡 Adjust strike range based on market volatility
💡 Position dashboard where it doesn't block price action
💡 Monitor PCR for early sentiment shifts
💡 Track volume spikes for potential breakout levels
💡 Compare VWAP with LTP to gauge fair value
---
🏆 WHAT MAKES THIS DIFFERENT
Unlike basic option indicators that show single strikes or delayed data:
✅ Shows complete chain around ATM
✅ Updates in real-time with your chart
✅ Works automatically when viewing options
✅ Also works manually on any chart type
✅ Pre-configured for 200+ popular stocks
✅ Includes advanced metrics (PCR, VWAP, Volume in lots)
✅ Clean, professional interface
---
📈 REAL TRADER BENEFITS
"See the whole picture before entering trades"
Complete chain visibility helps you select optimal strikes
"No more tab switching"
Everything you need is right on your chart
"Faster decisions"
Instant data comparison across multiple strikes
"Better risk management"
Understand where volume and open interest are concentrated
"Professional-grade analysis"
Tools previously available only on premium platforms
---
🎯 IDEAL FOR THESE STRATEGIES
✓ Naked Call/Put selling
✓ Covered Calls
✓ Protective Puts
✓ Bull/Bear Call Spreads
✓ Bull/Bear Put Spreads
✓ Iron Condors
✓ Iron Butterflies
✓ Straddles
✓ Strangles
✓ Calendar Spreads
✓ Ratio Spreads
---
⭐ YOUR SUCCESS IS MY GOAL
If you find this indicator valuable:
• Leave a rating to help others discover it
• Share feedback in the comments
• Suggest improvements for future updates
• Follow for new indicator releases
💬 Need Help?
Drop a comment with your questions - I respond to all users!
🔔 Stay Updated
Follow to get notified about improvements and new features
---
⚖️ DISCLAIMER
This indicator is provided for educational and informational purposes only. It displays market data but does NOT provide trading advice or recommendations.
Options trading involves substantial risk and is not suitable for all investors. You can lose more than your initial investment. Past performance does not guarantee future results.
Always:
• Conduct your own research
• Understand options risks fully
• Consult a licensed financial advisor
• Trade only with risk capital
• Use proper position sizing
• Implement stop losses
The creator is not responsible for any trading losses incurred while using this indicator. Use at your own risk.
---
🚀 START TRADING SMARTER TODAY
Add "Auto Option Chain" to your charts and experience the difference professional-grade option data makes to your trading decisions!
Happy Trading! 📊💰

Option Chain Pulse (VWAP + PCR + MaxPain)Option Chain Pulse (VWAP + PCR + MaxPain) is a professional **NSE options chain dashboard** that scans the option chain around ATM and presents CE/PE data in a clean, decision-ready table—built for intraday option traders who need fast context (premium, volume, VWAP, diff, PCR) without switching screens.
## What this indicator does
- Lets you select **BANKNIFTY / NIFTY / FINNIFTY / MIDCPNIFTY / CUSTOM** and automatically maps the correct spot symbol + lot size (with custom symbol support).
- Builds option symbols in **NSE standard format** using expiry inputs (YY/MM/DD) and strike, then pulls **Open, Close, Volume, VWAP** for multiple strikes on both CE & PE.
- Displays a full **option chain table** (± strikes from your reference strike) including CE/PE premium metrics and **strike-wise PCR**, plus a summarized header with spot and expiry details.
## Core features
- **Multi-strike chain view (CE & PE)** around the reference strike (ATM).
- **Volume, VWAP, Open, Premium Change (Diff), LTP** for both sides for quick “where is activity” detection.
- **PCR per strike** (PE Volume / CE Volume) shown in the table for sentiment/pressure at each strike.
- **Max Pain (volume-based)** highlight: computes combined CE+PE volume per strike and shows the strike with maximum combined volume as “MxP”.
## UI & customization
- Adjustable **dashboard/table location** (top/bottom/center + left/right) and **font size** from inputs, so it can fit any chart layout.
- Color inputs for key table elements (strike text, volume, PCR, ATM highlight) to match dark/light themes and your personal setup.
## How to use (recommended workflow)
- Choose your instrument (or CUSTOM), set **expiry (Day/Month/Year)** and **reference strike + interval**, then use the table to identify:
- Where volume is building (institutional activity),
- Whether CE or PE is dominating via Diff and PCR,
- How price is behaving relative to VWAP for quick bias confirmation.
## Alerts / automation
This script is intended as a **visual decision dashboard** (table-first workflow).
## Disclaimer
Options trading is risky. This indicator is for **educational and informational purposes only** and does not constitute financial advice. Always test on paper, confirm liquidity/spreads, and use strict risk management.

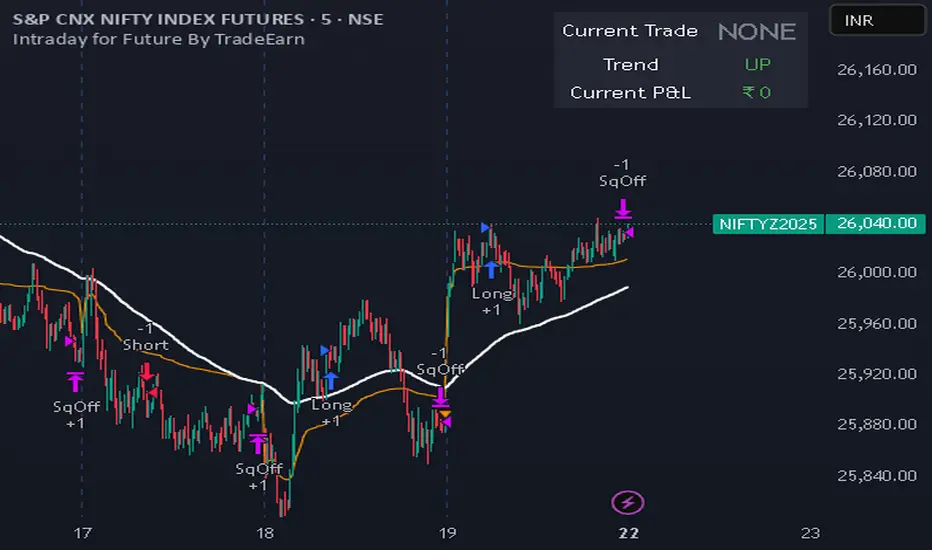
Intraday for Future By TradeEarnIntraday Strategy (StochRSI + VWAP + EMA)
Overview The Intraday Pullback Scalper is a specialized trend-following strategy designed for futures and equity traders who prefer to enter existing trends on pullbacks rather than chasing breakouts. By combining volume-weighted data (VWAP) with exponential moving averages (EMA) and momentum oscillators (Stochastic RSI), this script identifies high-probability entry points during intraday sessions. It includes built-in automation hooks (Alerts) compatible with bridge services for seamless execution.
How It Works
The strategy relies on a three-step confirmation process to filter noise and precision-time entries:
Trend Definition (The Filter):
VWAP (Volume Weighted Average Price): Acts as the primary regime filter. Longs are only permitted if price > VWAP; Shorts only if price < VWAP.
EMA (Exponential Moving Average): A secondary trend filter (default 100 periods) ensures alignment with the broader trend.
Time Range Breakout (Optional): Users can enable an "Initial Balance" filter where trades are only taken if the price breaks out of a specific time range (e.g., first hour High/Low).
Entry Trigger (The Signal):
Long Entry: The market must be in an Uptrend (Price > VWAP & EMA). The script waits for a "dip" where the Stochastic RSI drops below the Oversold level (default 20) and then crosses back up.
Short Entry: The market must be in a Downtrend (Price < VWAP & EMA). The script waits for a "rally" where the Stochastic RSI rises above the Overbought level (default 80) and then crosses back down.
Risk Management:
The strategy uses fixed Target Profit and Stop Loss values defined in currency (₹) relative to the trade quantity.
It features visual SL and TP lines on the chart for the duration of the trade to assist with manual monitoring.
Key Features
Universal Compatibility: Works on the "Current Chart" (Nifty, Bank Nifty, Stocks, Commodities) without needing complex dropdown selection.
Visual Dashboard: An on-screen table displays the Current Trade Status (Long/Short), Trend Direction, and Running P&L in real-time.
Algobaba Bridge Ready: Pre-formatted alert messages are included for users utilizing the Algobaba bridge for automation (supports MIS/NRML product types).
Customizable Trend Filters: Users can toggle the Time Range filter or adjust the VWAP Anchor (Session, Week, Month).
Settings & Configuration
Trade Quantity: Set your default lot size (e.g., 50 for Nifty).
Risk Settings: Define Target and Stop Loss in Rupees (₹) per trade setup.
Indicators: Adjustable lengths for EMA, RSI, and Stochastic.
Trading Window: Restrict entries to specific session hours (e.g., 09:15 - 15:10).
⚠️ IMPORTANT DISCLAIMER & RISK WARNING ⚠️
1. Educational Purpose Only This strategy script is provided solely for educational, informational, and research purposes. It does not constitute financial advice, investment recommendations, or a solicitation to buy or sell any securities, futures, or derivatives. The author is not a SEBI registered Research Analyst or Investment Advisor.
2. No Guarantee of Profit The "P&L" and performance metrics displayed on the chart are hypothetical and based on historical data. Past performance is not indicative of future results. Market conditions change, and a strategy that worked in the past may fail in the future.
3. Limitations of Backtesting
Slippage & Commission: The script results may not fully account for real-world execution costs such as broker commissions, taxes (STT/GST), slippage, or liquidity issues.
Repainting/Data Lag: While every effort is made to ensure code stability, real-time data feeds may vary from historical data due to internet latency or data provider differences.
4. High Risk in Derivatives Trading Futures and Options (F&O) involves a substantial risk of loss and is not suitable for every investor. You can lose more than your initial capital. Please assess your risk tolerance and financial situation before trading.
5. Automation & Third-Party Tools This script includes alert messages formatted for third-party bridge services (e.g., Algobaba). The author assumes no responsibility for:
Technical failures, API errors, or connectivity issues with your broker or bridge provider.
Incorrect order execution resulting from automation.
Users are solely responsible for monitoring their trades and verifying order execution.
Usage Agreement By using this script, you acknowledge that you are trading at your own risk and hold the author harmless from any losses incurred. Always test on a paper trading account before deploying real capital.
DTR + ATR + OR + VWAP PRO (Merged Model)This indicator combined
Day Trading Range
ATR
VWAP
Open Rang for the selected time frame

VWAP Multi-Timeframe Pro═══════════════════════════════════════════════════════════════════════════════
VWAP Multi-Timeframe Pro - 6 VWAP + Dynamic Levels - Alphaomega18
📝 COMPLETE DESCRIPTION
═══════════════════════════════════════════════════════════════════════════════
🎯 THE MOST COMPLETE VWAP INDICATOR ON THE MARKETPLACE
VWAP Multi-Timeframe Pro simultaneously displays 6 different VWAPs (Asia/London/NY Sessions + Daily/Weekly/Monthly) with key price levels and intelligent dynamic color for complete institutional market vision.
Designed for professional traders: futures, forex, crypto, stocks. Compatible all timeframes.
🔥 WHY THIS INDICATOR IS UNIQUE
Other VWAP indicators display 1 or 2 VWAPs maximum.
**VWAP MTF Pro gives you EVERYTHING in one indicator:**
✅ **6 Simultaneous VWAPs**: Asia, London, NY, Daily, Weekly, Monthly
✅ **3 Key Price Levels**: Previous VWAP, Daily Open, Previous Close
✅ **Dynamic Color**: GREEN line if price above, RED if below
✅ **Standard Deviation Bands**: ±1σ, ±2σ, ±3σ for extreme deviations
✅ **10 Configurable Alerts**: Crossovers and extreme zones
✅ **100% Customizable**: Colors, styles, selective display
One indicator = Complete 24/7 institutional flow vision!
📊 THE 6 DISPLAYED VWAPS
🔷 **1. VWAP ASIA SESSION** (Yellow default)
→ Customizable Asian session (00:00-08:00 default)
→ Visible only during Asia session
→ Identifies key Asian trading levels
🔷 **2. VWAP LONDON SESSION** (Cyan default)
→ European session (08:00-16:00 default)
→ Visible only during London session
→ Captures European institutional flow
🔷 **3. VWAP NY SESSION** (Orange default)
→ American session (15:30-22:00 default)
→ Visible only during NY session
→ Highest volume of the day
🔷 **4. VWAP DAILY** (Blue default)
→ Full day VWAP
→ Most important level for day traders
→ Major support/resistance
🔷 **5. VWAP WEEKLY** (Purple default)
→ Weekly VWAP
→ Medium-term trend
→ Key level for swing traders
🔷 **6. VWAP MONTHLY** (Fuchsia default)
→ Monthly VWAP
→ Long-term vision
→ Major institutional levels
📍 3 ESSENTIAL PRICE LEVELS (NEW)
🔷 **PREVIOUS DAY VWAP CLOSE** (Dashed line - Dynamic color!)
**The Revolutionary Feature:**
→ Displays previous day's VWAP Daily close
→ **GREEN line** when price ABOVE = Bullish signal ✅
→ **RED line** when price BELOW = Bearish signal ❌
→ Changes color in real-time at crossover!
**Why it's powerful:**
```
If you're trading LONG and line is GREEN:
→ You're on right side of market
→ Institutions are with you
→ Hold trade with confidence
If line turns RED:
→ EXIT immediately
→ Momentum has changed
→ Institutions selling now
```
🔷 **DAILY OPEN** (White dotted default)
→ Current day's opening price
→ Major psychological level
→ Intraday support/resistance
🔷 **PREVIOUS DAY CLOSE** (Purple dotted default)
→ Previous day's close
→ Gap analysis (up/down/none)
→ Critical institutional level
📏 STANDARD DEVIATION BANDS
**3 Bands on each side of VWAP:**
→ ±1σ (68% of distribution)
→ ±2σ (95% of distribution)
→ ±3σ (99.7% of distribution)
**VWAP selection for bands:**
Choose from: Asia / London / NY / Daily / Weekly / Monthly
**Usage:**
```
Price reaches +3σ:
→ Extreme overbought
→ Reversal or consolidation likely
→ Take LONG profits or prepare SHORT
Price reaches -3σ:
→ Extreme oversold
→ Reversal or consolidation likely
→ Take SHORT profits or prepare LONG
Price between ±1σ:
→ "Normal" zone
→ Trading range
→ Wait for breakout
```
🎯 REAL USE CASES
📌 **CASE 1: MNQ Day Trading with Dynamic Color**
**Morning Setup:**
```
08:00 - Market opens
→ Price at 16,300
→ Prev Day VWAP Close at 16,250
→ Line = GREEN ✅ (price above)
→ Signal: Bullish sentiment confirmed
Action: Look for LONG setups only
Avoid: SHORT trades against trend
```
**Momentum Change:**
```
10:30 - Price drops rapidly
→ Price drops to 16,240
→ Line turns RED ❗
→ Signal: Momentum changed!
Action: EXIT LONG positions immediately
Look for: SHORT setups now
```
**Result:**
→ You stay on right side of market permanently
→ No fighting institutions
→ Profits maximized, losses minimized
📌 **CASE 2: Gap Analysis with Daily Open + Prev Close**
**Gap UP:**
```
Daily Open (white): 16,320
Prev Day Close (purple): 16,280
Gap = +40 points
Analysis:
→ Bullish gap
→ If VWAP prev line = GREEN = Continuation
→ If price retests Prev Close (purple) and bounces = LONG entry
```
**Gap DOWN:**
```
Daily Open (white): 16,240
Prev Day Close (purple): 16,280
Gap = -40 points
Analysis:
→ Bearish gap
→ If VWAP prev line = RED = Continuation
→ If price rallies to Prev Close (purple) and rejects = SHORT entry
```
📌 **CASE 3: Multi-Timeframe Confirmation**
**LONG Setup Maximum Conviction:**
```
✅ Price > VWAP Monthly (fuchsia) → Long-term bullish trend
✅ Price > VWAP Weekly (purple) → Medium-term bullish trend
✅ Price > VWAP Daily (blue) → Short-term bullish trend
✅ Prev Day VWAP = GREEN → Today's momentum bullish
✅ Price > Daily Open (white) → Positive opening
Signal: ALL timeframes aligned LONG!
Action: LONG entry with strong conviction
Stop: Below VWAP Daily
```
**SHORT Setup Maximum Conviction:**
```
✅ Price < VWAP Monthly (fuchsia) → Long-term bearish trend
✅ Price < VWAP Weekly (purple) → Medium-term bearish trend
✅ Price < VWAP Daily (blue) → Short-term bearish trend
✅ Prev Day VWAP = RED → Today's momentum bearish
✅ Price < Daily Open (white) → Negative opening
Signal: ALL timeframes aligned SHORT!
Action: SHORT entry with strong conviction
Stop: Above VWAP Daily
```
📌 **CASE 4: Session Trading (London/NY Overlap)**
**15:30 - NY Session Opens:**
```
Before 15:30:
→ Price in VWAP London (cyan)
→ Consolidation, range
15:30 - NY opens:
→ VWAP NY (orange) appears
→ Volume explodes
→ Price breaks above VWAP Daily (blue)
→ Prev Day VWAP = GREEN ✅
Action:
→ LONG entry on breakout
→ Stop below VWAP Daily
→ Target +3σ upper band
```
⚙️ COMPLETE CUSTOMIZATION
🎨 **EACH VWAP IS CONFIGURABLE:**
**For each VWAP (6 groups):**
→ Show/Hide (On/Off)
→ Customizable color
→ Line thickness (1-5)
**Asia/London/NY Sessions:**
→ Configurable start/end hours
→ Adapt to your timezone
→ Customize per market
**Forex Example:**
```
Asia: 00:00-08:00 (Tokyo)
London: 08:00-16:00 (London)
NY: 13:00-20:00 (New York)
```
**US Futures Example:**
```
Asia: 18:00-02:00 (overnight)
London: 02:00-08:30
NY: 08:30-15:00 (RTH)
```
🎨 **PREVIOUS DAY VWAP - Dynamic Color:**
→ **Dynamic Color (Green/Red)**: On/Off
• ON = Line changes color (GREEN/RED)
• OFF = Fixed color
→ **Color Above**: Color when price above (default: Green)
→ **Color Below**: Color when price below (default: Red)
→ **Static Color**: If Dynamic Color OFF (default: White)
→ **Line Width**: Thickness (1-5)
→ **Line Style**: Solid / Dashed / Dotted
🎨 **DAILY PRICE LEVELS:**
**Daily Open:**
→ Show/Hide
→ Color (default: White)
→ Thickness
→ Style (Solid/Dashed/Dotted)
**Previous Day Close:**
→ Show/Hide
→ Color (default: Purple/Fuchsia)
→ Thickness
→ Style (Solid/Dashed/Dotted)
📏 **STANDARD DEVIATION BANDS:**
→ **Show Bands**: On/Off
→ **Bands Timeframe**: Choose VWAP (Asia/London/NY/Daily/Weekly/Monthly)
→ **Standard Deviation 1/2/3**: σ values (default: 1.0 / 2.0 / 3.0)
→ **Upper Colors**: Customizable
→ **Lower Colors**: Customizable
👁️ **DISPLAY:**
→ **Show Labels**: Display price labels (On/Off)
→ **Label Size**: Tiny / Small / Normal / Large
🔔 COMPLETE ALERTS (10 ALERTS)
**VWAP Daily Crossovers:**
1. Price > VWAP Daily
2. Price < VWAP Daily
**Extreme Bands:**
3. Price reaches +3σ
4. Price reaches -3σ
**Previous Day VWAP:**
5. Price > Previous Day VWAP
6. Price < Previous Day VWAP
**Daily Open:**
7. Price > Daily Open
8. Price < Daily Open
**Previous Day Close:**
9. Price > Previous Close
10. Price < Previous Close
💡 MARKETS AND TIMEFRAMES
✅ **ALL markets compatible:**
• Futures (ES, NQ, YM, RTY, MNQ, MES, etc.)
• Forex (EUR/USD, GBP/USD, USD/JPY, etc.)
• Crypto (BTC, ETH, altcoins - 24/7)
• Stocks (Tesla, Apple, Nvidia, etc.)
• Indices (S&P 500, Nasdaq, Dow Jones)
• Commodities (Gold, Oil, etc.)
✅ **All timeframes:**
• Scalping: 1min, 5min
• Day Trading: 15min, 30min, 1H ⭐ (optimal!)
• Swing Trading: 4H, Daily
• Position Trading: Weekly
Note: More reliable with real volume data
→ TradingView Premium recommended for tick data
🏆 UNIQUE ADVANTAGES
✅ **6 Simultaneous VWAPs**: Complete multi-timeframe vision
✅ **Dynamic color**: GREEN/RED for instant vision
✅ **3 Price levels**: Prev VWAP + Open + Prev Close
✅ **Standard deviation bands**: ±3σ for extreme zones
✅ **Customizable sessions**: Asia/London/NY adaptable
✅ **10 alerts**: All key crossovers
✅ **100% customizable**: Colors, styles, display
✅ **Automatic labels**: Real-time price display
✅ **Optimized code**: Light, fast, no lag
✅ **No repaint**: Reliable and stable signals
📊 RECOMMENDED CONFIGURATION
**For MNQ/ES Day Trading (15min):**
```
═══ VWAP Sessions ═══
Asia: ✅ ON (Yellow)
London: ✅ ON (Cyan)
NY: ✅ ON (Orange)
═══ VWAP Timeframes ═══
Daily: ✅ ON (Blue)
Weekly: ✅ ON (Purple)
Monthly: ❌ OFF (too long-term)
═══ Previous Day VWAP ═══
Show: ✅ ON
Dynamic Color: ✅ ON (CRITICAL!)
Color Above: Green
Color Below: Red
Width: 2-3
═══ Daily Price Levels ═══
Daily Open: ✅ ON (White dotted)
Prev Day Close: ✅ ON (Purple dotted)
═══ Bands ═══
Show Bands: ✅ ON
Timeframe: Daily
σ: 1.0 / 2.0 / 3.0
═══ Display ═══
Labels: ✅ ON
Size: Small
```
**For Scalping (1-5min):**
```
Sessions: Asia/London/NY by hour
Daily/Weekly: ON
Monthly: OFF
Prev Day VWAP: ON with Dynamic Color
Bands: Daily, ±2σ max
Labels: Small or Tiny
```
**For Swing Trading (4H-Daily):**
```
Sessions: OFF (not relevant)
Daily: ON
Weekly: ON
Monthly: ON
Prev Day VWAP: ON
Bands: Weekly, ±3σ
Labels: Normal or Large
```
🎓 QUICK USAGE GUIDE
**Simple Rules for Day Traders:**
1. **Prev VWAP Line Color = Day Direction**
→ GREEN = Trade LONG only
→ RED = Trade SHORT only
2. **Price above ALL VWAPs = Maximum bullish**
→ Look for LONG setups only
→ No SHORT counter-trend
3. **Price below ALL VWAPs = Maximum bearish**
→ Look for SHORT setups only
→ No LONG counter-trend
4. **Price between VWAPs = Neutral zone**
→ Wait for clear breakout
→ Range-bound, careful scalp
5. **±3σ bands = Extreme zones**
→ Take profits
→ Or wait for reversal
💪 TRADER PSYCHOLOGY
**What this indicator solves:**
❌ "I don't know if trend continues"
→ Check prev VWAP line color: GREEN = continues
❌ "I take profits too early from fear"
→ As long as line GREEN, hold LONG with confidence
❌ "I hold my losses too long"
→ Line turns RED? EXIT immediately!
❌ "I trade counter-trend"
→ 6 VWAPs visible = Impossible to mistake direction
❌ "I don't know where to put stop"
→ Stop below VWAP Daily for LONG, above for SHORT
**Result:**
✅ Increased confidence
✅ Reinforced discipline
✅ Maximized profits
✅ Trading with institutions
🔗 PERFECT COMPLEMENT
**Combine VWAP MTF Pro with:**
• **Order Flow Signals** → Institutional absorptions (💎▲🚀)
• **Order Flow CVD** → Real-time order flow
• **Fair Value Gaps** → Inefficiency zones
• **Market Profile** → POC/VPOC
**VWAP MTF Pro** = Institutional price levels
**Order Flow** = Flow confirmation
→ Complete trading system!
⚠️ DISCLAIMER
Technical indicators are decision support tools. No indicator guarantees profits. Always use:
• Appropriate risk management
• Stop loss on every trade
• Proper position sizing
• Demo account testing first
VWAP MTF Pro improves your analysis but doesn't replace a complete strategy with money management.
🚀 INSTALLATION
1. Copy the Pine Script code
2. Open Pine Editor in TradingView
3. Paste the code
4. Click "Add to Chart"
5. Indicator displays on chart (overlay)
6. Configure parameters to your preferences
7. Activate desired alerts
8. Trade with complete institutional vision!
💡 PRO TIP
**The Golden VWAP Rule:**
"NEVER trade against ALL aligned VWAPs"
If Monthly + Weekly + Daily ALL point down:
→ Bearish market on ALL timeframes
→ Trade SHORT only
→ No LONG = Suicide
If Monthly + Weekly + Daily ALL point up:
→ Bullish market on ALL timeframes
→ Trade LONG only
→ No SHORT = Lost money
This simple rule can **save your account**!
📞 CONTACT AND SUPPORT
Created by Alphaomega18
For questions, bugs or suggestions:
Find my other indicators:
• Order Flow Signals (institutional signals)
• Order Flow Dashboard (CVD oscillator)
• Order Flow CVD Simple (trend vision)
• Fair Value Gap Detector
• Volume & Volatility Crisis Detector


BTC Halving VWAP [Cycle Analysis]█ OVERVIEW
This indicator plots Anchored Volume Weighted Average Prices (VWAPs) from each Bitcoin halving date, revealing the "fair value" of each market cycle.
The key insight: When price closes below the current cycle's VWAP on the monthly chart (after 1+ year into the cycle), it historically signals the end of the bull market and continuation toward the previous halving's VWAP.
█ HALVING DATES
• H1: November 28, 2012 (Block 210,000)
• H2: July 9, 2016 (Block 420,000)
• H3: May 11, 2020 (Block 630,000)
• H4: April 19, 2024 (Block 840,000)
█ FEATURES
◽ Anchored VWAPs — VWAP lines calculated from each halving date
◽ Consolidation Bands — Adjustable percentage bands around each VWAP (default ±15%)
◽ Cycle Top Detection — Tracks the highest high before VWAP breakdown
◽ Breakdown Signals — Visual markers when price breaks below cycle VWAP (bearish confirmation)
◽ Interactive Dashboard — Shows cycle progress, VWAP levels, and historical comparison
◽ Alerts — Configurable alerts for VWAP crossovers and breakdowns
█ HOW TO USE
1. Apply to BTCUSD on the Monthly timeframe for best results
2. Watch the H4 VWAP (gold line) — this is the current cycle's fair value
3. When price is ABOVE the VWAP → Bullish bias
4. When price is BELOW the VWAP → Bearish bias, expect move to previous cycle VWAP
5. The ▼ signal marks confirmed cycle tops (VWAP breakdown after 1+ year)
█ DASHBOARD GUIDE
• Price — Current price and gain from halving
• Day — Days since halving and cycle progress %
• VWAP Levels — Current VWAP values with status (ABOVE/BELOW/CONSOL)
• Cycle Tops — Historical days to cycle top for H2 and H3
• Next Halving — Estimated date and countdown
█ SETTINGS
Display:
• Toggle dashboard, consolidation bands, vertical lines, cycle tops, breakdown signals
VWAPs:
• Show/hide individual halving VWAPs (H1-H4)
Settings:
• Dashboard text size
• Consolidation band percentage
• Cycle top label size
█ ALERTS
• VWAP Breakdown — Price breaks below any halving VWAP
• VWAP Reclaim — Price reclaims a halving VWAP
• Consolidation Zone — Price enters consolidation around VWAP
█ NOTES
• Best used on Monthly (1M) timeframe for cycle analysis
• Weekly timeframe also works for more granular view
• H1 VWAP disabled by default (requires data from 2012)
• Cycle top locks when price closes below VWAP after 365+ days into the cycle

Volume Weighted Average Price @Marx_CapitalSimple VWAP indicator edited to not connect the lines between sessions for a cleaner look without vertical lines at session ends.
Session end and start times are customizable.

VWAP Pro [cryptalent]VWAP Pro (Multi-Period + Standard Deviation)
1. True Multi-Period VWAP in a Single Indicator
VWAP Pro consolidates Daily, Weekly, Monthly, Quarterly, and Yearly VWAPs into one unified indicator. This eliminates the need for multiple scripts and allows traders to assess short-, medium-, and long-term value simultaneously on any timeframe.
This design supports:
Multi-timeframe value alignment
Institutional-style reference points
Cleaner charts with fewer indicators
2. Accurate Volume-Weighted Standard Deviation
Unlike generic volatility bands, the standard deviation in VWAP Pro is fully volume-weighted and derived directly from the VWAP calculation. This ensures that dispersion reflects where real trading activity occurred, not just price fluctuation.
Benefits include:
More realistic value boundaries
Improved identification of statistically stretched prices
Reduced noise compared to time-based indicators
3. Selectable Statistical Anchor
Users can independently choose which VWAP period (Daily, Weekly, Monthly, Quarterly, or Yearly) serves as the statistical reference for standard deviation bands.
This allows traders to:
Analyze intraday mean reversion around Daily VWAP
Track swing-level extensions from Weekly or Monthly VWAP
Maintain consistency between strategy horizon and statistical context
4. Current and Previous Period VWAP Visibility
VWAP Pro optionally plots previous period VWAPs alongside current ones. These prior value references often act as:
High-probability reaction levels
Acceptance or rejection zones
Structural support and resistance
This feature provides historical context without clutter, enabling more informed decision-making.
5. Highly Configurable and User-Controlled
Every VWAP and standard deviation component can be toggled independently. Traders can:
Display only relevant periods
Adjust standard deviation multipliers (1σ, 2σ, 3σ)
Customize colors for immediate visual clarity
The indicator adapts easily to different trading styles, from scalping to position trading.
6. Designed for Market Structure and Value Analysis
VWAP Pro is built around value discovery, not prediction. It excels at highlighting:
Fair value zones
Overextended price conditions
Areas where acceptance or rejection is likely to occur
This makes it especially effective for traders focused on market structure, auction behavior, and liquidity-driven price movement.
7. Clean Visualization with Professional Aesthetics
Careful use of transparency, fills, and plotting styles ensures that:
VWAP levels remain clearly visible
Standard deviation zones provide context without dominating the chart
Multiple periods can coexist without visual overload
The result is a professional-grade visual tool suitable for continuous use.
Summary
VWAP Pro (Multi-Period + Standard Deviation) is a comprehensive value-based indicator that combines multi-timeframe VWAPs, volume-weighted statistical bands, and flexible configuration into a single, efficient framework. It is designed for traders who prioritize structure, context, and statistically grounded decision-making over lagging signals or predictive indicators.

BTC ETF Average Inflow Cost BasisConcept
Since the historic launch of Bitcoin Spot ETFs on January 11, 2024, institutional flows have become a major driver of price action. This indicator aims to visualize the aggregate Cost Basis (average entry price) of the major Bitcoin ETFs relative to the underlying asset.
It serves as an on-chain proxy for institutional positioning, helping traders identify critical support levels where ETF inflows have historically concentrated.
How it Works
The script aggregates daily volume data from the top Bitcoin ETFs (IBIT, FBTC, ARKB, GBTC, BITB) and compares it against the Bitcoin price (BTCUSDT).
ETF Cost Basis (Pink Line):
This is calculated as a Cumulative Volume-Weighted Average Price (VWAP), anchored specifically to the ETF launch date (Jan 11, 2024).
Formula: It accumulates (BTC Price * Total ETF Volume) and divides it by the Cumulative Total ETF Volume.
This creates a dynamic level representing the "breakeven" price for the aggregate volume traded through these funds.
True Market Mean (Gray Line):
This represents the simple cumulative average of the Bitcoin price since the ETF launch date. It acts as a neutral baseline for the post-ETF market era.
How to Use
Institutional Support: The Cost Basis line often acts as a strong dynamic support level during corrections. When price revisits this level, it suggests the market is returning to the average institutional entry price.
Trend Filter:
Price > Cost Basis: The market is in a net profit state relative to ETF flows (Bullish/Trend continuation).
Price < Cost Basis: The market is in a net loss state (Bearish/Capitulation risk).
Confluence: The intersection of the Cost Basis and the True Market Mean can signal pivotal moments of trend reset.
Features
Data Aggregation: Pulls data from 5 major ETFs via request.security without repainting (using closed bars).
Dashboard: Includes a table in the top-right corner displaying real-time values for Price, Cost Basis, and Market Mean.
Customization: You can toggle individual ETF Moving Averages in the settings (disabled by default due to price scale differences between BTC and ETF shares).
Disclaimer
This tool is for educational purposes only and attempts to estimate institutional cost basis using volume proxies. It does not represent financial advice.

QUANT TRADING ENGINE [PointAlgo]Quant Trading Engine is a quantitative market-analysis indicator that combines multiple statistical factors to study trend behavior, mean reversion, volatility, execution efficiency, and market stability.
The indicator converts raw price behavior into standardized signals to help evaluate directional bias and risk conditions in a systematic way.
This script focuses on factor alignment and regime awareness, not prediction certainty.
Design Philosophy
Markets move through different regimes such as trending, ranging, volatile expansion, and instability.
This indicator attempts to model these regimes by blending:
Momentum strength
Mean-reversion pressure
Volatility risk
Trend filtering
Execution context (VWAP)
Correlation structure
Each component is normalized and combined into a single Quant Alpha framework.
Factor Construction
1. Momentum Factor
Measures directional strength using percentage price change over a rolling window.
Standardized using mean and standard deviation.
Represents trend continuation pressure.
2. Mean Reversion Factor
Measures deviation from a longer moving average.
Standardized to identify stretched conditions.
Designed to capture counter-trend behavior.
Directional Clamping
Mean-reversion signals are dynamically restricted:
No counter-trend buying during downtrends.
No counter-trend selling during uptrends.
Allows both sides only in neutral regimes.
This prevents conflicting signals in strong trends.
3. Volatility Factor
Uses realized volatility derived from price changes.
Penalizes environments where volatility deviates significantly from its norm.
Acts as a risk adjustment rather than a directional driver.
4. Composite Quant Alpha
The final Quant Alpha is a weighted blend of:
Momentum
Mean reversion (trend-clamped)
Volatility risk
The composite is standardized into a Z-score, allowing consistent interpretation across instruments and timeframes.
Signal Logic
Buy signal occurs when Quant Alpha crosses above zero.
Sell signal occurs when Quant Alpha crosses below zero.
Zero-cross logic is used to represent shifts from negative to positive statistical bias and vice versa.
Signals reflect statistical regime change, not trade instructions.
Volatility Smile Context
Measures price deviation from its statistical distribution.
Identifies skewed conditions where upside or downside volatility becomes dominant.
Highlights extreme deviations that may imply elevated derivative risk.
Exotic Risk Conditions
Detects sudden price expansion combined with volatility spikes.
Highlights environments where execution and risk become unstable.
Visual background cues are used for awareness only.
Execution Context (VWAP)
Measures price distance from VWAP.
Used to assess execution efficiency rather than direction.
Helps identify stretched conditions relative to average traded price.
Correlation Structure
Evaluates short-term return correlations.
Detects when price behavior becomes less predictable.
Flags structural instability rather than trend direction.
Visualization
The indicator plots:
Quant Alpha (scaled) with directional coloring
Volatility smile deviation
Price vs VWAP distance
Correlation structure
Signal markers indicate Quant Alpha zero-cross events and risk conditions.
Dashboard
A compact dashboard summarizes:
Trend filter state
Quant Alpha polarity and value
Individual factor readings
Current action state (Buy / Sell / Wait / Risk)
The dashboard provides a real-time snapshot of internal model conditions.
Usage Notes
Designed for analytical interpretation and research.
Best used alongside price action and risk management tools.
Factor behavior depends on instrument liquidity and volatility.
Not optimized for illiquid or irregular markets.
Disclaimer
This script is provided for educational and analytical purposes only.
It does not provide financial, investment, or trading advice.
All outputs should be independently validated before making any trading decisions.

Ultimate Institutional Order Flow Pro [Pointalgo]Ultimate Institutional Order Flow (UIOF Pro)
Ultimate Institutional Order Flow (UIOF Pro) is a multi-component market analysis indicator designed to study order flow behavior, liquidity interaction, volatility structure, and session-based participation.
It integrates several commonly used market structure and order-flow concepts into a single visual framework.
This script focuses on context and alignment, not on isolated signals.
Core Objective
The indicator aims to identify areas where price, volume, liquidity, and structure appear aligned in the same direction.
It does this by combining:
VWAP behavior
Volume participation
Cumulative delta analysis
Liquidity pool interaction
Order blocks and fair value gaps
Market structure shifts
Session and higher-timeframe confirmation
VWAP & Volatility Framework
Calculates VWAP using session, weekly, or monthly anchors.
Optional VWAP standard-deviation bands visualize price dispersion.
VWAP slope and price position are used to classify directional bias.
VWAP is treated as a dynamic equilibrium reference rather than a signal.
Cumulative Volume Delta (CVD)
Estimates buy and sell pressure based on intrabar price movement.
Tracks cumulative delta and a smoothed delta average.
Uses delta change normalization to highlight abnormal activity.
Detects potential delta divergences when price and participation differ.
CVD is used to assess whether participation supports or contradicts price movement.
Liquidity Zones & Sweeps
Identifies recent swing highs and lows as potential liquidity pools.
Tracks buy-side and sell-side liquidity areas.
Flags conditions where price sweeps liquidity beyond recent extremes.
Liquidity interaction is treated as context, not prediction.
Order Blocks
1. Detects potential bullish and bearish order blocks using:
Candle structure
Volatility thresholds
Volume confirmation
2.Highlights areas where strong participation followed opposing price movement.
Order blocks are visual reference zones and do not imply guaranteed reactions.
Fair Value Gaps (FVG)
Identifies imbalance zones where price moves without overlapping structure.
Filters gaps using ATR-based size conditions.
Visual shading is used to highlight imbalance areas.
These zones may represent inefficient price movement requiring further interaction.
Volume Profile & Point of Control (POC)
Builds a simplified volume profile over a configurable lookback window.
Determines the price level with the highest traded volume (POC).
POC is used as a reference for acceptance or rejection behavior.
Market Structure
Evaluates recent highs and lows to identify structure breaks.
Classifies directional structure as bullish, bearish, or neutral.
Structure is used as a directional filter rather than a trigger.
Multi-Timeframe Confirmation
Optional higher-timeframe confirmation aligns lower-timeframe behavior with broader context.
Prevents analysis from relying on isolated timeframe conditions.
Session Filtering
1. Allows analysis to be limited to specific trading sessions.
2. Helps reduce signals during low-participation periods.
3. Session logic affects signal eligibility, not calculations.
Signal Logic
Signals are generated only when multiple independent conditions align, including:
Liquidity interaction
Order block presence
VWAP bias
Delta confirmation
Structure alignment
Volume participation
Optional higher-timeframe confirmation
Active trading session
Strong continuation conditions are also highlighted when price, volume, and participation remain aligned.
Signals represent confluence states, not trade instructions.
Dashboard Summary
A real-time dashboard summarizes:
VWAP bias and slope
CVD strength and direction
Delta behavior
Market structure state
Higher-timeframe context
Volume conditions
Liquidity pool counts
Session activity
This provides a high-level snapshot of market conditions without manual calculation.
Alerts are available for:
Institutional alignment conditions
Strong continuation pressure
Liquidity sweeps
Delta divergences
Alerts are informational and reflect internal indicator states only.
Usage Notes
Designed for analytical interpretation and market study.
Best used alongside price action and risk management methods.
Performance depends on instrument liquidity and volume quality.
All visual elements can be individually enabled or disabled.
Disclaimer
This script is provided for educational and analytical purposes only.
It does not provide financial, investment, or trading advice.
All outputs should be independently verified before making trading decisions.

Liquidity Levels Pro Tool - thewallranka
Liquidity Levels Pro Tool is a market-structure and liquidity-mapping indicator designed to help discretionary futures and index traders identify statistically relevant price levels where reactions, continuations, or liquidity sweeps are more likely to occur.
This script is a decision-support tool, not a signal generator. It does not issue buy/sell alerts or predict future price movement. Instead, it organizes and scores liquidity information so traders can make their own contextual decisions.
What this indicator does
The script continuously detects and maintains liquidity zones derived from price pivots, then evaluates those zones using multiple structural and contextual factors:
Repeated price interaction (touches)
Freshness (time since last interaction)
Confluence with key reference levels
Reaction behavior after contact
Session relevance (RTH vs overnight)
Market regime (trend vs mean reversion)
Time-of-day effects (open, midday, power hour)
Only the most relevant zones—based on a dynamic scoring system—are displayed to reduce chart clutter and focus attention on levels that have historically mattered.
Core components
1. Liquidity Zones
Zones are built from pivot highs and lows and expanded into areas using a configurable tick-based padding. Nearby zones are merged to avoid redundancy.
Each zone is continuously evaluated and assigned a score (0–100) reflecting its relative importance.
2. Zone Scoring (No Lookahead)
Zone scores are based on:
Number of confirmed interactions
Recency of the last touch
Confluence with prior day/week levels, VWAP, and Opening Range
Reaction quality after touches (speed and follow-through)
Session alignment (zones that “work” in the current session are favored)
Penalties after liquidity sweeps
Zones are not forward-looking and do not rely on future data.
3. Context Engine
The script classifies the current environment using VWAP slope and distance:
Trend (up or down)
Mean reversion
Mixed/transition
Time-of-day context (Open, Midday, Power Hour) is also tracked internally and influences zone scoring.
This context is displayed in the HUD to support situational awareness, not automated decisions.
4. Liquidity Sweeps
Optional sweep detection highlights situations where price trades beyond a zone and closes back inside, indicating potential stop runs or failed breakouts.
Sweeps are rate-limited and applied conservatively to avoid visual noise.
5. Trade Planning Levels (Optional)
When enabled, the script highlights the nearest high-quality liquidity level above and below price based on score thresholds.
These are intended as reference targets, not trade entries or exits.
HUD (Heads-Up Display)
The on-chart HUD summarizes:
Key reference levels (prior day/week, Opening Range)
Nearest strong liquidity above/below price
Market regime and time-of-day context
Distance to levels (ticks or points)
The HUD is fully optional, positionable, and includes resizable modes (Small / Medium / Large) to fit different chart layouts.
How to use this tool
This indicator is best used as part of a discretionary trading process, for example:
Identifying areas where price is more likely to react or pause
Framing trades around higher-quality structure instead of arbitrary levels
Filtering setups based on session and regime context
Managing expectations near known liquidity rather than chasing price
It is intentionally designed not to provide trade signals.
Limitations and important notes
This script does not predict outcomes or guarantee reactions
High-scoring zones can still fail
Liquidity behavior is context-dependent and probabilistic
No performance claims or backtested results are provided
The indicator should not be used in isolation
Past behavior does not imply future results.
Chart and usage notes
The script is intended for standard time-based charts
Recommended for liquid futures and index products
Use a clean chart for clarity when publishing or sharing
No external indicators are required
Final note
Liquidity Levels Pro (Tool) — v6 is designed to organize complex market structure into a clear, readable framework, allowing traders to focus on execution and risk management rather than raw level detection.
This script reflects an analytical approach to intraday liquidity and structure, not an automated trading system.

Current and Previous Period Anchored VWAPanchored VVWAPS and previous month VWAP extend out into the following month. Includes 1SD for both

Colby Cheese VWAP Setup [v2.0]🔧 Core Refactors
• Imbalance function fixed:
• Removed invalid usage.
• Now uses for past bar references.
• Bias checks are handled outside the function with proper series indexing.
• Bias alignment:
• Added and so CHoCH signals only fire when price change agrees with EMA bias.
• Swing reset:
• After a valid CHoCH, and reset to so stale levels don’t keep firing.
• Line/label management:
• CHoCH lines and labels now reuse persistent IDs (, ) instead of spamming new objects every trigger.
✨ New Features
• Anticipation mode:
• Blue “Anticipate” lines/labels drawn when delta + bias align before CHoCH confirmation.
• Helps you see potential setups earlier.
• Entry zone lines:
• Solid green/red lines drawn at entry levels when is enabled.
• Separate from FRVP dashed zones.
• Stop‑loss lines:
• Orange dotted lines drawn opposite the entry zone when is enabled.
• Gives a visual risk marker.
🎨 Visual Consistency
• Candle coloring simplified: white candles only when CHoCH triggers.
• FRVP zones remain dashed lines with “Enter” labels.
• Anticipation zones are blue solid lines.
• Entry zones are solid green/red.
• Stop‑loss lines are orange dotted.
