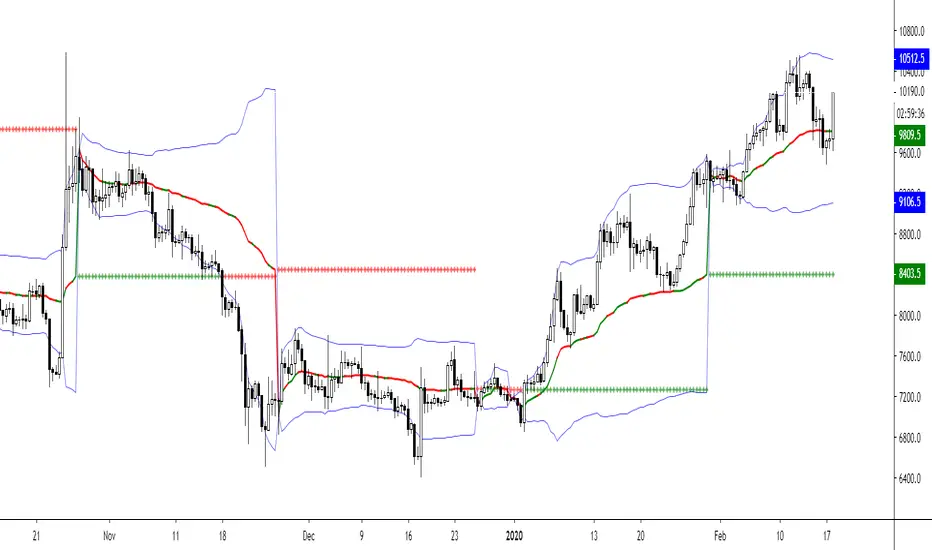
6X Bollinger Bands + MA + VWAP Dingue V56X Bollinger Bands Dingue V5 - This is the updated version for Pine Script 5
This indicator lets you quickly see all the intricacies of the Bollinger Bands; it simplifies its usage and maximizes the results.
Color-coded if the price is above or under the middle and based on direction.
Color-coded for expansion and contraction of the bands.
Option to plot ‘Squeezed bands’. It will show above the bands when they become smaller than the setting chosen. This helps identify build-up that might explode one way or another.
- 6x independent Bands can be adjusted as you want. It gives you possibilities in how you see variance, trends, support and resistance.
You can also select the MA type: SMA EMA WMA VWAM FRAMA … to explore new ways to see the Bollinger bands.
New in this version, you can now add a separate ‘Long MA’ that you can select independently from the Bands. Ex. Plot 200 SMA This helps in building a strategy with the trend and the bands.
Like the MA above, you can also plot 2 different VWAP independently from the Bands. This also helps knowing where the price stands compared to the bigger time frame VWAP’s price.
'Tool tips' explain other settings, if you have any questions, feel free to ask in the comments below.
Thank you for the feedback and check all my ‘Dingue’ indicators.
Vwapbands
VWAP Bands - Event Based [LuxAlgo]This indicator returns VWAP bands with a degree of smoothness resetting based on various user-selected events. The bands are constructed using a VWAP based naive standard deviation.
The indicator can be anchored or start from the first bar and can be used as trailing support/resistance, in a moving average crossover system, or as source for external indicators.
Settings
Start: VWAP anchor point
Start At First Bar: Display the VWAP from the first bar instead of a specified anchor point
VWAP
Length: Controls certain characteristics of the user-selected event
Mult: Multiplicative factor for the VWAP standard deviation
Source: Price source of the indicator
Event
Event: Determines the event resetting the degree of smoothness of the VWAP
External Cross/Event: Input source used for external crosses/events
Further details about the available events are given below.
Details
Various event conditions are available to the users. When the selected event occurs, the VWAP equals the current closing price.
By default, the event is periodic, that is the VWAP resets periodically, with a period determined by the Length setting.
The Higher High event resets the VWAP when a new higher high occurs.
The Lower Low event resets the VWAP when a new lower low occurs.
The Trend Change event is similar however resets the VWAP only once a higher high or lower low occurs. Higher highs and lower lows are given by Donchian channels with a period determined by the Length setting.
The Start event reset the VWAP at the selected anchor point (or first bar if the "Start At First Bar" setting is selected). This can be useful if one only needs a regular anchored VWAP band indicator.
The External Cross event resets the VWAP when the Source price crosses the series selected in the External Cross/Event setting. In the image above the VWAP resets when the price crosses the volatility stop indicator.
The External Event resets the indicator when a series selected in the External Cross/Event setting is not equal to 0. This allows using a custom event in order to reset the VWAP. In the above example the VWAP is reset during a new session due to the External Session indicator.
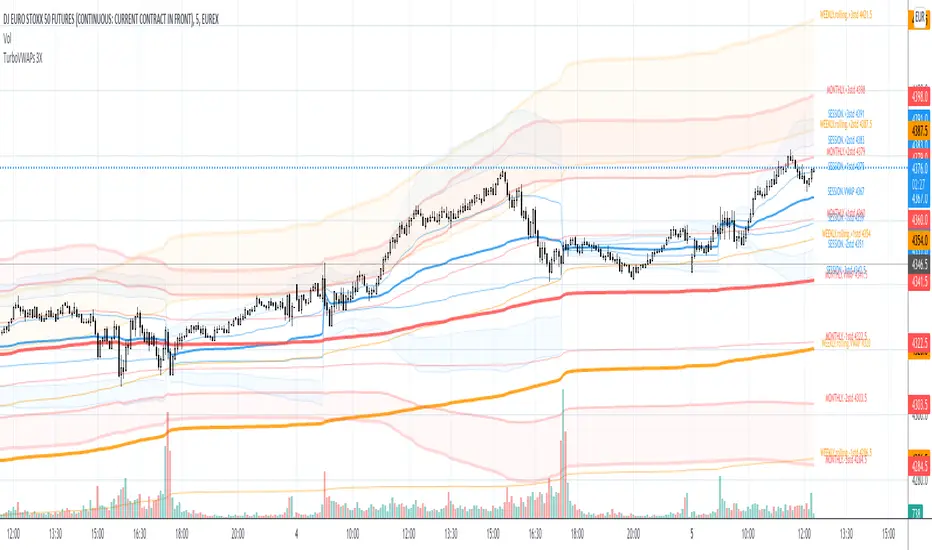
Central Pivot Ranges (CPR) & 3 x VWAP & BarcolorsThis Script Combines daily, weekly and monthly VWAP (Volume Weighted Average Price) with a intraday, daily, weekly and monthly CPR (Central Pivot Range) - which is considered by some traders as the bread and butter of the market for a reason. A combination of Multiple CPRs and VWAPs from different timeframes can provide you with interesting confluences that can give you more confidence in performing your trades.
CPR Features:
- The option to look at current or developing CPRs.
- A resolution selector for all 4 CPRs
- Options to hide and show Tops, Bottoms and Pivots separately
- Various Styling options
- Alerts
VWAP Features:
- 3 x preset VWAPs set to daily, weekly and monthly
- VWAP Lines from the daily O&C or H&L
- Previous VWAP for S/R
- Line Styling options
General Features:
- Barcolors by pivots crossed or daily, weekly and monthly VWAP.
- Barcolors by daily VWAP additionally contain an O and C check instead of just taking the price above or below the VWAP into consideration.

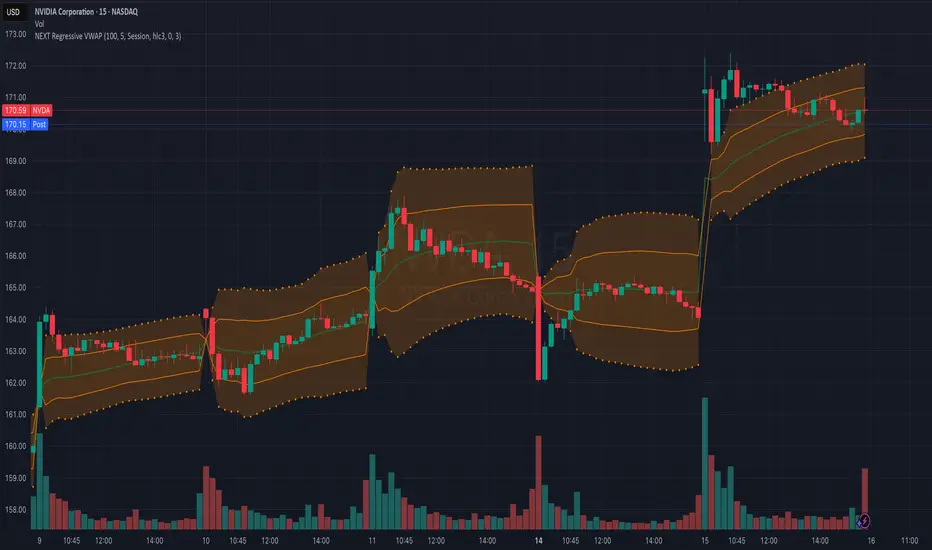
NEXT Regressive VWAPOverview:
This version of the Volume-Weighted Average Price (VWAP) indicator features an extended algorithm, which, in addition to volume and price, also incorporates regression analysis. The result is a more responsive, often leading VWAP slope with a degree of statistical predictability built in. Just like with the original VWAP, NEXT Regressive VWAP offers two optional Standard Deviation bands that parallel it. These can be set to any deviation level, with the default being 1 and -1, indicating one standard deviation above and one below Regressive VWAP, respectively.
Below is a screenshot comparing NEXT Regressive VWAP (green) to the original VWAP (blue) on CME_MINI:ES1! M3 chart.
Application and Strategy Ideas:
Price above NEXT Regressive VWAP is interpreted to have a bullish bias, and below, bearish. You can use TradingView's native Set Alert functionality to be notified, in real-time, when price crosses Regressive VWAP, and/or any of its standard deviation bands. Another popular "probability play" strategy is to scalp price when it crosses under the upper band (short) and crosses over the lower band (long). The screenshot below visualizes such a strategy on NASDAQ:QQQ M1 chart:
Input Parameters:
There are 3 groups of input.
Regression Settings
Length - controls the length of time (in bars) for regression analysis with higher values yielding smoother, more responsive values.
Regression Weighting - controls the degree of regression analysis incorporated into VWAP, with 5 being average, 0-4 less, 6-10 more. The higher the value, the more responsive the Regressive VWAP curve.
VWAP Settings
Anchor Period - controls the origin of VWAP calculations, start of session being the default.
Source - data used for calculating the VWAP, typically HLC/3, but can be used with other price formats and data sources as well.
Offset - shifting of the VWAP line forward (+) or backward (-).
Standard Deviation Bands Settings
Calculate Bands - checking this will add 2 bands, each equidistant (by the amount of Multiplier) from the NEXT Regressive VWAP line.
Bands Multiplier - standard deviation multiplier, with 1 being the default
Signals and Alerts:
Here is how to set price (close) crossing NEXT Regressive VWAP alerts: open a chart, attach NEXT Regressive VWAP, and right-click on chart -> Add Alert. Condition: Symbol e.g. ES (close) >> Crossing >> Regressive VWAP >> VWAP >> Once Per Bar Close.
Rolling VWAP - Vhunt Scalper botBINANCE:ADAUSDTPERP
Modified VWAP to use scalping in lower timeframe.
Use 1minute TF for best results but can also use up to 30min.
This indicator is made for crypto but may also work for other assets.
The bands serve as support and resistance and used for opening quick profit position if conditions below are met:
Indicators:
Blue - modified rolling vwap
Orange - Band1
Green - Band2
Opening position Conditions:
Long:
Band2 < Band1
Price < Band2
Short:
Band2 > Band1
Price > Band2

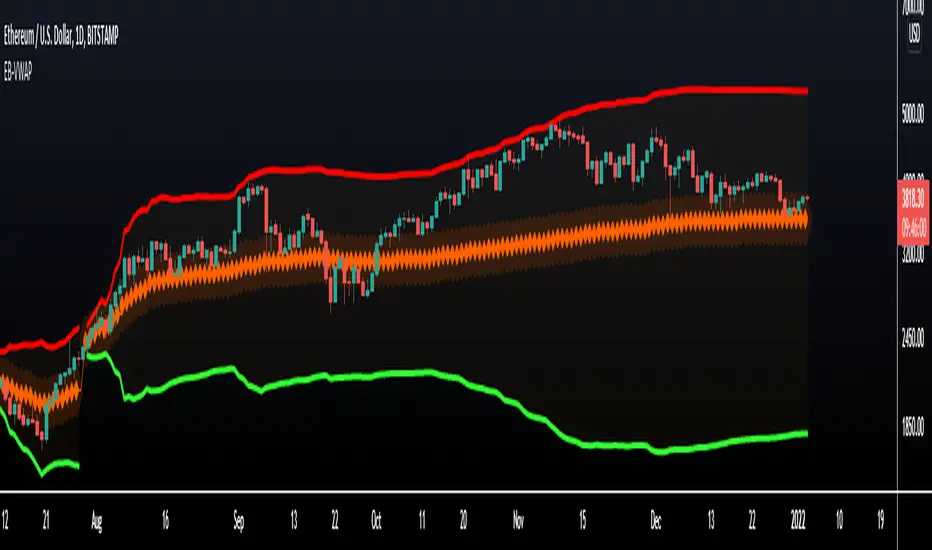
VWAP StdDev Bands - Multi-type VWAP: Period, Date, EarningsThis VWAP indicator differs from the rest in that it is customizable for 3 distinct VWAP types, among other features that may be useful.
VWAP types:
Period Based VWAP
Date Anchored VWAP
Earnings Based VWAP
Additional features common to all VWAP types:
Standard Deviation Bands
Coloring based on Price vs Deviation Bands
Coloring of VWAP based on VWAP Slope
Each of the VWAP types are described below:
Period VWAP
Simple period VWAP which allows preset, as well as custom periods.
Resets at the start of each period.
Also allows setting a custom session time for reset at specific time of day.
Date VWAP
Date anchored VWAP which does not reset.
VWAP will start from the selected date.
Pictured: AAPL Date VWAP from 2018-08-27
Earnings VWAP
VWAP which resets on every earnings report. The symbol must be stock with available earnings data.
Multiple types can be used in conjunction with one another only by adding multiple of the indicator to your chart.
Feel free to leave any comments, questions, or bug reports. All are welcome.
Enjoy!

TurboVWAPs 3XAwesome indicator that will plot on your chart up to 3 different VWAPs and optionally up to 3 standard deviations for each one.
Each VWAP can be configured to be a Rolling or Anchored VWAP and to automatically adapt its period depending on the current chart timeframe. For example, you can configure each VWAP to be a rolling 30min VWAP for timeframes below 30M, a session-anchored VWAP between 30M and 1D timeframes, a rolling monthly VWAP for a 1D timeframe and a quarterly VWAP for a weekly timeframe.
You can disable any of the three VWAPs or any of its standard deviations bands.
For session-anchored VWAPs the script will automatically set session times depending on the current futures contract (only for US and EUR futures) if desired. You can disable this feature and manually input session start and end times.
Rolling Anchored Vwap ExperimentalCurrently only some timeframes, but I can add more, this was made when requesting additional timeframes from the original creator, this was my quick interpretation of the code.
It works by rolling the vwap, so it never resets but is always X amount of time back as the source for the start of data. Its really useful i use it daily.

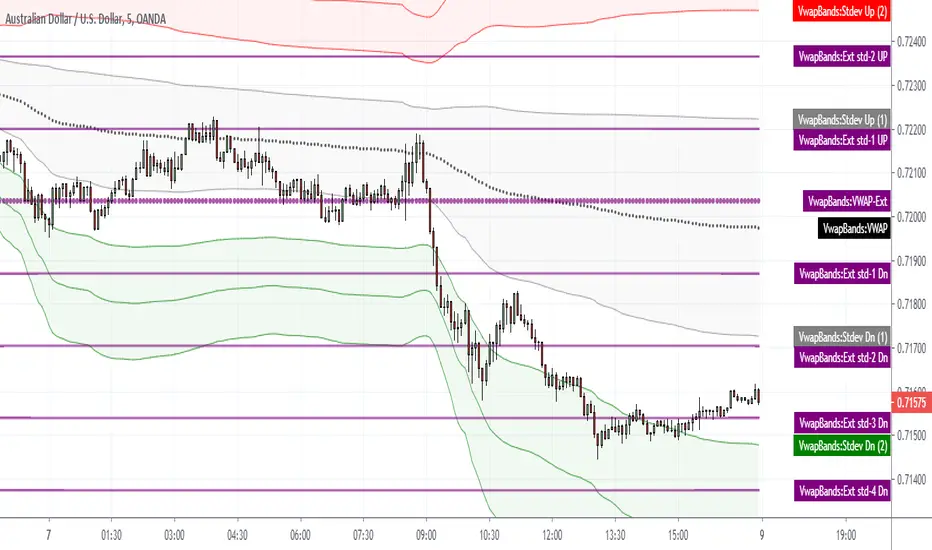
(JS) Interchanging ATR & VWAP BandsOkay so this is pretty simple, but I think it's a great tool for day trading especially. I just took the default VWAP and Keltner channel scripts and combined them together.
The top option allows you to choose which one you'd prefer to use, "Use ATR instead of VWAP" .
The next options, "ATR Source", "KC Length", and "ATR Length" are the parameters for the ATR Bands.
"Number of Bands" allows you to choose how many bands you'd like to be on display (you can choose 1-8).
"Use Expoential MA" and "Band Style" are more default parameters from Keltner Channels used to set up the ATR Bands.
The "ATR Bands" are just stacked Keltner Channels separated by 1 ATR each, whereas the "VWAP Bands" are separated by standard deviation just like the default script from Trading View.
In these example chart, you can see the weekly VWAP with 8 deviation bands and 5 ATR bands with Keltner Channels.

(JS) VWAP BandsThis is a pretty simple script here - I took the VWAP and combined it with Bollinger Bands.
The bands can vary a lot based on chart resolution, so I wanted to make sure the resolution could be modified so you can use the resolution you're most comfortable with, or find the most success with.
Length:
Length of bars used to calculate the bands.
Standard Deviation Band 1-3:
There's three bands all together, this option allows you to modify the number of standard deviations per band.
VWAP Period:
This modifies when you want the VWAP to begin (Session, Week, Month, Year).
Offset:
This moves the VWAP and the bands the amount of bars you select, default is of course set to zero.
Source:
This selects the source of calculation, HLC/3 is the default VWAP calculation.
This is a pretty self explanatory script, I thought being able to see the standard deviations of the VWAP could prove to be useful - hope you all like it!

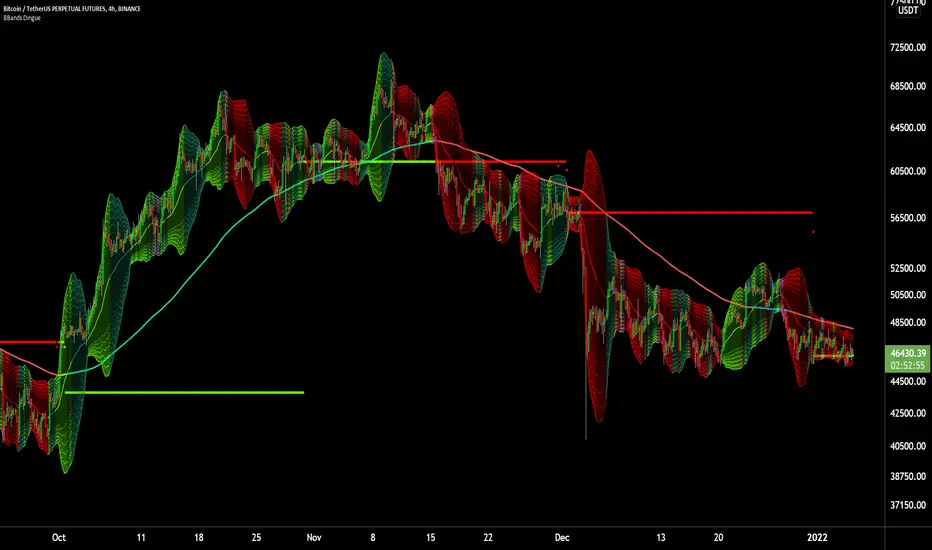
MTF VWAP + Fibo Incremental deviationsI made a Fibo variant of my first script "VWAPs + devs" :
This new indicator give you the possibility to plot multi timeframes VWAP (D, W, M, 3M and 12M ) and Fibo deviations for each one.
VWAP is a powerfull indicator which is used by big players to get informations if the price is "overbought" or "oversold". Deviations give the opportunity to have supports and resistances in those "over"-zones.
I searched for better results and found those defaults values :
Fib 1 level : 0.618
Fib 2 level : 0.786
Fib 3 level : 1.000
Fib 4 level : 1.618
Fib 5 level : 2.618
In the thumbnail, we can see that the 1.618 deviation level made a great support on the last uptrend for BTCUSDT .
You can change each values but low ones as 0.382 and 0.5 don't give really interesting supports/resistances.
I made this script as clear and simple as possible with only one menu in the parameters.
Some examples of what you can do :
BTCUSDT (Binance) H4 / D, W, M, 3M ,12M VWAP without devs
BTCUSDT (Binance) M5 / Daily VWAP + Fibo devs
Hope this will be useful for you !

GMS: VWAP with Percent BandsThis is a pretty straight-forward script. I just wanted to see percent bands around the VWAP after looking at the standard deviation bands for a while and even dabbling with keltner channels. This is the cleanest in my opinion. The script is open so feel free to poke around!
The default settings are below, just to confuse 0.25 with 25%.
0.25 = 0.25%
0.5 = 0.50%
0.75 = 0.75%
PS - it's not multi-timeframe yet. That'll come in the next update.
Hope this helps,
Andre
VWAP w/ Std Deviation bands extensionsVWAP with Standard Deviation Bands and Extensions
This indicator does 3 things:
1. Plot session VWAP
2. Plot up to 5 Standard Deviation Bands of VWAP
3. Plot extension of previous session's VWAP and Extension Bands
Comments are welcome.
Enjoy.
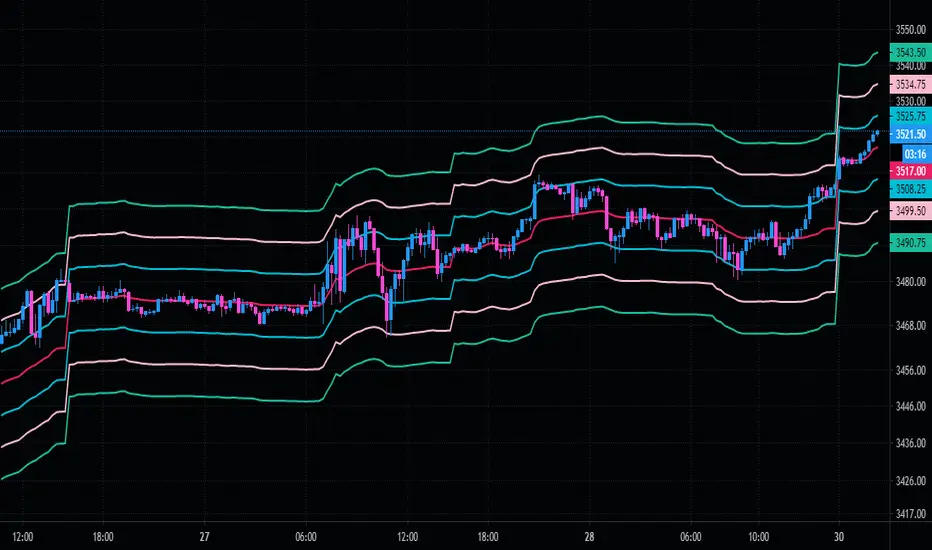
VWAP GRIDHello Fellow Traders!
VWAP GRID is a highly requested and modified version of our basic VWAP Bands Indicator, we have added many additions along with alerts to be used with Automated Solutions or to use with manual trading.
Features
----------------------
Custom Alerts are built into the script for manual or automatic trading.
Multiple VWAP bands added with adjustable % grid
Adjustable Time frames added for VWAP and Price
Alerts Added for every level!
Visual Entry & Exit Points for each level
Visual Trend Bands
You can get access to any of my scripts by visiting my website below , all links are down below in my signature!

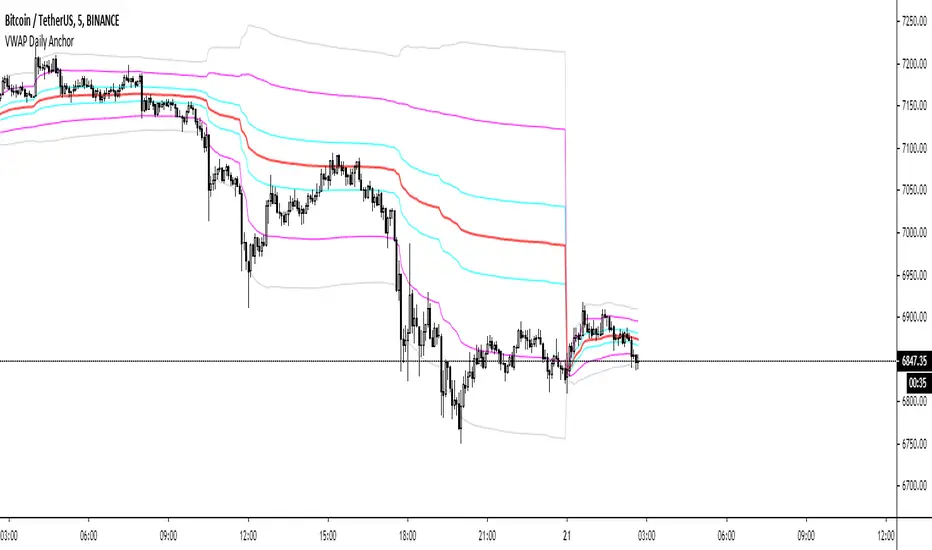
VWAP Daily AnchorAnchored daily VWAP with adjustable standard deviation bands - intended for intraday scalping.
Anchored VWAP is useful because not matter what timeframe you look at it on, it will look the same, unlike normal VWAP indicators. This means there's nothing left to interpretation.
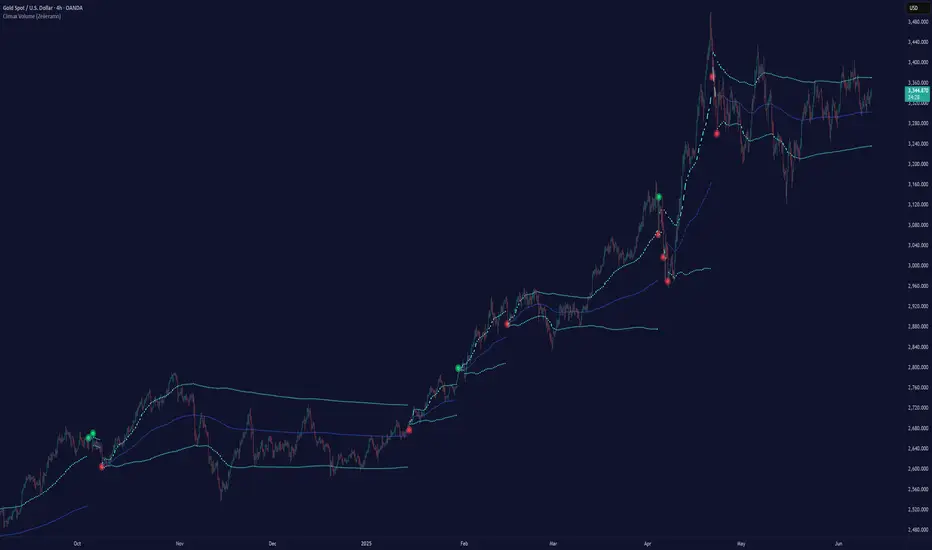
Climax Volume (Zeiierman)█ Overview
Climax Volume (Zeiierman) isolates extreme participation events to pinpoint when price action reaches exhaustion. These moments of volume climax often precede reversals, pauses, or key balance shifts, offering traders an early read on changing market dynamics. Instead of treating volume as a passive tally, it locates climax bars, abnormally large activity bursts, and anchors a Point of Control (PoC) that tracks where post-climax transactions concentrate. The result is a clear read on when participation is peaking, where value re-centers afterward, and how far price can reasonably deviate before reverting.
This tool is designed for multi-context use, such as intraday execution, swing confirmation, or structural bias analysis, offering a precise view of where volume matters, not just how much.
⚪ Why This One Is Unique
Unlike conventional volume-spike indicators, Climax Volume (Zeiierman) integrates adaptive extremum detection, a dynamic PoC core, and multi-layer deviation envelopes that evolve in real time with market context.
Internally, it fuses bid–ask volume delta modeling with re-normalized dispersion mapping to measure the directional imbalance driving each climax event. The system continuously evaluates delta asymmetry between buying and selling pressure to refine the detection of true participation extremes. This allows the engine to differentiate between constructive volume expansion (trend continuation) and exhaustive volume spikes (potential reversals).
█ Main Features
⚪ Climax Volume
The Climax Volume Engine isolates statistically significant bursts in participation that indicate potential turning points or exhaustion phases. It identifies climax bars—instances where volume reaches regime-level extremes relative to recent activity—and classifies them as bullish (green) or bearish (red) based on directional dominance. These events highlight where aggressive activity peaks and often mark the start of structural imbalance, providing early cues for reversal, absorption, or renewed continuation.
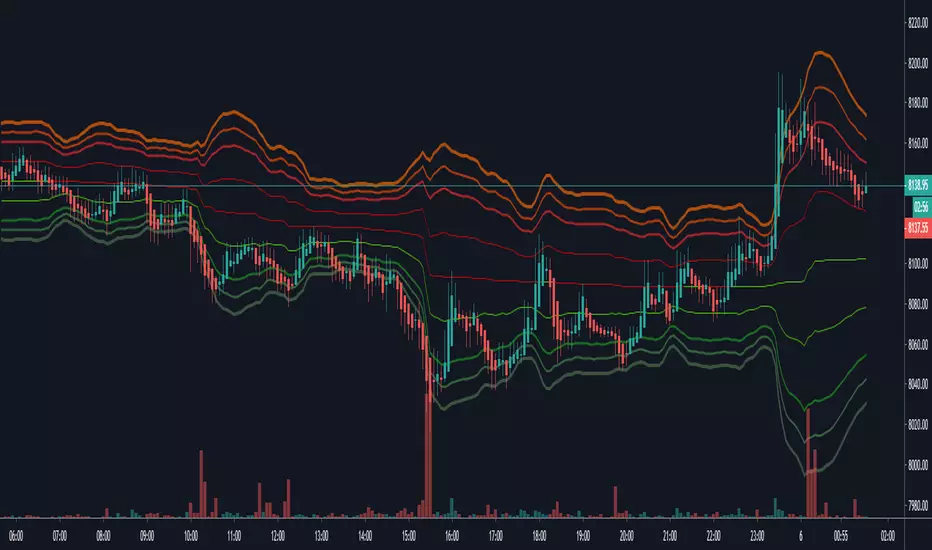
⚪ Point of Control (PoC)
Each climax event dynamically re-anchors a Point of Control (PoC)—the evolving price center of post-climax volume distribution. The PoC tracks where transaction density stabilizes after an extreme burst, forming the reference core of a control zone. From this anchor, the system projects upper and lower tolerance bands to define acceptable deviation ranges, contextualizing how far the price can travel before reverting or rebalancing.
█ How to Use
⚪ Trend Following
Use the Volume Point of Control (PoC) as a dynamic guide to assess directional bias. The PoC effectively acts as a moving equilibrium line, continuously updating to reflect where trading volume and market influence are concentrated.
When price holds above the PoC, it signals sustained bullish sentiment and active accumulation.
When the price remains below, it confirms bearish control and ongoing distribution.
⚪ Trend Continuation Retests
The slope of the PoC reflects the strength and persistence of market momentum. The steeper the PoC slope, the stronger the active momentum. A flat or neutral PoC typically signals consolidation or low conviction — conditions better avoided for trend trades.
In a bullish scenario , watch for the price to retest the PoC or the lower tolerance band after a pullback. A successful rejection of that zone often signals that buyers are defending control, providing a high-probability continuation entry.
In a bearish scenario , when the PoC slopes downward, wait for the price to retest it from below. If the market fails to reclaim that level, it indicates that sellers remain dominant, and downside momentum is likely to continue.
⚪ Reversals
Climax Points — the color-coded circles that appear during moments of extreme volume. These signals indicate that the market may soon pause, reverse, or rotate back toward the PoC equilibrium.
🟢 Bullish Climax Points emerge when heavy buying reaches unsustainable levels, often signaling a buyer exhaustion event or a possible local top formation.
🔴 Bearish Climax Points form during high-intensity selling bursts, warning of seller exhaustion and potential bottoming conditions.
⚪ Confirm Breakouts
High-volume breakouts confirmed by Climax Volume signals often mark the initiation of strong directional moves. When climax confirmation aligns with a structural break, it validates that the breakout is backed by genuine participation — not just thin volatility spikes — increasing the probability of follow-through and trend expansion.
Identify a key support or resistance zone manually or with your preferred structural tool.
Wait for a climax signal to coincide with a break beyond that level.
For bullish breakouts , a green climax point appearing as price pushes above resistance confirms that buyers are stepping in with conviction.
For bearish breakouts , a red climax point forming as price drops through support indicates that real selling pressure is driving the move.
█ How It Works
⚪ Climax Detection
Identifies participation surges within a dynamic volume–price field to isolate genuine activity extremes rather than simple bar-size anomalies.
Calculation: Utilizes adaptive extremum detection on a re-normalized volume–delta composite with regime-sensitive thresholds and variance filters to extract statistically valid climax events.
⚪ Point of Control (PoC)
Defines the evolving price centroid where post-climax transactions cluster, continuously adapting to shifting participation density.
Calculation: Employs a volume-weighted delta balance framework with incremental accumulation and curvature-preserving smoothing, ensuring stability while maintaining local reactivity to order-flow asymmetry.
⚪ Tolerance Bands
Outlines a probabilistic corridor around the PoC that distinguishes expected fluctuation from meaningful deviation.
Calculation: Implements variance-aware dispersion modeling with contextual weighting derived from real-time delta gradients, projecting symmetric envelopes scaled by adaptive multipliers.
-----------------
Disclaimer
The content provided in my scripts, indicators, ideas, algorithms, and systems is for educational and informational purposes only. It does not constitute financial advice, investment recommendations, or a solicitation to buy or sell any financial instruments. I will not accept liability for any loss or damage, including without limitation any loss of profit, which may arise directly or indirectly from the use of or reliance on such information.
All investments involve risk, and the past performance of a security, industry, sector, market, financial product, trading strategy, backtest, or individual's trading does not guarantee future results or returns. Investors are fully responsible for any investment decisions they make. Such decisions should be based solely on an evaluation of their financial circumstances, investment objectives, risk tolerance, and liquidity needs.
Paid script
3D VWAP With Standard Deviation BandsThis indicator is free to all Oasis Trading Group members.
The 3D VWAP uses the VWAP calculation, but instead of 1 day worth of data it uses 3 days to continuously calculate and allow for use of longer time frames while trading. This indicator will also mark the 3D VWAP close as a support and resistance line to use in future trading.
The VWAP line will turn green when ascending and red when descending.
The top and bottom blue lines are standard deviations of the 3D VWAP, you can change how many deviations it uses in the inputs.
For Access or Questions: Private message us. Thank you.