VWAP Entry Assistant (v1.0)Description:
Anchored VWAP with a lightweight assistant for VWAP reversion trades.
It shows the distance to VWAP, an estimated hit probability for the current bar, the expected number of bars to reach VWAP, and a recommended entry price.
If the chance of touching VWAP is low, the script suggests an adjusted limit using a fraction of ATR.
The VWAP line is white by default, and a compact summary table appears at the bottom-left.
Educational tool. Not financial advice. Not affiliated with TradingView or any exchange. Always backtest before use.
Vwaps

Dual Session VWAPSeparate VWAP with 1 standard deviation band for the regular session as well as electronic session

VWAP + Multi-Condition RSI Signals + FibonacciPlatform / System
Platform: TradingView
Language: Pine Script® v6
Purpose: This script is an overlay indicator for technical analysis on charts. It combines multiple tools: VWAP, RSI signals, and Fibonacci levels.
1️⃣ VWAP (Volume Weighted Average Price)
What it does:
Plots the VWAP line on the chart, which is a weighted average price based on volume.
Can be anchored to different periods: Session, Week, Month, Quarter, Year, Decade, Century, or corporate events like Earnings, Dividends, Splits.
Optionally plots bands above and below VWAP based on standard deviation or a percentage.
Supports up to 3 bands with customizable multipliers.
Will not display if the timeframe is daily or higher and the hideonDWM option is enabled.
Visual on chart: A main VWAP line with optional shaded bands.
2️⃣ RSI (Relative Strength Index) Signals
What it does:
Calculates RSI with a configurable period.
Identifies overbought and oversold zones using user-defined levels.
Generates buy/sell signals based on:
RSI crossing above oversold → Buy
RSI crossing below overbought → Sell
Detects strong signals using divergences:
Bullish divergence: Price makes lower low, RSI makes higher low → Strong Buy
Bearish divergence: Price makes higher high, RSI makes lower high → Strong Sell
Optional momentum signals when RSI crosses 50 after recent overbought/oversold conditions.
Visual on chart:
Triangles for buy/sell
Different color triangles/circles for strong and momentum signals
Background shading in RSI overbought/oversold zones
Alerts: The script can trigger alerts when any of these signals occur.
3️⃣ Fibonacci Levels
What it does:
Calculates Fibonacci retracement and extension levels based on the highest high and lowest low over a configurable lookback period.
Plots standard Fibonacci levels: 0.146, 0.236, 0.382, 0.5, 0.618, 0.786, 1.0
Plots extension levels: 1.272, 1.618, 2.0, 2.618
Helps identify potential support/resistance zones.
Visual on chart: Horizontal lines at each Fibonacci level, shaded with different transparencies.
Summary
This script is essentially a multi-tool trading indicator that combines:
VWAP with dynamic bands for trend analysis and price positioning
RSI signals with divergences for entry/exit points
Fibonacci retracement and extension levels for support/resistance
It is interactive and visual, providing both chart overlays and alert functionality for active trading strategies.
This code is provided for training and educational purposes only. It is not financial advice and should not be used for live trading without proper testing and professional guidance.

Ghost Signal — MTF EMA/VWAP Confluence SystemGhost Signal — MTF EMA/VWAP Confluence System
Purpose
Ghost Signal is an intraday trend-entry tool that tries to do one thing well: only fire when multiple, independent edges agree. It looks for pullbacks to the EMA-20 or clean trend-continuations, then gates those raw triggers behind VWAP/Anchored-VWAP alignment, higher-timeframe structure, momentum, spacing (anti-chop), volume and ATR context. The goal is fewer, higher-quality entries that avoid “death-by-a-thousand scalps” in chop.
What it plots
EMA 20/50/200 for trend structure and spacing (no-braid filter).
VWAP (session) and optional Anchored VWAP (Daily/Weekly/Monthly).
ENTRY labels when all filters pass.
A compact status table: HTF score (M/W/D/4H/15/5), VWAP/AVWAP arrows, EMA regime, slopes %, ATR%, spacing %, and distance from EMA-50.
How signals are built
Raw triggers (on chart TF or a lower “signal TF” for intrabar precision):
PB20: trend pullback that crosses back through EMA-20.
TC: trend-continuation when price holds the side of EMA-20 with limited gap.
Confluence filters (must pass):
EMA regime & slopes: 20>50>200 for longs (reverse for shorts) with minimum slope on EMA-20/50.
VWAP/AVWAP alignment: price must be above both for longs / below for shorts, with a configurable margin.
HTF structure score: combines M/W/D/4H/15/5 states and penalizes corrections.
Anti-chop spacing: minimum separation between 20↔50 and 50↔200.
Context: volume ≥ SMA×mult, ATR% ≥ floor, max distance from EMA-50 to avoid late chases.
Optional breakout: close > prior high (long) / < prior low (short).
Time lockouts: exclude known messy windows (open/close, FX rollover, etc.).
Adaptive slope (optional): slopes auto-tighten/loosen with market heat (ATR% & relative volume).
How to use
Works on 1–5m best; designed for futures, stocks, FX, and crypto.
Use the status table to confirm context (HTF score, VWAP arrows, slopes/ATR/spacing).
Pair with your own risk model; common templates: stop ≈ 1.5–2× ATR, TP ≈ 1.2–1.8R or an ATR trail.
Turn the Signal TF to “1” on 3m/5m charts if you want intrabar PB20 detection.
Why it helps
Ghost Signal tries to stack institutional anchors (VWAP/AVWAP), higher-timeframe bias, and momentum/structure so you participate in moves with real sponsorship—and sit out the braid.
Notes & limits
No indicator removes risk. Expect fewer signals on range days, slippage around news, and thinner markets to require stricter volume/spacing. Past results don’t guarantee future returns.

TGFA Flexible Alerts Multi-MA CrossoversTGFA Flexible Alerts, Multi-MA Crossovers
Description
Flexible MA crossovers with BUY/SELL alerts, customizable candle colors, and an info box for ATR/volatility insights. Supports EMA/SMA/HMA/VWAP on any chart.
Overview
TGFA Flexible Alerts is a versatile Pine Script indicator for traders seeking customizable moving average (MA) crossovers, visual signals, and quick-reference metrics. It overlays crossover lines (e.g., fast EMA over slow SMA), generates BUY/SELL labels and alerts, colors candles based on themes, and includes an optional info box with ATR bands, support/resistance, and trend projections. Built for any symbol and timeframe (optimized for 1H intraday), it auto-detects Heikin Ashi charts and handles mixed MA types like responsive HMA with lagging EMAs. All logic uses built-in TA functions for reliability—no repainting on confirmed bars.
Key Features
MA Crossover Engine: Configurable lines (EMA, SMA, HMA, VWAP) with dynamic colors (HMA tints green/red based on slope). Enable/disable via inputs.
Invert Signals Toggle: Flips BUY/SELL logic for mixed MA setups (e.g., HMA as fast line over EMA).
Reasoning: Traditional crossovers assume a fast line (low lag) crossing above a slow line (high lag) for buys. HMA's hull design makes it ultra-responsive, so it may "lead" too aggressively—causing premature signals. Inverting aligns it with user intuition (e.g., HMA dipping below then recovering signals strength), reducing false positives in trending markets. Test on your pairs!
Visual Alerts: BUY/SELL labels at crossover price (with optional price display and offset adjustment).
Single MA Overlays: Independent plots for EMA/SMA/HMA/VWAP (length 0 to hide).
Info Box: Real-time table with current price, ±1/2 ATR bands, median price (over lookback), trend (SMA50 slope), volatility % (ATR normalized), support/resistance (recent highs/lows), and reversal projections (tied to SMA50 pivot for up/down bias).
Candle Coloring: 20+ themes (dark/light canvases) for bull/bear/reversal/low-volume bars—e.g., Emerald Blaze greens uptrends, dims on low vol. Toggle off for no changes.
Chart Source Flexibility: Auto-switches to Heikin Ashi if detected; manual override for Regular/HA.
Alerts fire on crossovers/crossunders (custom messages with ticker/interval). Open-source for forking.
How to Use
Add to Chart: Search in TradingView's public library, apply to any symbol (e.g., stocks, forex). Best on 1H for intraday, but works on daily/weekly too.
Setup Crossovers: Choose Line 1/2 types/lengths (e.g., HMA 9 over SMA 20). Enable "Invert Signals" if using HMA—prevents lag mismatches in volatile assets.
Alerts & Labels: Toggle labels for visuals; set TradingView alerts on "Buy"/"Sell" conditions. Use offset for crowded charts.
Info Box Insights: Enable for quick scans—e.g., enter long near support if trend is bullish and price > median. Adjust ATR length (default 14) for sensitivity.
Candle Themes: Pick a scheme (e.g., Neon Pulse for dark mode); it overrides bar colors without altering data.
Customization Tip: For HMA-heavy setups, invert + short lengths (5-9) catch turns early; pair with volume filter in alerts.
Limitations & Disclaimers - Designed for overlay on price charts; may overlap in tight ranges—adjust transparency via styles.
HMA can repaint intra-bar; signals confirm on close. Not back tested for all assets—validate with strategy tester.
Info box projections use SMA(50) as a trend pivot (same for up/down as reference); customize via code for advanced calcs. Candle colors are cosmetic only.
This is an analysis tool, not advice. Trading involves risk; combine with fundamentals/news. Past performance isn't indicative of future results. No liability for losses.
I'm still a newbie, so feedback encouraged!
Thank you!!
ThisGirl

VWAP Multi Sessions + EMA + TEMA + PivotThis indicator combines several technical tools in one, designed for both intraday and swing traders to provide a complete view of market dynamics.
- VWAP Multi Sessions: calculates and plots five independent VWAPs, each based on a specific time range. This allows you to better identify value zones and price evolution during different phases of the trading day.
- Moving Averages (EMA): three strategic EMAs (55, 144, and 233 periods) are included to track the broader trend and highlight potential crossovers.
- TEMA (Triple Exponential Moving Average): two TEMAs (144 and 233 periods) offer a more responsive alternative to EMAs, reducing lag while filtering out some market noise.
- Daily Levels: the previous day’s open, close, high, and low are plotted as key support and resistance references.
- Pivot Point (P): also included is the classic daily pivot from the previous session, calculated as (High + Low + Close) / 3, which acts as a central level around which price often gravitates.
In summary, this indicator combines:
- intraday value references (session VWAPs),
- trend indicators (EMA and TEMA),
- and daily reference points (OHLC and Pivot).
It is particularly suited for intraday, scalping, and swing trading strategies, helping traders anticipate potential reaction zones in the market more effectively.

VWAP Daily/Weekly/Monthly - Automatic AnchoredExplanation:
This script plots Volume-Weighted Average Price (VWAP) lines that are automatically anchored to the beginning of key timeframes — daily, weekly, and monthly. VWAP is a widely used trading indicator that shows the average price of an asset weighted by trading volume, making it useful for identifying fair value and institutional trading levels.
The “automatic anchored” feature means that you don’t have to manually select starting points. Instead, the script automatically resets the VWAP at the start of each day, week, or month, depending on the chosen setting. This ensures the VWAP always reflects the true average price for that period, providing traders with a consistent reference for support, resistance, and trend direction across multiple timeframes.
Notice:
On the chart, you may notice visible “jumps” in the VWAP lines. These are intentional. Each jump marks the reset point at the start of a new day, week, or month, depending on the selected setting. This design keeps the VWAP history from the previous period intact, allowing you to clearly see how price interacted with VWAP in past sessions.
By keeping these historical resets, you can easily compare short-term (daily) VWAP behavior against longer-term levels like weekly and monthly VWAP. This provides valuable context, helping you spot when price respects or diverges from fair value across different timeframes.
In short:
Daily VWAP resets at the start of each trading day.
Weekly VWAP resets at the beginning of each trading week.
Monthly VWAP resets at the start of each month.
This makes it easy to analyze how price interacts with VWAP levels across different time horizons without manual adjustments.

Foresight Cone (HoltxF1xVWAP) [KedArc Quant]Description:
This is a time-series forecasting indicator that estimates the next bar (F1) and projects a path a few bars ahead. It also draws a confidence cone based on how accurate the recent forecasts have been. You can optionally color the projection only when price agrees with VWAP.
Why it’s different
* One clear model: Everything comes from Holt’s trend-aware forecasting method—no mix of unrelated indicators.
* Transparent visuals: You see the next-bar estimate (F1), the forward projection, and a cone that widens or narrows based on recent forecast error.
* Context, not signals: The VWAP option only changes colors. It doesn’t add trade rules.
* No look-ahead: Accuracy is measured using the forecast made on the previous bar versus the current bar.
Inputs (what they mean)
* Source: Price series to forecast (default: Close).
* Preset: Quick profiles for fast, smooth, or momentum markets (see below).
* Alpha (Level): How fast the model reacts to new prices. Higher = faster, twitchier.
* Beta (Trend): How fast the model updates the slope. Higher = faster pivots, more flips in chop.
* Horizon: How many bars ahead to project. Bigger = wider cone.
* Residual Window: How many bars to judge recent accuracy. Bigger = steadier cone.
* Confidence Z: How wide the cone should be (typical setting ≈ “95% style” width).
* Show Bands / Draw Forward Path: Turn the cone and forward lines on/off.
* Color only when aligned with VWAP: Highlights projections only when price agrees with the trend side of VWAP.
* Colors / Show Panel: Styling plus a small panel with RMSE, MAPE, and trend slope.
Presets (when to pick which)
* Scalp / Fast (1-min): Very responsive; best for quick moves. More twitch in chop.
* Smooth Intraday (1–5 min): Calmer and steadier; a good default most days.
* Momentum / Breakout: Quicker slope tracking during strong pushes; may over-react in ranges.
* Custom: Set your own values if you know exactly what you want.
What is F1 here?
F1 is the model’s next-bar fair value. Crosses of price versus F1 can hint at short-term momentum shifts or mean-reversion, especially when viewed with VWAP or the cone.
How this helps
* Gives a baseline path of where price may drift and a cone that shows normal wiggle room.
* Helps you tell routine noise (inside cone) from information (edges or breaks outside the cone).
* Keeps you aware of short-term bias via the trend slope and F1.
How to use (step by step)
1. Add to chart → choose a Preset (start with Smooth Intraday).
2. Set Horizon around 8–15 bars for intraday.
3. (Optional) Turn on VWAP alignment to color only when price agrees with the trend side of VWAP.
4. Watch where price sits relative to the cone and F1:
* Inside = normal noise.
* At edges = stretched.
* Outside = possible regime change.
5. Check the panel: if RMSE/MAPE spike, expect a wider cone; consider a smoother preset or a higher timeframe.
6. Tweak Alpha/Beta only if needed: faster for momentum, slower for chop.
7. Combine with your own plan for entries, exits, and risk.
Accuracy Panel — what it tells you
Preset & Horizon: Shows which preset you’re using and how many bars ahead the projection goes. Longer horizons mean more uncertainty.
RMSE (error in price units): A “typical miss” measured in the chart’s currency (e.g., ₹).
Lower = tighter fit and a usually narrower cone. Rising = conditions getting noisier; the cone will widen.
MAPE (error in %): The same idea as RMSE but in percent.
Good for comparing different symbols or timeframes. Sudden spikes often hint at a regime change.
Slope T: The model’s short-term trend reading.
Positive = gentle up-bias; negative = gentle down-bias; near zero = mostly flat/drifty.
How to read it at a glance
Calm & directional: RMSE/MAPE steady or falling + Slope T positive (or negative) → trends tend to respect the cone’s mid/upper (or mid/lower) area.
Choppy/uncertain: RMSE/MAPE climbing or jumping → expect more whipsaw; rely more on the cone edges and higher-TF context.
Flat tape: Slope T near zero → mean-revert behavior is common; treat cone edges as stretch zones rather than breakout zones.
Warm-up & tweaks
Warm-up: Right after adding the indicator, the panel may be blank for a short time while it gathers enough bars.
Too twitchy? Switch to Smooth Intraday or increase the Residual Window.
Too slow? Use Scalp/Fast or Momentum/Breakout to react quicker.
Timeframe tips
* 1–3 min: Scalp/Fast or Momentum/Breakout; horizon \~8–12.
* 5–15 min: Smooth Intraday; horizon \~12–15.
* 30–60 min+: Consider a larger residual window for a steadier cone.
FAQ
Q: Is this a strategy or an indicator?
A: It’s an indicator only. It does not place orders, TP/SL, or run backtests.
Q: Does it repaint?
A: The next-bar estimate (F1) and the cone are calculated using only information available at that time. The forward path is a projection drawn on the last bar and will naturally update as new bars arrive. Historical bars aren’t revised with future data.
Q: What is F1?
A: F1 is the indicator’s best guess for the next bar.
Price crossing above/below F1 can hint at short-term momentum shifts or mean-reversion.
Q: What do “Alpha” and “Beta” do?
A: Alpha controls how fast the indicator reacts to new prices
(higher = faster, twitchier). Beta controls how fast the slope updates (higher = quicker pivots, more flips in chop).
Q: Why does the cone width change?
A: It reflects recent forecast accuracy. When the market gets noisy, the cone widens. When the tape is calm, it narrows.
Q: What does the Accuracy Panel tell me?
A:
* Preset & Horizon you’re using.
* RMSE: typical forecast miss in price units.
* MAPE: typical forecast miss in percent.
* Slope T: short-term trend reading (up, down, or flat).
If RMSE/MAPE rise, expect a wider cone and more whipsaw.
Q: The panel shows “…” or looks empty. Why?
A: It needs a short warm-up to gather enough bars. This is normal after you add the indicator or change settings/timeframes.
Q: Which timeframe is best?
A:
* 1–3 min: Scalp/Fast or Momentum/Breakout, horizon \~8–12.
* 5–15 min: Smooth Intraday, horizon \~12–15.
Higher timeframes work too; consider a larger residual window for steadier cones.
Q: Which preset should I start with?
A: Start with Smooth Intraday. If the market is trending hard, try Momentum/Breakout.
For very quick tapes, use Scalp/Fast. Switch back if things get choppy.
Q: What does the VWAP option do?
A: It only changes colors (highlights when price agrees with the trend side of VWAP).
It does not add or remove signals.
Q: Are there alerts?
A: Yes—alerts for price crossing F1 (up/down). Use “Once per bar close” to reduce noise on fast charts.
Q: Can I use this on stocks, futures, crypto, or FX?
A: Yes. It works on any symbol/timeframe. You may want to adjust Horizon and the Residual Window based on volatility.
Q: Can I use it with Heikin Ashi or other non-standard bars?
A: You can, but remember you’re forecasting the synthetic series of those bars. For pure price behavior, use regular candles.
Q: The cone feels too wide/too narrow. What do I change?
A:
* Too wide: lower Alpha/Beta a bit or increase the Residual Window.
* Too narrow (misses moves): raise Alpha/Beta slightly or try Momentum/Breakout.
Q: Why do results change when I switch timeframe or symbol?
A: Different noise levels and trends. The accuracy stats reset per chart, so the cone adapts to each context.
Q: Any limits or gotchas?
A: Extremely large Horizon may hit TradingView’s line-object limits; reduce Horizon or turn
off extra visuals if needed. Big gaps or news spikes will widen errors—expect the cone to react.
Q: Can this predict exact future prices?
A: No. It provides a baseline path and context. Always combine with your own rules and risk management.
Glossary
* TS (Time Series): Data over time (prices).
* Holt’s Method: A forecasting approach that tracks a current level and a trend to predict the next bars.
* F1: The indicator’s best guess for the next bar.
* F(h): The projected value h bars ahead.
* VWAP: Volume-Weighted Average Price—used here for optional color alignment.
* RMSE: Typical forecast miss in price units (how far off, on average).
* MAPE: Typical forecast miss in percent (scale-free, easy to compare).
Notes & limitations
* The panel needs a short warm-up; stats may be blank at first.
* The cone reflects recent conditions; sudden volatility changes will widen it.
* This is a tool for context. It does not place trades and does not promise results.
⚠️ Disclaimer
This script is provided for educational purposes only.
Past performance does not guarantee future results.
Trading involves risk, and users should exercise caution and use proper risk management when applying this strategy.

VWAP + Range Breakout (Pre-Signal for Manual Entry)WHAT IT DOES
This tool highlights potential breakout opportunities when price sweeps the previous day’s high or low and aligns with VWAP and short-term range levels. It provides both pre-signals (early warnings) and confirmed signals (breakout closed) so traders can prepare before momentum accelerates.
Works on all timeframes and across markets (indices, forex, crypto). Especially useful during active London and New York sessions.
---
KEY FEATURES
Daily sweep logic: previous day high/low as liquidity reference
VWAP with cumulative calculation
Adjustable range breakout levels
Optional SMA trend filter
Session filter (London / NY trading hours)
Pre-Signal markers (early alert before breakout)
Confirmed LONG/SHORT signals after breakout close
Alerts for Pre-Long, Pre-Short, and Confirmed entries
---
HOW TO USE
1. Wait for price to sweep the previous day high/low.
2. Look for alignment with VWAP and the defined range breakout levels.
3. Use trend/session filters for higher accuracy.
4. Combine with your own risk management rules.
---
SETTINGS TIPS
Adjust range lookback for different timeframes (shorter for fast intraday, longer for higher timeframes).
Enable/disable session filters depending on your market.
Use SMA trend filter to stay aligned with higher-timeframe bias.
---
WHO IT’S FOR
Scalpers, intraday, and swing traders who want early signals when liquidity is taken and price is preparing for a breakout.
---
NOTES
For educational purposes only. No financial advice.
This script is open-source; redistribution follows TradingView rules.

Smart Money LITE — Daily Sweep → HQ Signals (VWAP • FVG • CHoCH) 🔗 PRO VERSION (VWAP + FVG + CHoCH — full confirmations, all timeframes):
chartedgepro.gumroad.com/l/rmnbhw
Daily liquidity sweep → confluence signals with VWAP, FVG & CHoCH. Works on all timeframes & markets (Indices, Forex, Crypto).
WHAT IT DOES
Smart Money LITE+ highlights high-quality LONG/SHORT signals only after daily liquidity is swept (previous day high/low) with confluence from VWAP, FVG and structure (BOS/CHoCH).
Works on all timeframes and across markets: indices, forex, crypto.
KEY FEATURES (Lite)
• Daily sweep logic (PDH/PDL) + previous day zones
• VWAP + deviation bands (optional) and proximity filter
• 3-bar FVG boxes (visual) with adjustable extension
• ATR/volatility filter, optional HTF trend filter
• Anti-spam cooldown, clean LONG/SHORT labels
• Alerts: HQ LONG / HQ SHORT
HOW TO USE
1. Wait for price to sweep PDH/PDL → indicator opens “signal window”.
2. Look for confluence: VWAP touch/proximity + CHoCH or BOS in direction.
3. Enter with proper risk management (stop beyond swing/zone, partials).
SETTINGS TIPS
• Enable “Require VWAP Confluence?” for strictest setups.
• Use “HTF Trend Filter?” to align with higher-timeframe EMA trend.
• Adjust “After sweep (bars)” to define signal validity window.
• FVGs are visual in Lite — advanced filtering and confirmation are in Pro.
WHO IT'S FOR
Scalpers, intraday, and swing traders looking for objective, visual signals based on liquidity sweeps and VWAP/FVG confluence.
PRO VERSION (full confirmations)
Adds advanced FVG/iFVG logic, more confluence filters, dynamic risk tools and extended alert packages — optimized for all timeframes.
👉 chartedgepro.gumroad.com/l/rmnbhw
NOTES
• For educational purposes only. No financial advice.
• “Lite” is open-source; redistribution of code follows TradingView rules.

Dynamic EMA x VWAP AlertsDynamic EMA × VWAP Alerts generates buy and sell signals only when an EMA crossover happens in a meaningful VWAP (or standard deviation band) context. By combining classic EMA logic with flexible VWAP anchors (Daily, Weekly, Rolling) and optional advanced filters (ATR, Relative Volume, Deviation, Distance, Time Windows) to trim noise further, the script creates location-aware, filterable alerts rather than “everywhere” crosses. The value for trading and originality here lies in the integration of one or multiple anchors, band gating, combinator logic, and advanced regime filters. It’s designed for use across multiple instruments and timeframes, where EMA/VWAP context is relevant. It can run quietly in the background while you focus on price action and your own S/R levels.
What it does (quick take)
Detects EMA crossovers (double or optional triple) and evaluates them in VWAP context.
Plots Buy/Sell markers only when all chosen conditions are met.
Clean UX: keep all or parts of the engine visible or hide everything and let alerts run based on the silent engine behind your own S/R levels in an uncluttered, practical chart, as illustrated below.
Engine illustration: All selected engines visible
Practical use case: Same snapshot sequence as above but all selected engines invisible
Swing examples (beyond intraday)
Signals-only (clean value view):
Signals + your own S/R lines:
EMA selection (choose your playbook)
Defaults: Fast 9, Medium 21 (common intraday combo).
Modes: Double Cross — Fast vs Medium.
Triple Cross (optional) — adds a Slow EMA trend filter (enable Slow > 0).
Ranges: you can set each EMA 0–200 (0 = hidden/off)
Visuals are optional; you can display or hide each EMA line
EMA cross footprints (optional): Helps you assess trend continuation or change.
Use your own strategy: switch to 9/50, 20/50, 50/200, or whatever EMA set you trust for your instrument/timeframe.
VWAP Selection (the context engine)
Daily VWAP – resets each chart day (00:00–23:59). Typical fit: scalpers and fast intraday decision points.
Weekly VWAP – resets at the start of the calendar week. Typical fit: intraday with higher-timeframe context (aligns day trades with weekly bias).
Rolling VWAP – an adjustable VWMA-based rolling anchor (not session-reset), used as a flexible context reference Typical fit: multi-day swings when you want a flexible anchor that adapts across sessions.
Standard deviation bands (σ ±1/±2/±3) available for each anchor and help you express the “how far from fair value” idea.
Why VWAP matters: it’s a running, volume-weighted anchor where strong moves relative to VWAP and its bands help frame mean-reversion vs. trend-continuation risk. Evaluating crosses relative to VWAP/±σ reduces “everywhere” noise and helps frame potential setups.
How alerts are decided
An alert triggers only when:
Your selected EMA crossover occurs, and
Your chosen VWAP gate(s) and any filters pass. (Computed on bar close to avoid mid-bar noise)
Signals and alerts do not repaint; alerts evaluate and fire once per bar close.
Alert gates (Single / AND / OR)
Select one VWAP source or combine two (e.g., Daily + Weekly) with Single, AND, or OR logic.
Choose gate levels from VWAP or standard deviation bands (±σ). Typical long logic: price at/under VWAP or −σ. Typical short logic: price at/over VWAP or +σ.
Practical recipes:
Trend-follow: Daily AND Weekly at/above VWAP → confirms strength on two anchors.
Mean-reversion probe: Daily OR Rolling at −1σ → allows earlier fades with flexibility.
Advanced filtering: Suitable for advanced/Quant traders
During the research and development of this indicator, the EMA/VWAP cross logic was tested on historical S&P500 Futures data to explore patterns on multiple timeframes. These selected filtering indicators below showed correlation between certain market conditions and chosen indicator thresholds, helping reduce noise and lower-quality alerts. Results were research-oriented and are not predictive of future performance.
Therefore, I have built these indicator filters that run silently in the background. They let you trim noise by requiring alerts to appear only in market regimes you define. Each one constrains alert conditions; using them together helps tailor alerts to your strategy—but overly strict settings may filter out most or all alerts.
Relative Volume (RVOL): compares current volume to a baseline; ensures alerts arrive with participation instead of thin tape.
Deviation Threshold (%): controls how close the cross must be to the VWAP/σ level; tight = anchored signals, loose = more activity.
ATR Gate (+ Relative regime): keeps alerts inside a volatility regime; avoids both dead tape and chaotic spikes.
Distance Guard: requires price to be at least X ticks/% away from VWAP; useful to avoid premature signals near fair value.
Note: It’s not recommended to activate all of them at once or change the values aggressively. Unless you’ve done deeper backtesting or machine learning calibration, you can easily filter out everything. Use small thresholds at first, then adjust to your instrument once you see how each filter changes alert frequency and quality. Advanced/quant users can fine-tune freely.
Case example:
Unfiltered: Timeframe 15 min, EMA Selection 9/21, VWAP gates Rolling (250 bars) OR Weekly
Filtered: Same setup as above + activated filters:
RVOL: 100 bars, Min. RVOL 0.4
Deviation threshold (%): 0.3
ATR Length: 14
Min ATR (%): 0.05
Relative regime: Base length 2000, Min Ratio 0.85, Max Ratio 2
Under the hood
This indicator leans on TradingView built-ins (e.g., EMA, VWMA, ATR, alertcondition) to maximize speed, stability, and compatibility while we implement the custom logic (VWAP anchors, band gating, combinator gates, advanced filters, time windows). Built-ins were easy to work with and reduced edge-case bugs and kept the visuals responsive, while the design gives fine-tuning and clean visuals—so both discretionary traders and quant-minded users can shape the alerts to their strategy and workflow.
Disclaimer
The tools, scripts, and indicators presented here are provided for educational and informational purposes only. They are not financial advice and should not be interpreted as investment recommendations, trading signals, or a solicitation to buy or sell any financial instrument.
All forms of trading and investing involve risk. The past performance of any security, strategy, or market condition does not guarantee future outcomes. Users are solely responsible for their own trading and investment decisions, including evaluating their financial situation, objectives, and risk tolerance.
By using this indicator, you acknowledge that you do so at your own risk. The author accepts no liability for any direct or indirect loss or damage—including, without limitation, loss of profits—that may arise from the use of, or reliance upon, this tool.

Multi-Exchange VWAP Aggregator (Crypto)Description:
This advanced VWAP indicator aggregates volume data from up to 9 cryptocurrency exchanges simultaneously, providing a more accurate volume-weighted average price than single-exchange VWAP calculations.
Key Features:
Multi-Exchange Aggregation - Combines volume from Binance, Coinbase, Bybit, Bitfinex, Bitstamp, Deribit, OKEx, Phemex, and FTX
Flexible Currency Pairs - Supports both spot (USD, USDT, EUR, USDC, BUSD, DAI) and perpetual futures contracts
Standard Deviation Bands - Includes customizable 1σ, 2σ, and 3σ bands for identifying overbought/oversold levels
Multiple Reset Periods - Daily, Weekly, Monthly, or Session-based VWAP calculations
Volume Calculation Options - Choose between SUM, AVG, MEDIAN, or VARIANCE for volume aggregation
Why Use This?
Traditional VWAP indicators only use volume from a single exchange, which can be misleading in fragmented crypto markets. This indicator provides a comprehensive market-wide VWAP by aggregating volume across major exchanges, giving you a more reliable benchmark for entries, exits, and institutional price levels.
Perfect for traders who want to see where the real volume-weighted price sits across the entire crypto market, not just one exchange.

VWAP Trend Strategy (Intraday) [KedarArc Quant]Description:
An intraday strategy that anchors to VWAP and only trades when a local EMA trend gate and a volume participation gate are both open. It offers two entry templates—Cross and Cross-and-Retest—with an optional Momentum Exception for impulsive moves. Exits combine a TrendBreak (structure flips) with an ATR emergency stop (risk cap).
Updates will be published under this script.
Why this merits a new script
This is not a simple “VWAP + EMA + ATR” overlay. The components are sequenced as gates and branches that *change the trade set* in ways a visual mashup cannot:
1. Trend Gate first (EMA fast vs. slow on the entry timeframe)
Counter-trend VWAP crosses are suppressed. Many VWAP scripts fire on every cross; here, no entry logic even evaluates unless the trend gate is open.
2. Participation Gate second (Volume SMA × multiplier)
This gate filters thin liquidity moves around VWAP. Without it, the same visuals would produce materially more false triggers.
3. Branching entries with structure awareness
* Cross: Immediate VWAP cross in the trend direction.
* Cross-and-Retest: Requires a revisit to VWAP vicinity within a lookback window (recent low near VWAP for longs; recent high for shorts). This explicitly removes first-touch fakeouts that a plain cross takes.
* Momentum Exception (optional): A quantified body% + volume condition can bypass the retest when flow is impulsive—intentional risk-timing, not “just another indicator.”
4. Dual exits that reference both anchor and structure
* TrendBreak: Close only when price loses VWAP and EMA alignment flips.
* ATR stop: Placed at entry to cap tail risk.
These exits complement the entry structure rather than being generic stop/target add-ons.
What it does
* Trades the session’s fair value anchor (VWAP), but only with local-trend agreement (EMA fast vs. slow) and sufficient participation (volume filter).
* Lets you pick Cross or Cross-and-Retest entries; optionally allow a fast Momentum Exception when candles expand with volume.
* Manages positions with a structure exit (TrendBreak) and an emergency ATR stop from entry.
How it works (concepts & calculations)
* VWAP (session anchor):
Standard VWAP of the active session; entries reference the cross and the retest proximity to VWAP.
* Trend gate:
Long context only if `EMA(fast) > EMA(slow)`; short only if `EMA(fast) < EMA(slow)`.
A *gate*, not a trigger—entries aren’t considered unless this is true.
* Participation (volume) gate:
Require `volume > SMA(volume, volLen) × volMult`.
Screens out low-participation wiggles around VWAP.
Entries:
* Cross: Price crosses VWAP in the trend direction while volume gate is open.
* Cross-and-Retest: After crossing, price revisits VWAP vicinity within `lookback` (recent *low near VWAP* for longs; recent *high near VWAP* for shorts).
* Momentum Exception (optional): If body% (|close−open| / range) and volume exceed thresholds, enter without waiting for the retest.
Exits:
* TrendBreak (structure):
* Longs close when `price < VWAP` and `EMA(fast) < EMA(slow)` (mirror for shorts).
* ATR stop (risk):
* From entry: `stop = entry ± ATR(atrLen) × atrMult`.
How to use it ?
1. Select market & timeframe: Intraday on liquid symbols (equities, futures, crypto).
2. Pick entry mode:
* Start with Cross-and-Retest for fewer, more selective signals.
* Enable Momentum Exception if strong moves leave without retesting.
3. Tune guards:
* Raise `volMult` to ignore thin periods; lower it for more activity.
* Adjust `lookback` if retests come late/early on your symbol.
4. Risk:
* `atrLen` and `atrMult` set the emergency stop distance.
5. Read results per session: Optional panel (if enabled) summarizes Net-R, Win%, and PF for today’s session to evaluate
behavior regime by regime.
⚠️ Disclaimer
This script is provided for educational purposes only.
Past performance does not guarantee future results.
Trading involves risk, and users should exercise caution and use proper risk management when applying this strategy.

Monthly VWAPDescription
This indicator identifies potential mean reversion opportunities by tracking price deviations from monthly VWAP with dynamic volatility-adjusted thresholds.
Core Logic:
The indicator monitors when price moves significantly away from monthly VWAP and looks for potential reversal opportunities. It uses ATR-based dynamic thresholds that adapt to current market volatility, combined with volume confirmation to filter out weak signals.
Key Features:
Adaptive Thresholds: ATR-based bands that adjust to market volatility
Volume Confirmation: Requires average volume spike to validate signals
Monthly Reset: VWAP anchors reset each month for fresh reference levels
Visual Clarity: Color-coded deviation line with background highlights for active signals
Info Panel: Shows days from anchor and current price context vs fair value
Signal Generation:
Buy Signal: Price below monthly VWAP by threshold amount with elevated volume
Sell Signal: Price above monthly VWAP by threshold amount with elevated volume
Neutral: Price within threshold range or insufficient volume
Best Used For:
Mean reversion strategies in ranging markets
Identifying potential oversold/overbought conditions
Understanding price position relative to monthly fair value
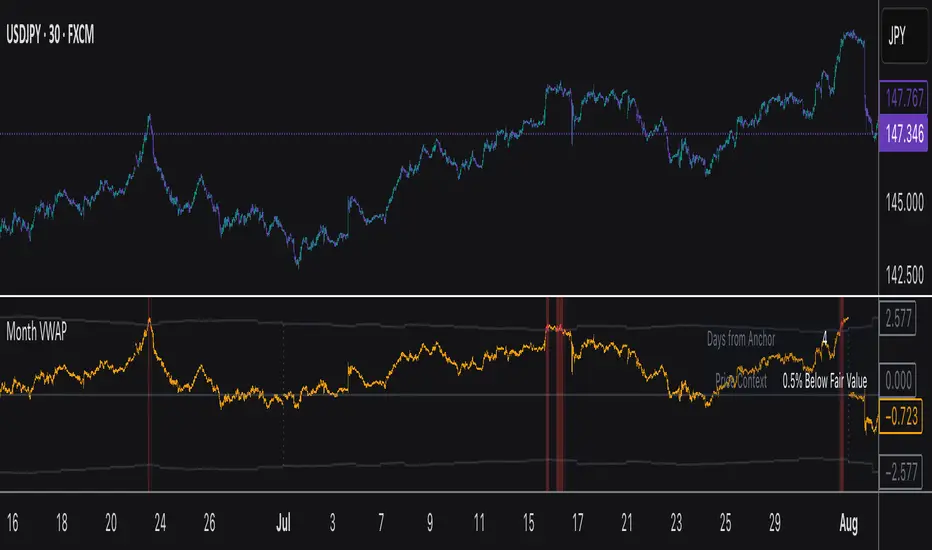
DVWAP Spread -WinCAlgoDynamic VWAP Spread Oscillator
This indicator transforms the relationship between two adaptive VWAP curves into an oscillator format, making trend analysis more precise and intuitive.
What it shows:
Spread Value: The difference between Fast VWAP and Smoothed VWAP
Dynamic Coloring: Intensity increases as the spread moves away from zero
Zero Line: The neutral point where both VWAP curves converge
How to interpret:
Above Zero (Green): Fast VWAP > Smoothed VWAP → Bullish bias
Below Zero (Red): Fast VWAP < Smoothed VWAP → Bearish bias
Distance from Zero: Shows the strength of the current trend
Zero Crossovers: Potential trend change signals
📌 Usage Ideas:
Trend Filter: Take long trades only when oscillator is positive, shorts when negative
Momentum Gauge: Larger spread values indicate stronger trend momentum
Divergence Analysis: Look for divergences between price and oscillator for reversal signals
Overbought/Oversold: Extreme values may indicate potential mean reversion opportunities
Zero Line Bounces: Use zero line as dynamic support/resistance for entries
Parameters:
Period: Controls the lookback period for adaptive calculations
Adjustment Step: Fine-tunes the adaptive smoothing sensitivity
Fast Response: Adjusts how quickly the fast VWAP responds to price changes
Source: Price input for VWAP calculation (default: HLC3)
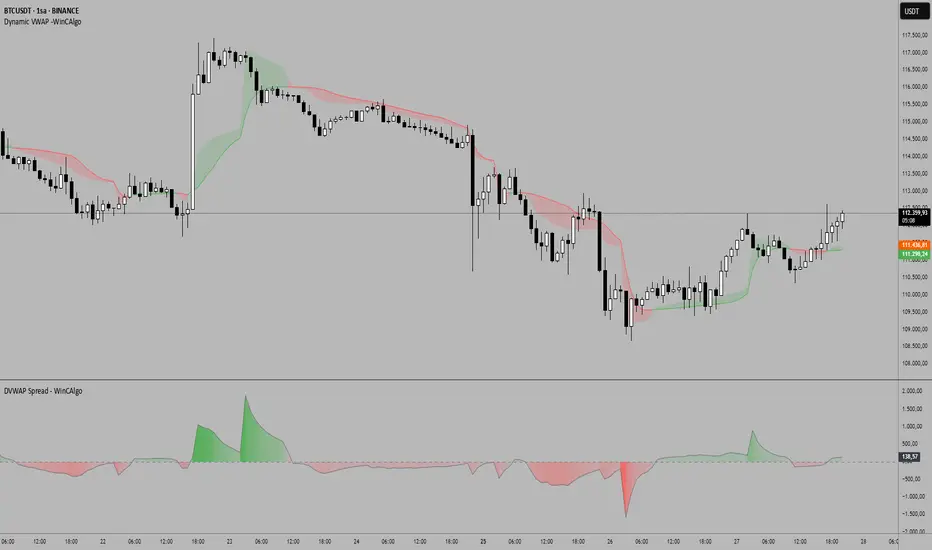
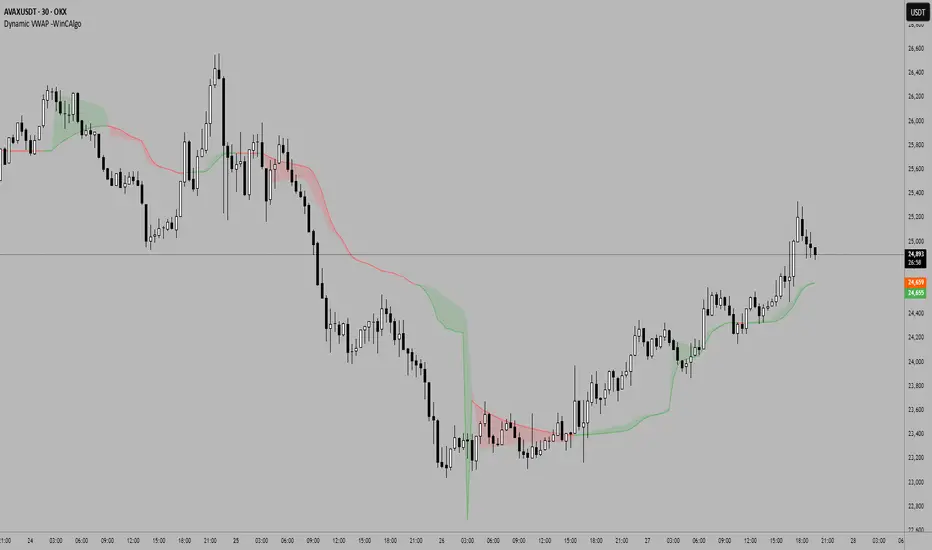
Dynamic VWAP -WinCAlgoDynamic VWAP Curve
This indicator applies an adaptive smoothing method to VWAP (Volume Weighted Average Price) to create two dynamic curves:
Fast VWAP (reacts quickly to price changes)
Smoothed VWAP (slower, adaptive baseline)
How to interpret:
When Fast VWAP > Smoothed VWAP, trend bias is bullish.
When Fast VWAP < Smoothed VWAP, trend bias is bearish.
The shaded area between the two lines works like a dynamic support/resistance zone.
📌 Usage ideas:
As a trend filter: take long trades only when Fast > Smoothed.
As a crossover signal: buy/sell when the two lines cross.
As support/resistance: price moving too far from the band can signal mean-reversion opportunities.
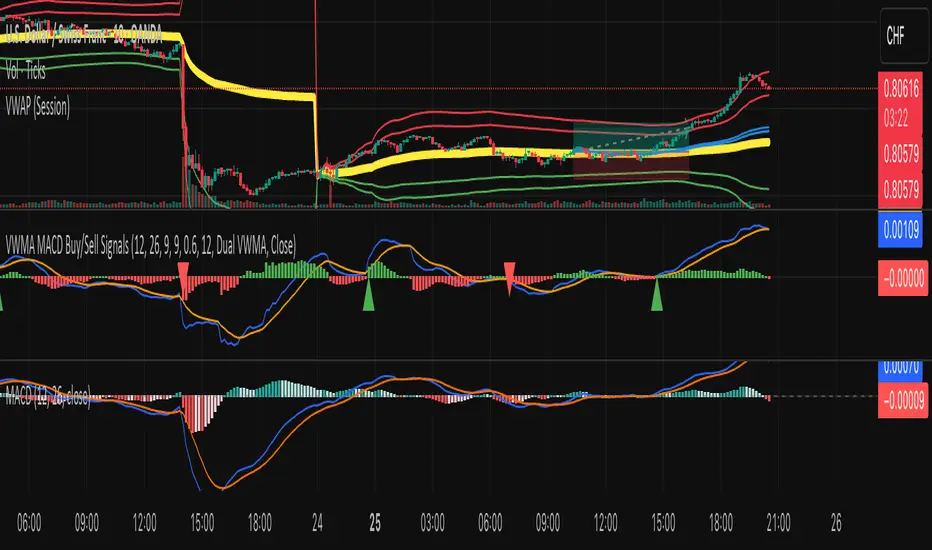
VWMA MACD Amanita Buy/Sell Signals VWMA MACD Amanita Buy/Sell Signals – Volume-Weighted Momentum Indicator
A twist on the classic MACD: this indicator uses Volume Weighted Moving Averages (VWMA) instead of EMAs, giving more weight to price moves backed by higher volume.
Features:
VWMA-based MACD line & signal line
Histogram highlights bullish/bearish momentum
Color-coded for easy visualization
Quick Guide:
MACD above Signal → bullish
MACD below Signal → bearish
Rising histogram → strengthening trend
Falling histogram → weakening trend
Perfect for traders who want momentum confirmed by volume.
Frozen 4H VWAP – Precision AnchoredFrozen 4H VWAP – Precision Anchored Like Ice
The Frozen 4H VWAP – Precision Anchored delivers a clean, stable, and reliable view of the 4-hour Volume Weighted Average Price, designed for traders who want higher timeframe insights without intrabar noise or repainting.
🔹 Key Features:
Non-Repainting: VWAP value is “frozen” at the close of each 4H candle — no mid-bar updates or flickering.
4H Timeframe Anchoring: Seamlessly pulls 4-hour VWAP values into any timeframe you’re trading on.
Clear Trend Reference: Updates only when a new 4H candle begins, acting as a trustworthy anchor for support/resistance.
Custom Source Option: Choose from different price sources (default: HLC3) to fit your strategy.
Whether you're scalping, day trading, or swing trading, this indicator gives you a powerful edge by grounding your decisions in higher timeframe VWAP data — clear, calm, and frozen in time.

Vantage-XVANTAGE-X – The Market. Decoded.
Your vantage point between bull & bear — clarity, precision, and high-probability trading signals.
VANTAGE-X is a high-probability trading system designed to cut through the noise and deliver clarity at a glance.
🔹 What It Does
• EMA 20 (1H), EMA 50 (4H), EMA 200 (chart timeframe) → Instant bullish/bearish signals
• VWAP → Bullish/Bearish/Neutral, based on last 5 candles for precision
• Daily Bias → Bullish or Bearish without switching charts
• Chop Filter → Detects if market is trending or choppy (last 10 candles)
• Works across all assets on TradingView — futures, forex, stocks, crypto, options
🔹 Why Traders Use It
• Eliminates chart clutter and analysis paralysis
• No more flipping timeframes — dashboard updates automatically
• Clear signals = faster decisions, cleaner trades
🚨 Subscription Access Only – Invite-Only Script
This indicator is available exclusively to subscribed members of VANTAGE-X. Access is tied to your TradingView username and managed manually by our team.
👉 Website coming soon

Volume Spikes + Daily VWAP SD BandsVolume Spikes + Daily VWAP SD Bands
This indicator combines volume spike detection to help traders identify potential absorption zones with daily VWAP and standard deviation bands , key price levels, continuation opportunities, and possible institutional bias.
Features:
Volume Spike Detection
Highlights candles with unusually high volume relative to a configurable SMA.
Optional filters:
Local highs/lows only (Only Use Valid Highs & Lows)
Candle shapes: Hammer / Shooter only
Candle color match: bullish spikes on green, bearish on red
Plots small circles above/below bars for bullish and bearish volume spikes.
Alerts available for both bullish and bearish spikes.
Interpretation: Volume spikes at local highs/lows can indicate absorption, where one side absorbs aggressive buying/selling pressure.
Daily VWAP
Calculates volume-weighted average price (VWAP) for the current day.
Optionally shows previous day’s VWAP for reference.
Plot lines are customizable with optional circles on lines for visual clarity.
Labels on the last bar show exact VWAP values.
Institutional Bias Insight: Price above both current and previous VWAPs may indicate bullish positioning; price below both VWAPs may indicate bearish positioning. Many professional traders consider this a clue to institutional bias, but it’s not guaranteed. Always confirm with volume, delta, or orderflow analysis.
Standard Deviation Bands
Optional x1 and x2 SD bands around the daily VWAP.
Visual fill between bands shows price volatility zones.
Can be used to identify potential support/resistance or absorption zones.
Use Case: Price bounces off first SD band may indicate continuation signals, especially when volume spikes occur at those levels.
Customizable Visuals
Colors for bullish and bearish volume spikes
VWAP and SD band colors and thickness
Optional circles and filled bands for better readability
Alerts
Bullish / Bearish Volume Spikes
Supports TradingView alert system for automated notifications
Advanced Use Cases:
Combine with Cumulative Delta or Orderflow tools to confirm true absorption zones.
Identify high-volume rejection candles signaling possible trend continuation.
Use VWAP positioning relative to price to assess potential institutional bias, keeping in mind it is probabilistic, not guaranteed.
Visualize intraday VWAP levels and volatility with SD bands for better trade timing.
Settings: Fully customizable, including volume multiplier, SMA length, session filter, candle shape, color options, and VWAP/SD display preferences.

DYNAMIC TRADING DASHBOARDStudy Material for the "Dynamic Trading Dashboard"
This Dynamic Trading Dashboard is designed as an educational tool within the TradingView environment. It compiles commonly used market indicators and analytical methods into one visual interface so that traders and learners can see relationships between indicators and price action. Understanding these indicators, step by step, can help traders develop discipline, improve technical analysis skills, and build strategies. Below is a detailed explanation of each module.
________________________________________
1. Price and Daily Reference Points
The dashboard displays the current price, along with percentage change compared to the day’s opening price. It also highlights whether the price is moving upward or downward using directional symbols. Alongside, it tracks daily high, low, open, and daily range.
For traders, daily levels provide valuable reference points. The daily high and low are considered intraday support and resistance, while the median price of the day often acts as a pivot level for mean reversion traders. Monitoring these helps learners see how price oscillates within daily ranges.
________________________________________
2. VWAP (Volume Weighted Average Price)
VWAP is calculated as a cumulative average price weighted by volume. The dashboard compares the current price with VWAP, showing whether the market is trading above or below it.
For traders, VWAP is often a guide for institutional order flow. Price trading above VWAP suggests bullish sentiment, while trading below VWAP indicates bearish sentiment. Learners can use VWAP as a training tool to recognize trend-following vs. mean reversion setups.
________________________________________
3. Volume Analysis
The system distinguishes between buy volume (when the closing price is higher than the open) and sell volume (when the closing price is lower than the open). A progress bar highlights the ratio of buying vs. selling activity in percentage.
This is useful because volume confirms price action. For instance, if prices rise but sell volume dominates, it can signal weakness. New traders learning with this tool should focus on how volume often precedes price reversals and trends.
________________________________________
4. RSI (Relative Strength Index)
RSI is a momentum oscillator that measures price strength on a scale from 0 to 100. The dashboard classifies RSI readings into overbought (>70), oversold (<30), or neutral zones and adds visual progress bars.
RSI helps learners understand momentum shifts. During training, one should notice how trending markets can keep RSI extended for longer periods (not immediate reversal signals), while range-bound markets react more sharply to RSI extremes. It is an excellent tool for practicing trend vs. range identification.
________________________________________
5. MACD (Moving Average Convergence Divergence)
The MACD indicator involves a fast EMA, slow EMA, and signal line, with focus on crossovers. The dashboard shows whether a “bullish cross” (MACD above signal line) or “bearish cross” (MACD below signal line) has occurred.
MACD teaches traders to identify trend momentum shifts and divergence. During practice, traders can explore how MACD signals align with VWAP trends or RSI levels, which helps in building a structured multi-indicator analysis.
________________________________________
6. Stochastic Oscillator
This indicator compares the current close relative to a range of highs and lows over a period. Displayed values oscillate between 0 and 100, marking zones of overbought (>80) and oversold (<20).
Stochastics are useful for students of trading to recognize short-term momentum changes. Unlike RSI, it reacts faster to price volatility, so false signals are common. Part of the training exercise can be to observe how stochastic “flips” can align with volume surges or daily range endpoints.
________________________________________
7. Trend & Momentum Classification
The dashboard adds simple labels for trend (uptrend, downtrend, neutral) based on RSI thresholds. Additionally, it provides quick momentum classification (“bullish hold”, “bearish hold”, or neutral).
This is beneficial for beginners as it introduces structured thinking: differentiating long-term market bias (trend) from short-term directional momentum. By combining both, traders can practice filtering signals instead of trading randomly.
________________________________________
8. Accumulation / Distribution Bias
Based on RSI levels, the script generates simplified tags such as “Accumulate Long”, “Accumulate Short”, or “Wait”.
This is purely an interpretive guide, helping learners think in terms of accumulation phases (when markets are low) and distribution phases (when markets are high). It reinforces the concept that trading is not only directional but also involves timing.
________________________________________
9. Overall Market Status and Score
Finally, the dashboard compiles multiple indicators (VWAP position, RSI, MACD, Stochastics, and price vs. median levels) into a Market Score expressed as a percentage. It also labels the market as Overbought, Oversold, or Normal.
This scoring system isn’t a recommendation but a learning framework. Students can analyze how combining different indicators improves decision-making. The key training focus here is confluence: not depending on one indicator but observing when several conditions align.
Extended Study Material with Formulas
________________________________________
1. Daily Reference Levels (High, Low, Open, Median, Range)
• Day High (H): Maximum price of the session.
DayHigh=max(Hightoday)DayHigh=max(Hightoday)
• Day Low (L): Minimum price of the session.
DayLow=min(Lowtoday)DayLow=min(Lowtoday)
• Day Open (O): Opening price of the session.
DayOpen=OpentodayDayOpen=Opentoday
• Day Range:
Range=DayHigh−DayLowRange=DayHigh−DayLow
• Median: Mid-point between high and low.
Median=DayHigh+DayLow2Median=2DayHigh+DayLow
These act as intraday guideposts for seeing how far the price has stretched from its key reference levels.
________________________________________
2. VWAP (Volume Weighted Average Price)
VWAP considers both price and volume for a weighted average:
VWAPt=∑i=1t(Pricei×Volumei)∑i=1tVolumeiVWAPt=∑i=1tVolumei∑i=1t(Pricei×Volumei)
Here, Price_i can be the average price (High + Low + Close) ÷ 3, also known as hlc3.
• Interpretation: Price above VWAP = bullish bias; Price below = bearish bias.
________________________________________
3. Volume Buy/Sell Analysis
The dashboard splits total volume into buy volume and sell volume based on candle type.
• Buy Volume:
BuyVol=Volumeif Close > Open, else 0BuyVol=Volumeif Close > Open, else 0
• Sell Volume:
SellVol=Volumeif Close < Open, else 0SellVol=Volumeif Close < Open, else 0
• Buy Ratio (%):
VolumeRatio=BuyVolBuyVol+SellVol×100VolumeRatio=BuyVol+SellVolBuyVol×100
This helps traders gauge who is in control during a session—buyers or sellers.
________________________________________
4. RSI (Relative Strength Index)
RSI measures strength of momentum by comparing gains vs. losses.
Step 1: Compute average gains (AG) and losses (AL).
AG=Average of Upward Closes over N periodsAG=Average of Upward Closes over N periodsAL=Average of Downward Closes over N periodsAL=Average of Downward Closes over N periods
Step 2: Calculate relative strength (RS).
RS=AGALRS=ALAG
Step 3: RSI formula.
RSI=100−1001+RSRSI=100−1+RS100
• Used to detect overbought (>70), oversold (<30), or neutral momentum zones.
________________________________________
5. MACD (Moving Average Convergence Divergence)
• Fast EMA:
EMAfast=EMA(Close,length=fast)EMAfast=EMA(Close,length=fast)
• Slow EMA:
EMAslow=EMA(Close,length=slow)EMAslow=EMA(Close,length=slow)
• MACD Line:
MACD=EMAfast−EMAslowMACD=EMAfast−EMAslow
• Signal Line:
Signal=EMA(MACD,length=signal)Signal=EMA(MACD,length=signal)
• Histogram:
Histogram=MACD−SignalHistogram=MACD−Signal
Crossovers between MACD and Signal are used in studying bullish/bearish phases.
________________________________________
6. Stochastic Oscillator
Stochastic compares the current close against a range of highs and lows.
%K=Close−LowestLowHighestHigh−LowestLow×100%K=HighestHigh−LowestLowClose−LowestLow×100
Where LowestLow and HighestHigh are the lowest and highest values over N periods.
The %D line is a smooth version of %K (using a moving average).
%D=SMA(%K,smooth)%D=SMA(%K,smooth)
• Values above 80 = overbought; below 20 = oversold.
________________________________________
7. Trend and Momentum Classification
This dashboard generates simplified trend/momentum logic using RSI.
• Trend:
• RSI < 40 → Downtrend
• RSI > 60 → Uptrend
• In Between → Neutral
• Momentum Bias:
• RSI > 70 → Bullish Hold
• RSI < 30 → Bearish Hold
• Otherwise Neutral
This is not predictive, only a classification framework for educational use.
________________________________________
8. Accumulation/Distribution Bias
Based on extreme RSI values:
• RSI < 25 → Accumulate Long Bias
• RSI > 80 → Accumulate Short Bias
• Else → Wait/No Action
This helps learners understand the idea of accumulation at lows (strength building) and distribution at highs (profit booking).
________________________________________
9. Overall Market Status and Score
The tool adds up 5 bullish conditions:
1. Price above VWAP
2. RSI > 50
3. MACD > Signal
4. Stochastic > 50
5. Price above Daily Median
BullishScore=ConditionsMet5×100BullishScore=5ConditionsMet×100
Then it categorizes the market:
• RSI > 70 or Stoch > 80 → Overbought
• RSI < 30 or Stoch < 20 → Oversold
• Else → Normal
This encourages learners to think in terms of probabilistic conditions instead of single-indicator signals.
________________________________________
⚠️ Warning:
• Trading financial markets involves substantial risk.
• You can lose more money than you invest.
• Past performance of indicators does not guarantee future results.
• This script must not be copied, resold, or republished without authorization from aiTrendview.
By using this material or the code, you agree to take full responsibility for your trading decisions and acknowledge that this is not financial advice.
________________________________________
⚠️ Disclaimer and Warning (From aiTrendview)
This Dynamic Trading Dashboard is created strictly for educational and research purposes on the TradingView platform. It does not provide financial advice, buy/sell recommendations, or guaranteed returns. Any use of this tool in live trading is completely at the user’s own risk. Markets are inherently risky; losses can exceed initial investment.
The intellectual property of this script and its methodology belongs to aiTrendview. Unauthorized reproduction, modification, or redistribution of this code is strictly prohibited. By using this study material or the script, you acknowledge personal responsibility for any trading outcomes. Always consult professional financial advisors before making investment decisions.

RTH Levels: VWAP + PDH/PDL + ONH/ONL + IBAlgo Index — Levels Pro (ONH/ONL • PDH/PDL • VWAP±Bands • IB • Gaps)
Purpose. A session-aware, non-repainting levels tool for intraday decision-making. Designed for futures and indices, with clean visuals, alerts, and a one-click Minimal Mode for screenshot-ready charts.
What it plots
• PDH/PDL (RTH-only) – Prior Regular Trading Hours high/low, computed intraday and frozen at the RTH close (no 24h mix-ups, no repainting).
• ONH/ONL – Prior Overnight high/low, held throughout RTH.
• RTH VWAP with ±σ bands – Volume-weighted variance, reset each RTH.
• Initial Balance (IB) – First N minutes of RTH, plus 1.5× / 2.0× extensions after IB completes.
• Today’s RTH Open & Prior RTH Close – With gap detection and “gap filled” alert.
• Killzone shading – NY Open (09:30–10:30 ET) and Lunch (11:15–13:30 ET).
• Values panel (top-right) – Each level with live distance in points & ticks.
• Right-edge level tags – With anti-overlap (stagger + vertical jitter).
• Price-scale tags – Native trackprice markers that always “stick” to the axis.
⸻
New in v6.4
• Minimal Mode: one click for a clean look (thinner lines, VWAP bands/IB extensions hidden, on-chart right-edge labels off; price-scale tags remain).
• Theme presets: Dark Hi-Contrast / Light Minimal / Futures Classic / Muted Dark.
• Anti-overlap controls: horizontal staggering, vertical jitter, and baseline offset to keep tags readable even when levels cluster.
⸻
Quick start (2 minutes)
1. Add to chart → keep defaults.
2. Sessions (ET):
• RTH Session default: 09:30–16:00 (US equities cash hours).
• Overnight Session default: 18:00–09:29.
Adjust for your market if you use different “day” hours (e.g., many use 08:20–13:30 ET for COMEX Gold).
3. Theme & Minimal Mode: pick a Theme Preset; enable Minimal Mode for screenshots.
4. Visibility: toggle PD/ON/VWAP/IB/References/Panel to taste.
5. Right-edge labels: turn Show Right-Edge Labels on. If they crowd, tune:
• Anti-overlap: min separation (ticks)
• Horizontal offset per tag (bars)
• Vertical jitter per step (ticks)
• Right-edge baseline offset (bars)
6. Alerts: open Add alert → Condition: and pick the events you want.
⸻
How levels are computed (no repainting)
• PDH/PDL: Intraday H/L are accumulated only while in RTH and saved at RTH close for “yesterday’s” values.
• ONH/ONL: Accumulated across the defined Overnight window and then held during RTH.
• RTH VWAP & ±σ: Volume-weighted mean and standard deviation, reset at the RTH open.
• IB: First N minutes of RTH (default 60). Extensions (1.5×/2.0×) appear after IB completes.
• Gaps: Today’s RTH open vs prior RTH close; “Gap Filled” triggers when price trades back to prior close.
⸻
Practical playbooks (how to trade around the levels)
1) PDH/PDL interactions
• Rejection: Price taps PDH/PDL then closes back inside → mean-reversion toward VWAP/IB.
• Acceptance: Close/hold beyond PDH/PDL with momentum → continuation to next HTF/IB target.
• Alert: PD Touch/Break.
2) ONH/ONL “taken”
• Often one ON extreme is taken during RTH. ONH Taken / ONL Taken → check if it’s a clean break or sweep & reclaim.
• Sweep + reclaim near VWAP can fuel rotations through the ON range.
3) VWAP ±σ framework
• Balanced: First tag of ±1σ often reverts toward VWAP.
• Trend: Persistent trade beyond ±1σ + IB break → target ±2σ/±3σ.
• Alerts: VWAP Cross and VWAP Reject (cross then immediate fail back).
4) IB breaks
• After IB completes, a clean IB break commonly targets 1.5× and sometimes 2.0×.
• Quick return inside IB = possible fade back to the opposite IB edge/VWAP.
• Alerts: IB Break Up / Down.
5) Gaps
• Gap-and-go: Opening drive away from prior close + VWAP support → trend until IB completion.
• Gap-fill: Weak open and VWAP overhead/underfoot → trade toward prior close; manage on Gap Filled alert.
Pro tip: Stack confluences (e.g., ONL sweep + VWAP reclaim + IB hold) and respect your execution rules (e.g., require a 5-minute close in direction, or your order-flow confirmation).
⸻
Inputs you’ll actually touch
• Sessions (ET): Session Timezone, RTH Session, Overnight Session.
• Visibility: toggles for PD/ON/VWAP/IB/Ref/Panel.
• VWAP bands: set σ multipliers (±1/±2/±3).
• IB: duration (minutes) and extension multipliers (1.5× / 2.0×).
• Style & Theme: Theme Preset, Main Line Width, Trackprice, Minimal Mode, and anti-overlap controls.
⸻
Alerts included
• PD Touch/Break — High ≥ PDH or Low ≤ PDL
• ONH Taken / ONL Taken — First in-RTH take of ONH/ONL
• VWAP Cross — Close crosses VWAP
• VWAP Reject — Cross then immediate fail back
• IB Break Up / Down — Break of IB High/Low after IB completes
• Gap Filled — Price trades back to prior RTH close
Setup: Add alert → Condition: Algo Index — Levels Pro → choose event → message → Notify on app/email.
⸻
Panel guide
The top-right panel shows each level plus live distance from last price:
LevelValue (Δpoints | Δticks)
Coloring: green if level is below current price, red if above.
⸻
Styling & screenshot tips
• Use Theme Preset that matches your chart.
• For dark charts, “Dark Hi-Contrast” with Main Line Width = 3 works well.
• Enable Trackprice for crisp axis tags that always stick to the right edge.
• Turn on Minimal Mode for cleaner screenshots (no VWAP bands or IB extensions, on-chart tags off; price-scale tags remain).
• If tags crowd, increase min separation (ticks) to 30–60 and horizontal offset to 3–5; add vertical jitter (4–12 ticks) and/or push tags farther right with baseline offset (bars).
⸻
Behavior & limitations
• Levels are computed incrementally; tables refresh on the last bar for efficiency.
• Right-edge labels are placed at bar_index + offset and do not track extra right-margin scrolling (TradingView limitation). The price-scale tags (from trackprice) do track the axis.
• “RTH” is what you define in inputs. If your market uses different day hours, change the session strings so PDH/PDL reflect your definition of “yesterday’s session.”
⸻
FAQ
Q: My PDH/PDL don’t match the daily chart.
A: By design this uses RTH-only highs/lows, not 24h daily bars. Adjust sessions if you want a different definition.
Q: Right-edge tags overlap or don’t sit at the far right.
A: Increase min separation / horizontal offset / vertical jitter and/or push tags farther with baseline offset. If you want markers that always hug the axis, rely on Trackprice.
Q: Can I change killzones?
A: Yes—edit the session strings in settings or request a version with user inputs for custom windows.
⸻
Disclaimer
Educational use only. This is not financial advice. Always apply your own risk management and confirmation rules.
⸻
Enjoy it? Please ⭐ the script and share screenshots using Minimal Mode + a Theme Preset that fits your style.

VWAP Suite {Phanchai}VWAP Suite {Phanchai}
Compact, readable, TradingView-friendly.
What is VWAP?
The Volume Weighted Average Price (VWAP) is the average price of a period weighted by traded volume. It’s used as a fair-value reference (mean) and resets at the start of each new period.
Included VWAP Modes
Session — resets each trading day (current session).
Week / Month / Quarter / Year — current calendar periods.
Anchored Week / Month / Quarter / Year — starts at the beginning of the previous completed period.
Rolling 7D / 30D / 90D — rolling windows: today + last 6/29/89 daily sessions.
Important
This suite does not generate buy/sell signals. It provides structure and confluence; decisions remain yours.
Use Cases
Identify fair-value zones / mean-reversion areas.
Plan TP / SL around periodic VWAPs.
Define DCA levels (e.g., anchored to prior week/month).
Gauge trend bias via VWAP slope and reactions.
How to Use
Inputs → VWAP 1..5: Choose the period per slot (Session, Anchored, Rolling, etc.) and toggle Show .
Sources: Select the price source for all VWAPs (default: HLC3).
Global: Line offset (bars) shifts plots visually (does not affect calculations).
Style tab: Adjust per-line colors, thickness, and line style.
Alerts
Price crosses a VWAP (per slot).
VWAP slope turns UP or DOWN (per slot).
Tips & Notes
Volume required: Poor/absent volume (e.g., some FX tickers) can degrade accuracy.
Anchored modes: Start at the prior period’s open; values appear only after that timestamp.
Rolling modes: Use completed daily sessions (including today).
Clutter control: If labels crowd, increase Line offset or hide unneeded slots.
Confluence: Combine with market structure, liquidity zones, or momentum filters for stronger context.
Built for clear VWAP workflows. Trade safe!
