VWAP RIBBONVWAP Ribbon Indicator
The VWAP Ribbon Indicator is a comprehensive technical analysis tool designed for TradingView, utilizing multiple Volume-Weighted Average Price (VWAP) calculations across different timeframes (Daily, Weekly, Monthly, Yearly, and Custom) to identify potential trading opportunities. It generates buy/sell signals, detects institutional bias, compression zones, breakouts, false breakouts, and reversions, providing traders with a robust framework for decision-making. The indicator is highly customizable, allowing users to tailor its settings to their trading style and timeframe.
Features
Multi-Timeframe VWAPs: Plots VWAPs for Daily, Weekly, Monthly, Yearly, and a user-defined Custom timeframe, each with configurable deviation bands.
Buy/Sell Signals: Generates signals based on price interactions with VWAPs, rebounds, and crosses, with adjustable sensitivity and minimum conditions.
Institutional Bias: Identifies bullish or bearish institutional bias based on VWAP alignments and slopes.
Compression Zones: Detects areas where VWAPs converge, indicating potential accumulation or distribution phases.
Breakout and False Breakout Detection: Identifies confirmed breakouts and false breakouts after compression zones, with volume and price confirmation.
Reversion Signals: Detects reversions after price excesses beyond VWAP deviation bands, anchored to pivot points.
Custom VWAP: Allows users to define a custom VWAP timeframe (e.g., specific hours, days, weeks) for tailored analysis.
Tactical Panel: Displays real-time signal and market data in a customizable panel (compact or detailed).
Advanced Filters: Incorporates volume, RSI, EMA, and candlestick patterns to enhance signal accuracy.
How to Use
Adding the Indicator:
In TradingView, go to the Pine Editor, paste the provided code, and click "Add to Chart."
The indicator will overlay VWAP lines and deviation bands on your chart, with optional labels and a tactical panel.
Configuration: The indicator is divided into several input groups for easy customization:
⚙️ Activate VWAPs in Signals: Enable or disable Daily, Weekly, Monthly, Yearly, or Custom VWAPs for signal generation.
Visual VWAP Ribbon Settings: Toggle visibility and adjust colors for VWAP lines and deviation bands. Customize the Custom VWAP timeframe (e.g., 4 hours, 2 days).
Buy/Sell Signals: Enable labels for basic signals ("B" for Buy, "S" for Sell), set minimum conditions (1–10), and adjust signal sensitivity (0.1–1.0).
Institutional Bias Conditions: Enable background coloring for bias, set minimum VWAP spacing (%), and optionally require price alignment with VWAPs.
Statistical Signals: Enable reversion labels, adjust lookback periods, and set volume gates for reversions.
VWAP Compression: Enable detection of VWAP convergence zones and breakout/false breakout signals.
Custom Signals: Enable labels for Custom VWAP rebounds with configurable cooldowns.
Pro Filters: Apply advanced filters like minimum VWAP slope, relative price confirmation, volume thresholds, RSI, and EMA weights.
Signal Weight Configuration: Assign weights to various conditions (e.g., price crosses, rebounds) to fine-tune signal scoring.
Tactical Panel: Enable the panel, choose its position (e.g., top-right), and select compact or detailed mode.
Interpreting Signals:
Buy/Sell Signals: Appear as "B" (Buy) or "S" (Sell) labels with detailed tooltips listing triggered conditions (e.g., price crossing Daily VWAP, rebound from lower band). Signals require a minimum number of conditions (default: 3) and a normalized score above the sensitivity threshold (default: 0.5).
Institutional Bias: Background coloring (green for bullish, red for bearish) indicates VWAP alignment (e.g., Daily > Weekly > Monthly) and slope conditions. Neutral bias has no coloring.
Compression Zones: Gray background highlights areas where VWAPs are within a user-defined threshold (default: 0.5%), signaling potential accumulation/distribution.
Breakout Signals: Labeled as "BREAK ▲" or "BREAK ▼" after exiting a compression zone with strong candlestick confirmation and volume.
False Breakout Signals: Labeled as "FALSE ▲" or "FALSE ▼" when price crosses a Daily VWAP band but reverses back, indicating a failed breakout.
Reversion Signals: Labeled as "▲ R ▬ BUY" or "▼ R ▬ SELL" at pivot points after price excesses beyond VWAP bands, confirmed by volume (if enabled).
Custom VWAP Signals: Labeled as "C-BUY" or "C-SELL" for rebounds off the Custom VWAP’s deviation bands, with configurable volume and candlestick filters.
Tactical Panel: Displays the latest signal, price, date, bias, compression status, trend direction, VWAP distances, volume state, and technical summary (slopes, band distances).
Best Practices:
Timeframe Selection: The indicator auto-scales parameters for different timeframes (Daily+, Intraday ≥1h, Sub-hour). Adjust settings like lookbackBars or devThreshold for specific timeframes if autoScaleReversion is disabled.
Signal Sensitivity: Increase signalSensitivity (e.g., 0.7) for stricter signals or decrease (e.g., 0.3) for more frequent signals. Adjust minConditions to balance signal frequency and reliability.
Volume Filters: Enable useVolumeGate or useLiquidityFilter for high-liquidity assets to reduce false signals in low-volume conditions.
Compression and Breakouts: Use compression zones to anticipate breakouts. Enable showBreakoutLabels and showfalseBreakoutLabels to monitor confirmed and failed breakouts.
Custom VWAP: Set a specific timeframe (e.g., 4 hours) for intraday trading or longer periods (e.g., 2 weeks) for swing trading. Enable showCustomSignalLabels for tailored signals.
Reversion Trading: Use reversion signals for mean-reversion strategies, especially in range-bound markets. Adjust devThreshold and pivotLength for sensitivity.
Tactical Panel: Use the detailed panel for a quick overview of market conditions. Compact mode is ideal for minimal screen clutter.
Alerts:
Set up alerts for:
Institutional Bias (Buy/Sell)
VWAP Compression (Start/End)
Basic Buy/Sell Signals
Reversion Signals (Buy/Sell)
Breakout Signals (Bullish/Bearish)
False Breakout Signals (Bullish/Bearish)
Custom VWAP Rebound Signals (Buy/Sell)
Weekly/Monthly/Yearly VWAP Rebound Signals
In TradingView, go to the Alerts tab, select the indicator, and choose the desired condition. Customize alert messages as needed.
Notes
Performance: The indicator uses max_bars_back=5000 and max_labels_count=500 to ensure compatibility with most assets. For low-liquidity assets, consider enabling useLiquidityFilter to avoid noisy signals.
Customization: Experiment with weights in the "Signal Weight Configuration" group to prioritize specific conditions (e.g., increase wReboundD for Daily VWAP rebounds).
Limitations: Signals are based on historical data and VWAP interactions. Always combine with other analysis tools and risk management strategies.
License: This indicator is released under the Mozilla Public License 2.0.
Vwaps

VWAP Multi-TimeframeThis is a multi-timeframe VWAP indicator that provides volume weighted average price calculations for the following time periods:
15min
30min
1H
2H
4H
6H
8H
12H
1D
1W
1M
3M
6M
1Y
You can use the lower timeframes for short term trend control areas and use the longer timeframes for long term trend control areas. Trade in the direction of the trend and watch for price reactions that you can trade when price gets close to or touches any of these levels.
This indicator will provide a data plot value of 1 for bullish when price is above all VWAPs that are turned on, -1 for bearish when price is below all VWAPs that are turned on and 0 for neutral when price is not above or below all VWAPs. Use this 1, -1, 0 value as a filter on your signal generating indicators so that you can prevent signals from coming in unless they are in the same direction as the VWAP trend.
Features
Trend direction value of 1, -1 or 0 to send to external indicators so you can filter your signal generating indicators using the VWAP trend.
Trend table that shows you whether price is above or below all of the major VWAPs. This includes the daily, weekly, monthly and yearly VWAPs.
Trend coloring between each VWAP and the close price of each candle so you can easily identify the trend direction.
Customization
Set the source value to use for all of the VWAP calculations. The default is HLC3.
Turn on or off each VWAP.
Change the color of each VWAP line.
Change the thickness of each VWAP line.
Turn on or off labels for each VWAP or turn all labels on or off at once.
Change the offset length from the current bar to the label text.
Change the label text color.
Turn on or off trend coloring for each VWAP.
Change the color for up trends and down trends.
Turn on or off the trend direction display table.
Change the location of the trend direction display table.
Adjust the background and text colors on the trend direction display table.
How To Use The Trend Direction Filtering Feature
The indicator will provide a data plot value of 1 for bullish when price is above all of the VWAPs that are turned on, a value of -1 for bearish when price is below all of the VWAPS that are turned on and a value of 0 for neutral when price is above and below some of the VWAPs that are turned on.
The name of the value to use with your external indicators will show up as: VWAP Multi-Timeframe: Trend Direction To Send To External Indicators
Make sure to use that as your source on your external indicators to get the correct values.
This 1, -1 or 0 value can then be used by another external indicator to tell the indicator what is allowed to do. For instance if you have another indicator that provides buy and sell signals, you can use this trend direction value to prevent your other indicator from giving a sell signal when the VWAP trend is bullish or prevent your other indicator from giving a buy signal when the VWAP trend is bearish.
You will need to program your other indicators to use this trend filtering feature, but this indicator is already set up with this filtering code so you can use it with any other indicator that you choose to filter(if you know how to customize pine script).
Markets You Can Use This Indicator On
This indicator uses volume and price to calculate values, so it will work on any chart that provides volume and price data.

Swing Anchored Vwap [BigBeluga]🔵 OVERVIEW
Swing Anchored Vwap tracks the market’s directional behavior by anchoring VWAPs (Volume Weighted Average Price) to dynamically detected swing highs and lows. It visually distinguishes the active swing VWAP from historical ones—offering traders a clean view of trend-aligned value zones with clearly marked inflection points.
🔵 CONCEPTS
Swing Anchored VWAPs: VWAPs are initiated from recent swing highs during downtrends and swing lows during uptrends.
Trend Detection: The indicator identifies trend shifts based on the breaking of recent highest or lowest price value.
Trend-Based Coloring:
• Green VWAPs: are drawn from swing lows in uptrends.
• Blue VWAPs: are drawn from swing highs in downtrends.
Sensitivity Control: The Length input defines how far back the script looks to determine swing points—shorter lengths make it more reactive.
🔵 FEATURES
Real-time VWAP projection from the current swing point, updated live.
Historical VWAP traces with slightly faded color to emphasize the current active one.
Swing markers automatically placed on highs/lows where VWAPs are anchored.
Label with price value at the end of each active VWAP line for clarity.
Adaptive color scheme that visually separates uptrend/downtrend zones.
🔵 HOW TO USE
Use active VWAP as a dynamic support/resistance guide during ongoing trends.
Observe breaks or rejections around these VWAPs for trend continuation or reversal clues .
Compare current price position relative to swing VWAPs to assess trend maturity and extension .
Combine with volume analysis or structure to increase conviction at swing points.
🔵 CONCLUSION
Swing Anchored Vwap merges the logic of anchored VWAPs and swing structure into a responsive visual tool. It helps traders stay aligned with the current trend while offering historical context via previous value anchors—ideal for intraday to swing-level analysis.

4 Anchored VWAPs This indicator shows 4 periods of Anchored VWAPs according to specific dates the user chose.

Previous VWAP Levels by Riotwolftrading The "Previous VWAP" indicator calculates and displays the previous session's Volume Weighted Average Price (VWAP) for five timeframes (Daily, Weekly, Monthly, Quarterly, Yearly).
Each VWAP is plotted as a horizontal line extending to the right edge of the chart, with customizable labels at the right to identify each level. The indicator is designed for traders who want to visualize key price levels from prior periods without cluttering the chart with current VWAPs or additional metrics like standard deviations.
**Functionality**:
- **Calculates Previous VWAPs**: Computes the VWAP for the previous session of each timeframe (Daily, Weekly, Monthly, Quarterly, Yearly) based on the input source (default: `hlc3`) and volume.
- **Visual Style** : Uses `line.new` to draw horizontal lines from five bars back to the current bar, ensuring the lines extend to the right edge of the chart. Labels are placed at the right edge using `label.new` for clear identification.
- **Customization** : Allows users to toggle visibility, adjust line styles, widths, colors, and label sizes, and choose between abbreviated or full label text.
- **Minimalist Design**: Focuses solely on previous VWAPs, omitting current VWAPs, rolling VWAPs, and standard deviation bands to keep the chart clean.
**Intended Use**: This indicator is useful for traders who rely on historical VWAP levels as support/resistance or reference points for trading decisions, particularly in strategies involving mean reversion or breakout trading.
---
### Rules and Features
*VWAP Calculation**:
- The VWAP is calculated as the cumulative sum of price (`src`) multiplied by volume (`sumSrcVol`) divided by the cumulative volume (`sumVol`) for each timeframe.
- The "previous VWAP" is the VWAP value from the prior session, captured when a new session begins (e.g., new day, week, month, etc.).
- The indicator uses the `hlc3` (average of high, low, close) as the default source, but users can modify this in the settings.
**Timeframes**:
- **Daily**: Previous day's VWAP.
- **Weekly**: Previous week's VWAP.
- **Monthly**: Previous month's VWAP.
- **Quarterly**: Previous quarter's VWAP (3 months).
- **Yearly**: Previous year's VWAP (12 months).
- New sessions are detected using `ta.change(time(period))` for each timeframe.
**Line Drawing**:
- Lines are drawn using `line.new` from `time ` (five bars back) to the current bar (`time`), ensuring they extend to the right edge of the chart.
- Lines are updated only on the last confirmed bar (`barstate.islast`) to optimize performance and avoid repainting.
- Previous lines are deleted (`line.delete`) to prevent overlapping or clutter.
**Labels**:
- Labels are drawn at the right edge (`x=time`, `xloc=xloc.bar_time`) with `label.new`.
- Users can choose between abbreviated labels (e.g., "pvD" for Previous Daily VWAP) or full labels (e.g., "Prev Daily VWAP").
- Label sizes are customizable (`tiny`, `small`, `normal`, `large`, `huge`).
- Labels are deleted (`label.delete`) on each update to maintain a clean chart.
5. **Customization Options**:
- **Visibility**: Toggle each VWAP (Daily, Weekly, Monthly, Quarterly, Yearly) on or off.
- **Colors**: Individual color settings for each VWAP line and label (default colors: Daily=#E12D7B, Weekly=#F67B52, Monthly=#EDCD3B, Quarterly=#3BBC54, Yearly=#2665BD).
- **Line Style**: Choose from `solid`, `dotted`, or `dashed` lines.
- **Line Width**: Adjustable from 1 to 4 pixels.
- **Label Settings**: Enable/disable labels, abbreviate text, and select label size.
- **Source**: Customize the price source (default: `hlc3`).
**Performance Optimization**:
- The indicator only updates lines and labels on the last confirmed bar to minimize computational overhead.
- Uses `var` to initialize variables and avoid unnecessary recalculations.
- Deletes previous lines and labels to prevent chart clutter.
---
### Usage Instructions
1. **Add to Chart**:
- In TradingView, go to the Pine Editor, paste the script, and click "Add to Chart."
- The indicator will overlay on the price chart, showing previous VWAP lines and labels.
2. **Configure Settings**:
- Open the indicator settings to customize:
- Toggle visibility of each VWAP timeframe.
- Adjust colors, line style, and width.
- Enable/disable labels, choose abbreviation, and set label size.
- Modify the source if needed (e.g., use `close` instead of `hlc3`).
3. **Interpretation**:
- **Previous VWAPs**: Act as dynamic support/resistance levels based on the prior session's volume-weighted price.
- **Timeframes**: Use shorter timeframes (Daily, Weekly) for intraday/swing trading, and longer timeframes (Monthly, Quarterly, Yearly) for positional trading.
- **Labels**: Identify each VWAP level at the right edge of the chart for quick reference.
4. **Best Practices**:
- Use on charts with sufficient volume data, as VWAP relies on volume (a warning is triggered if no volume data is available).
- Combine with other indicators (e.g., moving averages, RSI) for confirmation in trading strategies.
- Adjust line styles and colors to avoid visual overlap with other chart elements.
---
### Example Use Case
A trader using a 1-hour chart can add the "Previous VWAP" indicator to identify key levels from the prior day, week, or month. For example:
- The Previous Daily VWAP might act as a support level for a bullish trend.
- The Previous Weekly VWAP could serve as a target for a swing trade.
- Labels at the right edge make it easy to identify these levels without cluttering the chart.
This indicator provides a clean, customizable way to visualize previous VWAPs, making it ideal for traders who want historical price context with minimal chart noise. For the complete Pine Script code, refer to the artifact provided in the previous response.

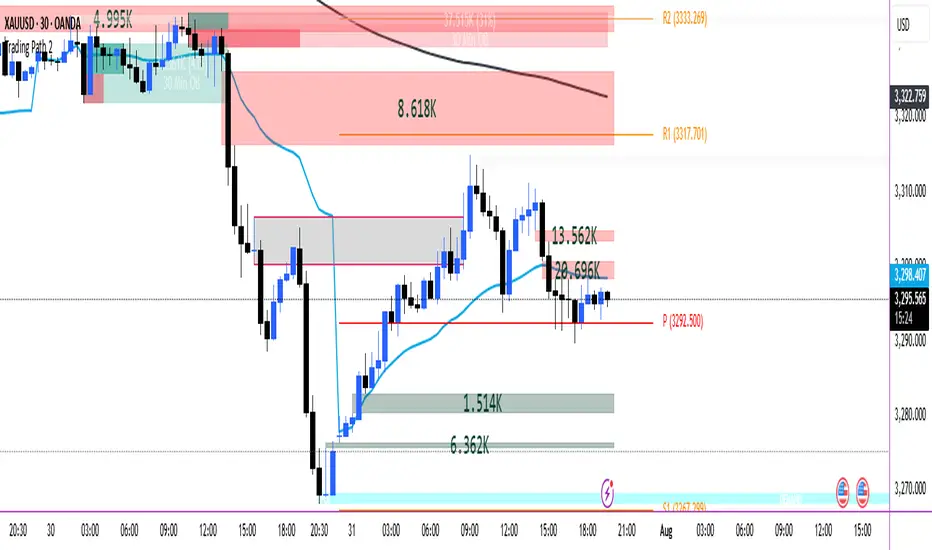
Trading Path
Below indicator are combined in them.
POI
VOLUME FVG
ORDER BLOCKS
VWAP
200 EMA HIGH
PIVOT
VWAP Multi-Period with SD & Value ZonesVWAP Multi-Period with SD & Value Zones
A dynamic VWAP indicator that works on Weekly, Monthly, Quarterly (3M) and Yearly (12M) timeframes.
VWAP line: true volume-weighted average price
±1, ±2, ±3 SD bands: volume-weighted volatility levels
Value Zone: filled area between ±1 SD
Prior Value Zone: last period’s ±1 SD area extended into the new period
Usage: Add to chart, select your period (W/M/3M/12M), and use the bands and zones as volume-weighted support/resistance and risk boundaries.
Demander à ChatGPT
EMA 8/21 Crossover Alert IndicatorOverview of the Indicator
This is a custom Pine Script v5 indicator for TradingView titled "EMA 8/21/50 + VWAP Crossover Alert Indicator" (short title: "EMA+VWAP Cross Alert"). It's designed as an overlay indicator, meaning it plots directly on your price chart rather than in a separate pane. The primary purpose is to detect and alert on crossovers between the 8-period Exponential Moving Average (EMA) and the 21-period EMA, which can signal potential bullish or bearish momentum shifts. These are classic short-term trend reversal or continuation signals often used in trading strategies like momentum or swing trading.
To enhance analysis, it also includes:
A 50-period EMA for medium-term trend context (e.g., to confirm if the overall trend aligns with the crossover).
A Volume Weighted Average Price (VWAP) line, which provides a benchmark for the average price weighted by volume, useful for identifying intraday value areas or fair price levels.
The indicator works across all timeframes (e.g., Daily, 4H, 1H, 15M, 5M, 3M) because the calculations are based on the chart's current bars and adapt to volatility and data resolution. It's not a trading strategy (no entry/exit logic or backtesting), but an alert tool—signals are visual and can trigger notifications in TradingView. Always combine it with risk management, as crossovers can produce false signals in ranging or choppy markets.
How It Behaves Across Timeframes
Higher Timeframes (e.g., Daily/4H): Fewer crossovers, focusing on major trends. EMAs smooth out noise; VWAP might represent session averages.
Lower Timeframes (e.g., 3M/5M): More frequent signals due to sensitivity, but higher risk of whipsaws. VWAP resets per session, making it great for intraday trading.
Adaptability: All components scale with bar data—no manual adjustments needed, though tweaking inputs can optimize for specific frames.
In TradingView, you can set up these alerts to notify via popup, sound, email, SMS, or webhook (e.g., to a trading bot). Go to the chart's "Alert" button, select this indicator, and choose conditions like "Bullish Cross" or use the script's built-in alerts.

52SIGNAL RECIPE VWAP Quantum Matrix Pro═══52SIGNAL RECIPE VWAP Quantum Matrix Pro ═══
◆ Overview
52SIGNAL RECIPE VWAP Quantum Matrix Pro is an advanced technical indicator based on Volume Weighted Average Price (VWAP), integrating volatility-adjusted bands and Fibonacci levels to provide multi-dimensional analysis of price movements.
It automatically applies optimized lookback periods for different timeframes, providing customized analysis for various trading styles, and helps traders effectively identify critical support/resistance zones through precise price level identification.
─────────────────────────────────────
◆ Key Features
• **Adaptive VWAP Bands**: Automatically adjusting upper and lower bands based on market volatility
• **Fibonacci Integration**: Fibonacci levels (23.6%, 38.2%, 50%, 61.8%, 78.6%) extended around VWAP center
• **Timeframe Optimization**: Automatic lookback period adjustment for each chart cycle
• **Pivot Point Analysis**: Core support/resistance levels based on volume-weighted highs and lows
• **Precision Labeling**: Accurate numerical display for all major price levels
• **Visual Gradation**: Intuitive visualization through color gradation for each Fibonacci level
─────────────────────────────────────
◆ Technical Foundation
■ VWAP Calculation Principles
• **Volume Weighting**: Calculation of real equilibrium price considering volume rather than simple price averaging
• **Standard Deviation Bands**: Statistical fluctuation range setting around VWAP center
• **Volatility Adjustment Mechanism**: Dynamic band width adjustment using current ATR to historical ATR ratio
• **Precise Price Range**: Identification of highest/lowest price range within specified lookback period
■ Fibonacci Band Implementation
• **VWAP-Centered Extension**: Division of distance from centerline (VWAP) to standard deviation bands by Fibonacci ratios
• **Symmetrical Upper/Lower Structure**: Application of identical Fibonacci ratios in both upward and downward directions
• **Color Gradation**: Progressive color changes for each Fibonacci level providing visual depth
─────────────────────────────────────
◆ Practical Applications
■ Price Movement Interpretation
• **Central Reference Point**:
▶ VWAP serves as intraday/period equilibrium price providing balance point of buying/selling pressure
▶ Movement above/below VWAP can be interpreted as short-term bullish/bearish signals
• **Band Reaction Patterns**:
▶ Reaching outer bands (100%) signals overbought/oversold conditions
▶ Reaction patterns between Fibonacci levels provide basis for trend strength and persistence judgment
■ Trading Strategy Utilization
• **Range-bound Trading**:
▶ Short-term trading utilizing bounce patterns between Fibonacci levels
▶ Oscillation trading between centerline (VWAP) and Fibonacci levels
• **Trend Following Strategy**:
▶ Breakout of Fibonacci levels aligned above/below VWAP signals trend strengthening
▶ Strong momentum confirmation when re-entering after outer band breakout
─────────────────────────────────────
◆ Advanced Configuration Options
■ Input Parameter Guide
• **Base Standard Deviation** (Default: 2.0)
▶ 1.0-1.5: Narrow bands, suitable for short-term trading
▶ 1.8-2.2: Balanced bands, optimal for general market conditions
▶ 2.5-3.0: Wide bands, suitable for long-term positions
• **Maximum/Minimum Standard Deviation** (Default: 3.0/1.0)
▶ Maximum: Cryptocurrency (4.0), Stocks/Forex (3.0), Low volatility (2.5)
▶ Minimum: Intraday trading (0.8), General (1.0), Long-term (1.5)
• **Volatility Measurement Period** (Default: 20)
▶ Short-term (10-14): Fast response, intraday trading
▶ Medium-term (15-25): Balanced response, swing trading
▶ Long-term (30-50): Noise filtering, long-term investment
• **Use Volatility Adjustment** (Default: On)
▶ On: Automatic band width adjustment based on current market volatility (recommended)
▶ Off: Fixed standard deviation bands usage
■ Timeframe-Specific Optimal Settings
• **Intraday Trading** (15min-1hr): Base standard deviation 1.8, volatility period 14
• **Swing Trading** (4hr-daily): Base standard deviation 2.0, volatility period 20
• **Position Trading** (daily-weekly): Base standard deviation 2.5, volatility period 30
■ Market-Specific Optimal Settings
• **Stock Market**: Base standard deviation 2.0, volatility period 20
• **Forex Market**: Base standard deviation 1.8, volatility period 25
• **Cryptocurrency Market**: Base standard deviation 2.5, volatility period 14, maximum standard deviation 4.0
─────────────────────────────────────
◆ Synergy with Other Indicators
• **Moving Averages**: VWAP and major moving average crossovers strengthen trend reversal signals
• **RSI/Stochastic**: Combination of VWAP band reactions in overbought/oversold zones improves reversal signal accuracy
• **Bollinger Bands**: VWAP Quantum Matrix and Bollinger Band convergence/divergence patterns are useful for volatility change prediction
• **Fibonacci Retracement**: Strong support/resistance formation when trend-direction Fibonacci retracement matches VWAP Fibonacci levels
• **Horizontal Support/Resistance**: Reaction probability significantly increases when past important price levels match VWAP Fibonacci levels
─────────────────────────────────────
◆ Conclusion
VWAP Quantum Matrix Pro provides deep insights into price action by integrating volatility-adjusted bands and Fibonacci theory into traditional VWAP analysis.
It dynamically responds to market environment changes through volume weighting and volatility adaptation mechanisms, and can be flexibly applied to various trading styles through timeframe-optimized lookback period settings.
Through appropriate input parameter configuration, the indicator can be optimized to match each trader's style and objectives, and through combination with other technical indicators, it strengthens confidence in trading decisions, ultimately enabling more precise and systematic market approaches.
─────────────────────────────────────
※ Disclaimer: Past performance does not guarantee future results. Always use appropriate risk management strategies.
═══52SIGNAL RECIPE VWAP Quantum Matrix Pro ═══
◆ 개요
52SIGNAL RECIPE VWAP Quantum Matrix Pro는 거래량 가중 평균 가격(VWAP)을 기반으로 하는 고급 기술적 지표로, 변동성 조정 밴드와 피보나치 레벨을 통합하여 가격 움직임을 다차원적으로 분석합니다.
타임프레임별로 최적화된 룩백 기간을 자동 적용하여 다양한 거래 스타일에 맞춤화된 분석을 제공하며, 정밀한 가격 레벨 식별을 통해 트레이더가 중요한 지지/저항 구간을 효과적으로 파악할 수 있도록 돕습니다.
─────────────────────────────────────
◆ 주요 특징
• **적응형 VWAP 밴드**: 시장 변동성에 따라 자동으로 조정되는 상하단 밴드 제공
• **피보나치 통합**: VWAP 중심으로 피보나치 레벨(23.6%, 38.2%, 50%, 61.8%, 78.6%) 확장
• **타임프레임 최적화**: 각 차트 주기에 맞춰 자동으로 룩백 기간 조정
• **피봇 포인트 분석**: 거래량 가중 고저가 기반의 핵심 지지/저항 레벨 표시
• **정밀 레이블링**: 모든 주요 가격 레벨에 정확한 수치 표시
• **시각적 그라데이션**: 피보나치 레벨별 컬러 그라데이션으로 직관적인 시각화
─────────────────────────────────────
◆ 기술적 기반
■ VWAP 계산 원리
• **거래량 가중치**: 단순 가격 평균이 아닌 거래량을 고려한 실질적 균형 가격 계산
• **표준편차 밴드**: VWAP 중심으로 통계적 변동 범위 설정
• **변동성 조정 메커니즘**: 현재 ATR과 과거 ATR 비율을 활용한 동적 밴드폭 조정
• **정밀 가격 범위**: 지정된 룩백 기간 내 최고/최저 가격 범위 식별
■ 피보나치 밴드 구현
• **VWAP 중심 확장**: 중심선(VWAP)에서 표준편차 밴드까지의 거리를 피보나치 비율로 분할
• **상하단 대칭 구조**: 상승과 하락 방향으로 동일한 피보나치 비율 적용
• **색상 그라데이션**: 피보나치 레벨별 점진적 색상 변화로 시각적 깊이감 제공
─────────────────────────────────────
◆ 실용적 응용
■ 가격 움직임 해석
• **중심 기준점**:
▶ VWAP은 일중/기간 내 균형가격으로 매수/매도 압력의 균형점 제공
▶ VWAP 위/아래 움직임은 단기 강세/약세 신호로 해석 가능
• **밴드 반응 패턴**:
▶ 외부 밴드(100%)에 도달 시 과매수/과매도 상태 시그널
▶ 피보나치 레벨 간 반응 패턴은 추세 강도와 지속성 판단 근거
■ 트레이딩 전략 활용
• **범위 내 거래**:
▶ 피보나치 레벨 간 바운스 패턴 활용한 단기 매매
▶ 중심선(VWAP)과 피보나치 레벨 간 오실레이션 거래
• **추세 추종 전략**:
▶ VWAP 위/아래 정렬된 피보나치 레벨 돌파는 추세 강화 신호
▶ 외부 밴드 돌파 후 다시 진입 시 강한 모멘텀 확인
─────────────────────────────────────
◆ 고급 설정 옵션
■ 인풋 파라미터 가이드
• **기본 표준 편차 (Base Standard Deviation)** (기본값: 2.0)
▶ 1.0-1.5: 좁은 밴드, 단기 거래에 적합
▶ 1.8-2.2: 균형 잡힌 밴드, 일반적 시장 환경에 최적
▶ 2.5-3.0: 넓은 밴드, 장기 포지션에 적합
• **최대/최소 표준 편차 (Maximum/Minimum Standard Deviation)** (기본값: 3.0/1.0)
▶ 최대: 암호화폐(4.0), 주식/외환(3.0), 저변동성(2.5)
▶ 최소: 일중 거래(0.8), 일반(1.0), 장기(1.5)
• **변동성 측정 기간 (Volatility Measurement Period)** (기본값: 20)
▶ 단기(10-14): 빠른 반응, 일중 거래
▶ 중기(15-25): 균형 잡힌 반응, 스윙 트레이딩
▶ 장기(30-50): 노이즈 필터링, 장기 투자
• **변동성 조정 사용 (Use Volatility Adjustment)** (기본값: 켜짐)
▶ 켜짐: 현재 시장 변동성에 따라 밴드 폭 자동 조정 (권장)
▶ 꺼짐: 고정된 표준편차 밴드 사용
■ 타임프레임별 최적 설정
• **일중 거래** (15분-1시간): 기본 표준편차 1.8, 변동성 기간 14
• **스윙 트레이딩** (4시간-일봉): 기본 표준편차 2.0, 변동성 기간 20
• **포지션 트레이딩** (일봉-주봉): 기본 표준편차 2.5, 변동성 기간 30
■ 시장별 최적 설정
• **주식 시장**: 기본 표준편차 2.0, 변동성 기간 20
• **외환 시장**: 기본 표준편차 1.8, 변동성 기간 25
• **암호화폐 시장**: 기본 표준편차 2.5, 변동성 기간 14, 최대 표준편차 4.0
─────────────────────────────────────
◆ 다른 지표와의 시너지
• **이동평균선**: VWAP과 주요 이동평균선 교차는 추세 전환 신호 강화
• **RSI/스토캐스틱**: 과매수/과매도 구간에서 VWAP 밴드 반응과 결합 시 반전 신호 정확도 향상
• **볼린저 밴드**: VWAP Quantum Matrix와 볼린저 밴드 수렴/발산 패턴은 변동성 변화 예측에 유용
• **피보나치 리트레이스먼트**: 추세 방향 피보나치 리트레이스먼트와 VWAP 피보나치 레벨 일치 시 강력한 지지/저항 형성
• **수평 지지/저항**: 과거 중요 가격대와 VWAP 피보나치 레벨 일치 시 반응 확률 대폭 증가
─────────────────────────────────────
◆ 결론
VWAP Quantum Matrix Pro는 전통적인 VWAP 분석에 변동성 조정 밴드와 피보나치 이론을 통합하여 가격 행동에 대한 깊이 있는 통찰력을 제공합니다.
거래량 가중치와 변동성 적응 메커니즘을 통해 시장 환경 변화에 동적으로 대응하며, 타임프레임별 최적화된 룩백 기간 설정으로 다양한 거래 스타일에 유연하게 적용할 수 있습니다.
적절한 인풋 파라미터 설정을 통해 각 트레이더의 스타일과 목표에 맞게 지표를 최적화할 수 있으며, 다른 기술적 지표들과의 조합을 통해 트레이딩 결정에 대한 확신을 강화하고, 궁극적으로 더 정밀하고 체계적인 시장 접근을 가능하게 합니다.
─────────────────────────────────────
※ 면책 조항: 과거 성과가 미래 결과를 보장하지 않습니다. 항상 적절한 리스크 관리 전략을 사용하세요.

The Great Anchors: Dual AVWAP Powered by RSI
The Great Anchors
*Dual Anchored Volume Weighted Average Price Powered by RSI*
---
📌 Overview
The Great Anchors is a dual AVWAP-based indicator that resets dynamically using RSI extremes — either from the current asset or a master symbol (e.g., BTCUSDT). It identifies meaningful shifts in price structure and momentum using these "anchored" levels.
It’s designed to help traders spot trend continuations, momentum inflection points, and entry signals aligned with overbought/oversold conditions — but only when the market confirms through volume-weighted price direction.
---
🛠 Core Logic
• AVWAP 1 (favwap): Anchored when RSI reaches overbought levels (top anchor)
• AVWAP 2 (savwap): Anchored when RSI reaches oversold levels (bottom anchor)
• AVWAPs are recalculated each time a new OB/OS condition is triggered — acting like "fresh anchors" at key market turning points.
---
⚙️ Key Features
🔁 Auto or Manual RSI Thresholds
→ Automatically determines dynamic RSI OB/OS levels based on past peaks and troughs, or lets you set fixed levels.
🧠 Master Symbol Control
→ Use the RSI of a separate asset (like BTCUSDT, ETHUSDT, SOLUSDT, BNBUSDT, SUPRAUSDT) or indices (like TOTAL, TOTAL2, BFR) to control resets — ideal for tracking how BTC/major coins impacts altcoins/others.
🔍 Trend-Filtering Signal Logic
→ Signals are filtered for less noise and are triggered when:
- Both AVWAPs are rising (bullish) or falling (bearish)
- Price action confirms the structure
🎯 Visual Markers & Alerts
→ "💥" for bullish signals and "🔥" for bearish ones. Alerts included for automation or push notifications.
---
🎯 How to Use It
1. Add the indicator to your chart.
2. Choose whether to use RSI from the current symbol or a master symbol (e.g., BTC).
3. Select auto-adjusted or manual OB/OS levels.
4. Watch for:
- AVWAP(s) making a significant change (at this point it's one of the AVWAPs resetting)
- Check if price flip it upwards or downwards
- If price goes above both AVWAPs thats a likely bullish trend
- If price can't go above both AVWAPs up and fall bellow both that's a likely bearish trend
- Price retesting upper AVWAP and bounce
- likely bullish continuation
- Price retesting lower AVWAP and dip
- likely bearish continuation
- Signal icons on chart ("💥 - Bullish" or "🔥- Bearish")
Best suited for:
• Swing traders
• Momentum traders
• Traders timing altcoin entries using BTC/Major asset's RSI
---
🔔 Signal Explanation
💥 Bullish Signal =
• Both AVWAPs rising
• Higher lows in price structure
• Bullish candle close
• Triggered from overbought RSI reset
🔥 Bearish Signal =
• Both AVWAPs falling
• Lower highs in price structure
• Bearish candle close
• Triggered from oversold RSI reset
Signals reset by opposite signals to prevent noise or overfitting.
---
⚠️ Tips & Notes
• Use AVWAPs as dynamic support/resistance, even without signal triggers
• Pair with volume or divergence tools for stronger confirmation
---
🧩 Credits & Philosophy
This tool is built with a simple philosophy:
"Anchor your trades to meaningful moments in price — not arbitrary time."
The dual AVWAP concept helps you see how price reacts after momentum peaks, giving you a cleaner bias and more precise trade setups.
---

VWAP/VOL [Extension] | FractalystWhat's the indicator's purpose and functionality?
The VWAP/VOL Extension is designed specifically as a bias identification system for the Quantify Trading Model.
This extension uses volume-weighted average price analysis combined with institutional volume classification to automatically detect market bias without requiring optimization periods that lead to overfitting.
The system provides real-time bias signals (bullish/bearish/neutral) that integrate directly with Quantify's machine learning algorithms, enabling institutional-level backtesting and automated entry/exit identification based on genuine market structure rather than curve-fitted parameters.
How does this extension work with the Quantify Trading Model?
The VWAP/VOL Extension serves as the bias detection engine for Quantify's automated trading system.
Instead of manually selecting bias direction, this extension automatically identifies market bias using:
- Volume-weighted VWAP analysis with three-state detection (bullish/bearish/neutral)
- Institutional volume classification using relative volume thresholds without optimization
- Non-repainting architecture ensuring consistent bias signals for Quantify's machine learning
The extension outputs bias signals that Quantify uses as input through the `input.source()` function, allowing the Trading Model to focus on optimal entry/exit timing while the extension handles bias identification.
Why doesn't this use optimization periods like other indicators?
The VWAP/VOL Extension deliberately avoids optimization periods to prevent overfitting bias that destroys out-of-sample performance. The system uses:
- Fixed mathematical thresholds based on market structure principles rather than optimized parameters
- Relative volume analysis using standard 2.0x/0.5x ratios that work across all market conditions
- VWAP distance calculations based on percentage thresholds without curve-fitting
- Gap enforcement using fixed 5-bar minimums for disciplined bias detection
This approach ensures the bias signals remain robust across different market regimes without the performance degradation typical of over-optimized systems.
Can this extension be used independently for discretionary trading?
No, the VWAP/VOL Extension is specifically engineered to work as a component within the Quantify ecosystem. The extension is designed to:
- Provide bias input for Quantify's machine learning algorithms
- Enable automated backtesting through systematic bias identification
- Support institutional-level analysis when combined with Quantify's ML entry model
Using this extension independently would miss the primary value proposition of systematic entry/exit optimization that Quantify provides.
The extension handles bias detection so Quantify can focus on probability-based trade timing and risk management.
How does this enable institutional-level backtesting?
The extension transforms discretionary bias identification into systematic institutional analysis by:
- Eliminating subjective bias selection through automated VWAP/volume analysis
- Providing consistent historical signals with non-repainting architecture for accurate backtesting
- Integrating with Quantify's algorithms to identify optimal entry patterns based on objective bias states
- Enabling performance analysis across multiple market regimes without optimization bias
This combination allows Quantify to run institutional-grade backtests with consistent bias identification, generating reliable performance statistics and risk metrics that reflect genuine market edge rather than curve-fitted results.
How do I integrate this with the Quantify Trading Model?
Integration enables institutional-grade systematic trading through advanced machine learning and statistical validation:
- Add both VWAP/VOL Extension and Quantify Trading Model to your chart
- Select VWAP/VOL Extension as the bias source using input.source()
- Quantify automatically uses the extension's bias signals for entry/exit analysis
- The built-in machine learning algorithms score optimal entry and exit levels based on trend intensity, volume conviction, and market structure patterns identified by the extension
The extension handles all bias detection complexity while Quantify focuses on optimal trade timing, position sizing, and risk management along with PineConnector automation
What markets and assets does the VWAP/VOL Extension work best on?
The VWAP/VOL Extension performs optimally on markets with consistent, high-volume participation since the system relies on institutional volume analysis for bias detection. Futures markets provide the most reliable performance due to their centralized volume data and continuous institutional participation.
Recommended Futures Markets:
- ES (S&P 500 E-mini) - Over 2 million contracts daily volume, excellent liquidity depth
- NQ (NASDAQ-100 E-mini) - Around 600,000 contracts daily, strong tech sector representation
- YM (Dow Jones E-mini) - Consistent institutional flow and volume patterns
- RTY (Russell 2000 E-mini) - Small-cap exposure with reliable volume data
- GC (Gold Futures) - High volume commodity with institutional participation
- CL (Crude Oil Futures) - Energy sector representation with strong volume consistency
Why Futures Markets Excel:
- Futures markets provide centralized volume reporting, ensuring the extension's volume classification system receives accurate institutional participation data. The standardized contract specifications and continuous trading hours create consistent volume patterns that the extension's algorithms can analyze effectively.
Acceptable Timeframes and Portfolio Integration:
- Any timeframe that can be evaluated within Quantify Trading Model's backtesting engine is acceptable for live trading implementation.
The extension is specifically designed to integrate with Quantify's portfolio management system, allowing multiple strategies across different timeframes and assets to operate simultaneously while maintaining consistent bias identification methodology across the entire automated trading portfolio.
Legal Disclaimers and Risk Acknowledgments
Trading Risk Disclosure
The VWAP/VOL Extension is provided for informational, educational, and systematic bias detection purposes only and should not be construed as financial, investment, or trading advice. The extension provides volume-weighted institutional analysis but does not guarantee profitable outcomes, accurate bias predictions, or positive investment returns.
Trading systems utilizing bias detection algorithms carry substantial risks including but not limited to total capital loss, incorrect bias identification, market regime changes, and adverse conditions that may invalidate volume-based analysis. The extension's performance depends on accurate volume data, TradingView infrastructure stability, and proper integration with Quantify Trading Model, any of which may experience data errors, technical failures, or service interruptions that could affect bias detection accuracy.
System Dependency Acknowledgment
The extension requires continuous operation of multiple interconnected systems: TradingView charts and real-time data feeds, accurate volume reporting from exchanges, Quantify Trading Model integration, and stable platform connectivity. Any interruption or malfunction in these systems may result in incorrect bias signals, missed transitions, or unexpected analytical behavior.
Users acknowledge that neither Fractalyst nor the creator has control over third-party data providers, exchange volume reporting accuracy, or TradingView platform stability, and cannot guarantee data accuracy, service availability, or analytical performance. Market microstructure changes, volume reporting delays, exchange outages, and technical factors may significantly affect bias detection accuracy compared to theoretical or backtested performance.
Intellectual Property Protection
The VWAP/VOL Extension, including all proprietary algorithms, volume classification methodologies, three-state bias detection systems, and integration protocols, constitutes the exclusive intellectual property of Fractalyst. Unauthorized reproduction, reverse engineering, modification, or commercial exploitation of these proprietary technologies is strictly prohibited and may result in legal action.
Liability Limitation
By utilizing this extension, users acknowledge and agree that they assume full responsibility and liability for all trading decisions, financial outcomes, and potential losses resulting from reliance on the extension's bias detection signals. Fractalyst shall not be liable for any unfavorable outcomes, financial losses, missed opportunities, or damages resulting from the development, use, malfunction, or performance of this extension.
Past performance of bias detection accuracy, volume classification effectiveness, or integration with Quantify Trading Model does not guarantee future results. Trading outcomes depend on numerous factors including market regime changes, volume pattern evolution, institutional behavior shifts, and proper system configuration, all of which are beyond the control of Fractalyst.
User Responsibility Statement
Users are solely responsible for understanding the risks associated with algorithmic bias detection, properly configuring system parameters, maintaining appropriate risk management protocols, and regularly monitoring extension performance. Users should thoroughly validate the extension's bias signals through comprehensive backtesting before live implementation and should never base trading decisions solely on automated bias detection.
This extension is designed to provide systematic institutional flow analysis but does not replace the need for proper market understanding, risk management discipline, and comprehensive trading methodology. Users should maintain active oversight of bias detection accuracy and be prepared to implement manual overrides when market conditions invalidate volume-based analysis assumptions.
Terms of Service Acceptance
Continued use of the VWAP/VOL Extension constitutes acceptance of these terms, acknowledgment of associated risks, and agreement to respect all intellectual property protections. Users assume full responsibility for compliance with applicable laws and regulations governing automated trading system usage in their jurisdiction.

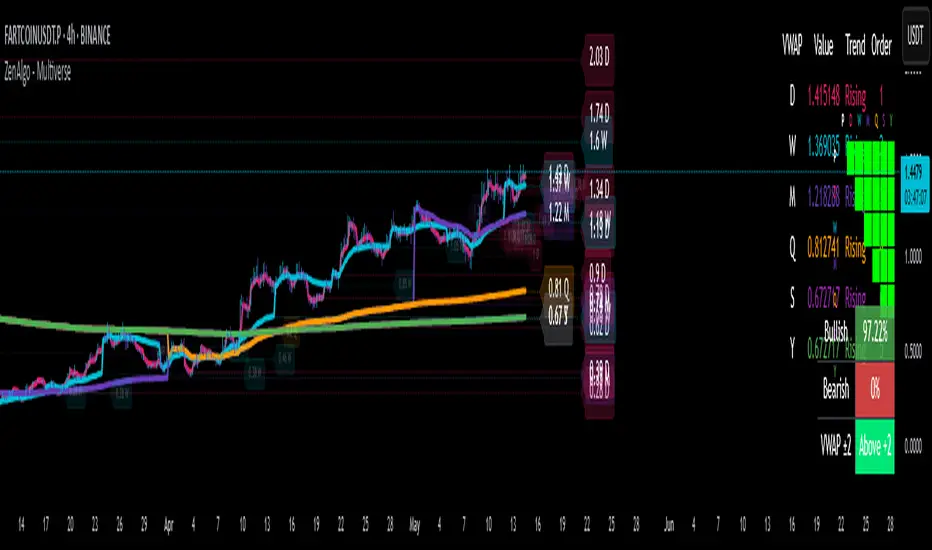
ZenAlgo - MultiverseThe ZenAlgo – Multiverse indicator provides a multi-timeframe view of Volume-Weighted Average Price (VWAP) levels and their dynamic interaction with price across seven defined timeframes: Daily, Weekly, Monthly, Quarterly, Semi-Annual, and Yearly. The indicator is intended to help traders contextualize price within time-based value areas and examine how price interacts with statistically relevant bands derived from those VWAPs.
VWAP Calculation and Period Structure
At the core, this script computes VWAP levels anchored to six distinct timeframes using volume data and a configurable source (default is HLC3). Each VWAP resets at the start of its corresponding period (e.g., Daily VWAP resets at the beginning of a new day) using timeframe.change() as a detection mechanism. This allows each VWAP level to reflect a clean aggregation of price and volume over its specified period.
VWAP levels are only computed if volume data is present and cumulative volume increases, ensuring logical consistency. If volume is missing or inconsistent, the script terminates execution with an error to prevent invalid outputs.
Band Calculation
Each VWAP is accompanied by one or two optional bands on both sides, calculated using percentage-based offset. Daily VWAP is configurable per user preference to use either standard deviation or a percentage-based offset. These bands provide a dynamic value area that expands or contracts with volatility or proportional price distance, respectively.
The bands help classify price as:
Inside the main band (e.g., between ±1 band): near average value
Inside extended band (e.g., ±2 bands): stretched but not extreme
Beyond extended band: potentially overheated or oversold conditions
This layering creates a multi-zoned map of value perception across timeframes.
Labeling and Historical Tracking
As each new VWAP is computed, it is stored in a bounded array alongside metadata such as label position, line objects, test count, and test state (whether price has interacted with it). Each level is drawn as a dotted horizontal line and labeled with its value and corresponding period (e.g., "D", "W", "M").
Price interaction with a VWAP level (i.e., candle high/low crossing the line) changes the styling of the label and line, marking it as "tested." A cap on how many tested levels are retained (default 10) avoids excessive clutter and resource usage.
These persistent horizontal levels give the trader a visual reference of where value was defined in previous periods and how price has respected or ignored those levels over time.
Summary Tables and Grid
Two visual table overlays are provided:
1. VWAP Summary Table , this table shows:
VWAP values per timeframe
Trend interpretation (rising, falling, stable) relative to price
Ranked order of VWAP values (from highest to lowest)
The order is recalculated each bar to reflect the vertical positioning of each VWAP on the price chart.
2. VWAP Relationship Grid
A grid matrix compares each VWAP and current price against all others. Each cell reflects whether a given source is above, below, or within a tolerance threshold relative to another. Colors (green, red, gray) visually encode the result, with the diagonal marked in black and unused cells disabled.
This matrix helps identify alignment or dissonance among timeframes, allowing users to detect whether shorter-term value is leading or lagging longer-term value.
Price Band Classification
For the Daily VWAP specifically, the script includes an extra classification system. It assigns the current price to a zone (e.g., "At VWAP", "Bear Band", "Above Bull Band 2") based on where the price lies in relation to the VWAP bands. This classification is also used for dynamic coloring and added to the daily label.
Display Controls
The script offers fine-grained controls:
Toggle visibility of each VWAP and band group independently
Adjust the offset of labels from the current bar
Customize band multipliers and color transparency
Limit the number of historical VWAP labels plotted
Position both the summary and grid tables flexibly on screen
These options allow traders to declutter their charts and focus on the most relevant context for their strategy.
How to Interpret and Use
This indicator provides a structured view of market value perception across various timeframes. For example:
When price converges with multiple VWAPs, it may suggest consensus on value.
When price moves away from all VWAPs, it may indicate trending or stretched conditions.
Crosses and retests of VWAPs (especially higher-timeframe ones) can act as areas of interest.
The band-based classification helps identify transitional zones and whether price is situated in an area where value is being accepted or rejected.
The summary tables offer a high-level dashboard of price positioning and value structure, which can assist with top-down analysis, filtering setups, or contextual decision-making.
Added Value Compared to Free Alternatives
Most free VWAP scripts:
Cover only a single timeframe (often daily or session-based)
Lack historical level tracking with tested/retested visualization
Do not support grid-level relationships or multi-timeframe band analysis
Offer limited configuration over how bands are calculated or displayed
This script consolidates multiple value areas in one consistent framework and goes further by tracking historical relevance, providing interaction logs, and organizing data into actionable overlays.
For traders seeking comprehensive value context across intraday and swing horizons, this tool offers persistent and structured data views that are otherwise unavailable through individual, isolated VWAP tools.
Limitations and Disclaimers
The indicator depends on volume data. On instruments with unreliable or synthetic volume (e.g., certain spot forex or CFDs), results may not be meaningful.
Band-based interpretation should not be used as a signal mechanism on its own.
On low timeframes, longer-period VWAPs may appear flat or visually compressed.
As with any analytical tool, interpretation requires trader discretion and should be combined with broader context.
Multi VWAPsMulti VWAPs Inspired by Biran Shannon and his book:
"MAXIMUM TRADING GAINS WITH ANCHORED VWAP . The Perfect Combination of Price, Time & Volume."
(ISBN 9798986868004)
A comprehensive VWAP (Volume Weighted Average Price) indicator that combines multiple timeframes and sessions in one view. Perfect for day trading and swing trading across different markets.
Features:
• Multiple VWAP Timeframes:
- Daily VWAP
- Weekly VWAP
- Monthly VWAP
- Quarterly VWAP
- Yearly VWAP
• Session-specific VWAPs:
- London Session (3:00 AM - 11:30 AM NY time)
- New York Session (9:30 AM - 4:00 PM NY time)
• Additional Indicators:
- Midnight Price Line (Previous day's closing price)
- 5-Day Moving Average
- 50-Day Moving Average
• Customization Options:
- Toggle individual VWAPs and indicators
- Customize colors for each component
- Adjustable label positioning
- MA smoothing settings
- Option to show/hide previous day's midnight price
• Smart Features:
- Auto-adjusting calculations based on timeframe
- Clear session boundaries
- Optimized for all chart timeframes
- Clean label system
Perfect for:
• Day traders tracking multiple timeframe momentum
• Swing traders using longer-term VWAPs
• Session traders focusing on London/NY hours
• Multi-timeframe analysis
• Price action trading with VWAP support/resistance
This indicator combines essential trading tools in one clean interface, helping you make informed decisions without cluttering your chart.
Long-Term VWAP Mean Reversion SDCACore Idea:
This indicator is designed to support Strategic Dollar Cost Averaging (SDCA) for Bitcoin using a cumulative VWAP-based mean reversion model. It helps long-term investors identify high-conviction buy zones and overbought conditions using statistical deviation from the cumulative VWAP. This indicator evaluates how much price is stretched from the true market average price, weighted by cumulative volume over time.
Core Concepts and Formulas:
Cumulative VWAP (Volume Weighted Average Price):
VWAP cumulative = ∑(Price×Volume) / ∑Volume
A long-term anchor that reflects the average dollar cost of all market participants across all candles. This version does not reset daily, unlike intraday VWAP.
VWAP Deviation % :
Deviation% = Price - VWAP cumulative / VWAP cumulative x 100
Shows how far current price has diverged from the long-term fair value.
Z-Score of VWAP Deviation:
Z= (Price−VWAP)−μ / σ (lookback period: default 200)
SDCA Multiplier Mapping:
*Keep in mind in my Z-Score system, -2 represents the overbought level (white horizontal line) and +2 represents oversold (cyan horizontal line) conditions. So the scores on the Y axis and Z-score in the table are reversed.
| Z-Score Range | SDCA Multiplier |
---------------------------------------------
| ≤ -2 | 0.25×
| -1 to +1 | 1.0×
| > +2 | 2.0×
The pink line plots this multiplier. It’s meant to control buy weight at each time step.
How to Use This for SDCA:
-Buy normally when the multiplier is 1.0× (Z-score between -1 and +1)
-Accelerate buying when Z-score is deeply negative (price far below VWAP)
-Slow or pause buying when Z-score is high (price far above VWAP)
-Use the stats panel to track current Z-score, VWAP level, deviation %, and multiplier
-Watch the red/blue backgrounds as visual confirmation of oversold/overbought zones
Inputs:
Z-Score Lookback Length:
Default: 200 but can be adjusted.
Visuals:
Z-Score Line (cyan): shows current standardized deviation from VWAP
Multiplier Line (bright pink): your SDCA intensity signal
Background Zones: cyan = oversold, white = overbought
Horizontal Lines: +2 and -2 standard deviation thresholds
Stats Panel (bottom right): live values for Z-score, multiplier, price, VWAP, and the deviation formula
Suited For:
-Long-term Bitcoin investors
-SDCA Systems
-Mean reversion systems
-Macro-level buy/sell planning

Easy MA SignalsEasy MA Signals
Overview
Easy MA Signals is a versatile Pine Script indicator designed to help traders visualize moving average (MA) trends, generate buy/sell signals based on crossovers or custom price levels, and enhance chart analysis with volume-based candlestick coloring. Built with flexibility in mind, it supports multiple MA types, crossover options, and customizable signal appearances, making it suitable for traders of all levels. Whether you're a day trader, swing trader, or long-term investor, this indicator provides actionable insights while keeping your charts clean and intuitive.
Configure the Settings
The indicator is divided into three input groups for ease of use:
General Settings:
Candlestick Color Scheme: Choose from 10 volume-based color schemes (e.g., Sapphire Pulse, Emerald Spark) to highlight high/low volume candles. Select “None” for TradingView’s default colors.
Moving Average Length: Set the MA period (default: 20). Adjust for faster (lower values) or slower (higher values) signals.
Moving Average Type: Choose between SMA, EMA, or WMA (default: EMA).
Show Buy/Sell Signals: Enable/disable signal plotting (default: enabled).
Moving Average Crossover: Select a crossover type (e.g., MA vs VWAP, MA vs SMA50) for signals or “None” to disable.
Volume Influence: Adjust how volume impacts candlestick colors (default: 1.2). Higher values make thresholds stricter.
Signal Appearance Settings:
Buy/Sell Signal Shape: Choose shapes like triangles, arrows, or labels for signals.
Buy/Sell Signal Position: Place signals above or below bars.
Buy/Sell Signal Color: Customize colors for better visibility (default: green for buy, red for sell).
Custom Price Alerts:
Custom Buy/Sell Alert Price: Set specific price levels for alerts (default: 0, disabled). Enter a non-zero value to enable.
Set Up Alerts
To receive notifications (e.g., sound, popup, email) when signals or custom price levels are hit:
Click the Alert button (alarm clock icon) in TradingView.
Select Easy MA Signals as the condition and choose one of the four alert types:
MA Crossover Buy Alert: Triggers on MA crossover buy signals.
MA Crossover Sell Alert: Triggers on MA crossover sell signals.
Custom Buy Alert: Triggers when price crosses above the custom buy price.
Custom Sell Alert: Triggers when price crosses below the custom sell price.
Enable Play Sound and select a sound (e.g., “Bell”).
Set the frequency (e.g., Once Per Bar Close for confirmed signals) and create the alert.
Analyze the Chart
Moving Average Line: Displays the selected MA with color changes (green for bullish, red for bearish, gray for neutral) based on price position relative to the MA.
Buy/Sell Signals: Appear as shapes or labels when crossovers or custom price levels are hit.
Candlestick Colors: If a color scheme is selected, candles change color based on volume strength (high, low, or neutral), aiding in trend confirmation.
Why Use Easy MA Signals?
Easy MA Signals is designed to simplify technical analysis while offering advanced customization. It’s ideal for traders who want:
A clear visualization of MA trends and crossovers.
Flexible signal generation based on MA crossovers or custom price levels.
Volume-enhanced candlestick coloring to identify market strength.
Easy-to-use settings with tooltips for beginners and pros alike.
This script is particularly valuable because it combines multiple features into one indicator, reducing chart clutter and providing actionable insights without overwhelming the user.
Benefits of Easy MA Signals
Highly Customizable: Supports SMA, EMA, and WMA with adjustable lengths.
Offers multiple crossover options (VWAP, SMA10, SMA20, etc.) for tailored strategies.
Custom price alerts allow precise targeting of key levels.
Volume-Based Candlestick Coloring: 10 unique color schemes highlight volume strength, helping traders confirm trends.
Adjustable volume influence ensures adaptability to different markets.
Flexible Signal Visualization: Choose from various signal shapes (triangles, arrows, labels) and positions (above/below bars).
Customizable colors improve visibility on any chart background.
Alert Integration: Built-in alert conditions for crossovers and custom prices support sound, email, and app notifications.
Easy setup for real-time trading decisions.
User-Friendly Design: Organized input groups with clear tooltips make configuration intuitive.
Suitable for beginners and advanced traders alike.
Example Use Cases
Swing Trading with MA Crossovers:
Scenario: A trader wants to trade Bitcoin (BTC/USD) on a 4-hour chart using an EMA crossover strategy.
Setup:
Set Moving Average Type to EMA, Length to 20.
Set Moving Average Crossover to “MA vs SMA50”.
Enable Show Buy/Sell Signals and choose “arrowup” for buy, “arrowdown” for sell.
Select “Emerald Spark” for candlestick colors to highlight volume surges.
Usage: Buy when the EMA20 crosses above the SMA50 (green arrow appears) and volume is high (dark green candles). Sell when the EMA20 crosses below the SMA50 (red arrow). Set alerts for real-time notifications.
Scalping with Custom Price Alerts:
Scenario: A day trader monitors Tesla (TSLA) on a 5-minute chart and wants alerts at specific support/resistance levels.
Setup:
Set Custom Buy Alert Price to 150.00 (support) and Custom Sell Alert Price to 160.00 (resistance).
Use “labelup” for buy signals and “labeldown” for sell signals.
Keep Moving Average Crossover as “None” to focus on price alerts.
Usage: Receive a sound alert and label when TSLA crosses 150.00 (buy) or 160.00 (sell). Use volume-colored candles to confirm momentum before entering trades.
When NOT to Use Easy MA Signals
High-Frequency Trading: Reason: The indicator relies on moving averages and volume, which may lag in ultra-fast markets (e.g., sub-second trades). High-frequency traders may need specialized tools with real-time tick data.
Alternative: Use order book or market depth indicators for faster execution.
Low-Volatility or Sideways Markets:
Reason: MA crossovers and custom price alerts can generate false signals in choppy, range-bound markets, leading to whipsaws.
Alternative: Use oscillators like RSI or Bollinger Bands to trade within ranges.
This indicator is tailored more towards less experienced traders. And as always, paper trade until you are comfortable with how this works if you're unfamiliar with trading! We hope you enjoy this and have great success. Thanks for your interested in Easy MA Signals!

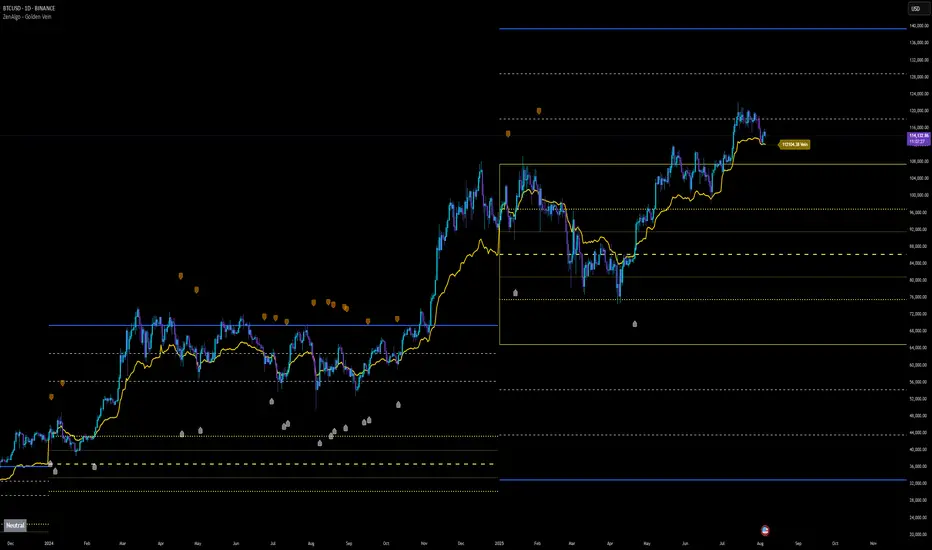
ZenAlgo - Golden VeinOverview and Motivation
This indicator combines multiple volume-weighted average price (VWAP) calculations from different timeframes and then merges them into a single composite line called “the Vein”. It begins by pulling a user-defined source (for instance, a typical price) and then anchors a VWAP on daily, weekly, monthly, quarterly, semiannual, and yearly intervals. By viewing all these timeframes together, the script captures multi-period trends in a way that stands apart from simpler, single-timeframe VWAP indicators. This comprehensive perspective is designed to offer practical benefits to those who monitor both short- and long-term VWAP behavior within a single tool.
Because it tracks many timeframes simultaneously, it can highlight instances when short-term and long-term VWAPs converge or diverge. Traders who need multi-timeframe validation may find this approach particularly helpful. Other free indicators typically restrict themselves to one or two timeframes, so the built-in multi-timeframe data in this script can save effort for those who rely heavily on VWAP analysis.
Core Inputs and Offsets
At the start, the script takes a single price input (e.g., the average of high, low, and close) and uses it to compute multiple VWAP lines. Users can also choose a distance factor (based on an ATR calculation) to control how far labels are placed from any crossover events. This distance sets how clearly the chart will display labels without overcrowding.
Beyond giving a cleaner visual, having a user-defined distance for labels means the script can adapt to any ticker’s volatility. If one trades assets with large intraday swings, the script leaves enough space for labels to remain readable. This flexibility is something that simpler free VWAP scripts might lack.
Multi-Timeframe VWAP Computations
The script calculates distinct VWAP lines: Daily, Weekly, Monthly, Quarterly (3-Month), Semiannual (6-Month), and Yearly (12-Month). Each line resets whenever it detects a new period has started, ensuring that each timeframe’s VWAP properly anchors to its own session window. This allows the indicator to track how the market perceives fair value (through VWAP) on multiple horizons, all at once.
Simultaneously checking these various intervals can offer added clarity to traders who want to compare immediate market conditions (e.g., daily) to broader contexts (e.g., quarterly or yearly). Tools that only show one or two timeframes may miss the nuances that arise when, say, daily VWAP aligns with monthly VWAP at a turning point.
Crossover Detection and Labeling
Whenever two different VWAP lines intersect, the script generates an internal crossover signal. It then draws small labels (e.g., D↑W or M↓Q) to highlight that a lower timeframe VWAP has moved above or below a higher timeframe VWAP. These labels use color-coding and an ATR-based offset to remain visible.
An additional subtle feature is how daily VWAP crossovers can optionally be displayed only on a specific weekday and hour. That allows users who only want to track daily crossovers under certain conditions (for example, a fixed point in the weekly cycle) to filter out other signals. This adaptability can be worth paying for if one needs advanced filtering—an area where simpler free VWAP cross indicators typically do not offer such granular control.
The “Golden VWAP” (Composite Calculation)
All six VWAP lines (daily, weekly, monthly, quarterly, semiannual, yearly) feed into a central average called “the Vein”. The script takes the midpoint of these six values on each bar, effectively combining short-, medium-, and long-term VWAP data into one. This composite serves as a reference line for overall market direction.
A volatility band (either a standard-deviation-based range or a user-defined percentage) wraps around this composite. The script thereby creates an upper and a lower boundary around the Golden VWAP, called “Resistance” and “Support.” Traders may interpret price moves beyond these levels as higher-probability expansions or contractions, but there is no guarantee of outcome. In choppier markets, breakouts above or below these bands might not lead to follow-through, so interpretation should always be combined with other evidence.
Simplified Market State Logic
By checking how price and the Golden VWAP behave from one bar to the next, the script tags the market state with labels like Bullish, Bearish, Super Bullish, or Super Bearish. These classifications hinge on whether the Golden VWAP is rising or falling, and whether price has crossed above or below the composite band. An optional table in the lower-left corner of the chart displays this label.
While such classification is convenient for scanning changing conditions quickly, it should be interpreted with caution. If the market is sideways or if volume patterns are erratic, the script can produce signals that do not align with real momentum. Treat these states as indications of potential bias rather than automatic buy or sell triggers.
Added Value
By gathering VWAP lines across multiple timeframes, generating alerts on all possible combinations of crossovers, and overlaying a composite VWAP with adjustable volatility bands, this script goes beyond typical single-timeframe VWAP indicators. It aims to let users track short-term shifts (e.g., daily crossing weekly) in the context of longer-term trends (e.g., yearly). This granularity and automation can reduce the need for multiple charts or manual recalculations of different VWAP windows.
Why It Can Be Worth Paying For
The capability to simultaneously anchor VWAP to multiple timeframes, detect crossovers, filter out daily signals by weekday/hour, and visualize a composite “Vein” with adjustable ranges represents a comprehensive feature set that free scripts often do not bundle together. For those who rely on multi-timeframe VWAP analysis, the time saved and clarity gained may justify a paid solution.
Interpreting Values
Crossover labels: Identify points where one timeframe’s VWAP moves above or below another. The direction (up or down) suggests potential momentum shifts.
Golden VWAP line: Treat it as the average “fair value” across all anchored periods. Large price moves above or below this line’s surrounding band might signal increased directional conviction—or false breakouts if volume is deceptive.
Market states: Use the Bullish/Super Bullish/Bearish/Super Bearish labels to gauge how price interacts with the composite’s slope and band.
How to Use It Best
Combine these signals with other risk-management methods.
Monitor multiple crossovers in tandem: for example, daily crossing weekly plus monthly crossing quarterly may offer stronger confluence.
Use the optional daily-label toggle to stay focused on selected higher-confidence signals if you find too many crossovers distracting.
Remember that every alert or label should be evaluated in broader market context and your own trading strategy.
Potential Shortcomings
As with any technical study, VWAP lines and crossovers are not foolproof predictors. The script can be less reliable in low-volume or fast-moving conditions. Large price shocks can cause abrupt changes that do not fit the typical patterns this indicator looks for.
In short, this script’s distinct advantage is showing multiple anchored VWAPs and a composite perspective in one place, offering fine control of alerts and appearance settings. Those who benefit most are chartists who want deeper VWAP insights across various timescales without juggling multiple separate indicators. However, like any technical tool, it should be understood as an aid rather than a guarantee of outcomes.
VWAP Separation Oscillator V5 (No Arrows)Okay, here is a draft description you can adapt for your TradingView publication. It starts from the basics and explains the concepts behind the indicator and how to interpret its visual elements.
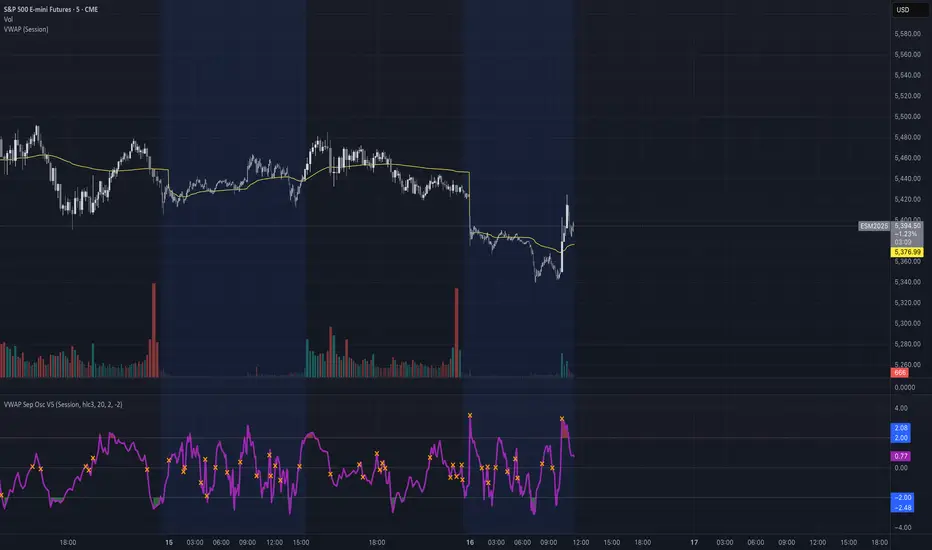
VWAP Separation Oscillator
Summary
This indicator provides a normalized view of how far the current price has deviated from its Volume-Weighted Average Price (VWAP), helping traders identify potentially overbought or oversold conditions relative to recent VWAP dynamics. It calculates the price separation from VWAP and expresses it in terms of standard deviations (a Z-score), making it easier to gauge the statistical significance of the deviation.
Core Concepts Explained
What is VWAP?
VWAP stands for Volume-Weighted Average Price. It's a trading benchmark calculated by taking the total dollar value traded for every transaction (price multiplied by volume) and dividing it by the total shares traded for the day (or other chosen period).
Unlike a simple moving average, VWAP gives more weight to price levels where more volume occurred. Many institutional traders use it as a reference point for execution quality.
This indicator allows you to choose the "Anchor Period" (Session, Week, Month, etc.) which determines when the VWAP calculation resets.
What is VWAP Separation?
P
rice doesn't always stay at the VWAP; it naturally fluctuates above and below it.
"VWAP Separation" is simply the difference between the current price (Source) and the calculated VWAP value (Separation = Price - VWAP). A positive separation means the price is above VWAP; negative means below.
How Standard Deviation is Used:
While knowing the separation is useful, its significance can vary wildly between different stocks or market conditions. A $1 separation might be huge for one stock but tiny for another.
Standard Deviation is a statistical measure of how spread out data points are from their average. In this indicator, we calculate the standard deviation of the VWAP Separation over a specified Lookback Length. This tells us how volatile or dispersed the separation has been recently.
The Oscillator Line (Z-Score):
The main purple (or Green/Red) line plotted by this indicator is the Z-score of the VWAP Separation.
Formula conceptually: Oscillator Value = (Current Separation - Average Separation) / Standard Deviation of Separation
Interpretation: It tells you how many standard deviations the current separation is away from the average separation over the lookback period.
A value of +2.0 means the current separation is 2 standard deviations higher (more extended to the upside) than the average separation.
A value of -1.5 means the current separation is 1.5 standard deviations lower (more extended to the downside) than the average separation.
This normalization makes it easier to compare readings across different assets or timeframes and to define consistent thresholds for "extreme" deviations.
Visual Elements Explained
Oscillator Line: The primary line showing the Z-score value (explained above). Can optionally be colored Green/Red based on its slope (rising/falling).
Overbought Line (Solid Red): A user-defined level (default: 2.0). When the oscillator moves above this line, it suggests the price deviation above VWAP is statistically significant compared to recent history.
Oversold Line (Solid Green): A user-defined level (default: -2.0). When the oscillator moves below this line, it suggests the price deviation below VWAP is statistically significant compared to recent history.
Overbought/Oversold Zone Fills (Transparent Red/Green): These shaded areas appear only when the oscillator line enters the respective Overbought or Oversold territory (defined by the OB/OS Lines), visually highlighting these periods.
Zero Line (Dotted Gray): Represents the point where the current VWAP separation is exactly equal to the average VWAP separation over the lookback period. Crossings indicate shifts relative to this mean.
Zero Cross Markers (Orange 'X'): Small 'x' marks plotted directly on the oscillator line whenever it crosses the Zero Line, pinpointing these moments.
Potential Usage / Interpretation
Identifying Extremes: High positive values (above OB Level) or low negative values (below OS Level) can suggest the price move relative to VWAP might be over-extended and potentially due for a pause or pullback. Look for the oscillator turning back from these extremes.
Spotting Divergences: Look for discrepancies between price action and the oscillator.
Bearish Divergence: Price makes a new high, but the oscillator makes a lower high (often in the OB zone). Suggests weakening upside momentum relative to VWAP dynamics.
Bullish Divergence: Price makes a new low, but the oscillator makes a higher low (often in the OS zone). Suggests weakening downside momentum relative to VWAP dynamics.
Context is Key: This oscillator measures deviation from a specific benchmark (VWAP). Its interpretation should always be done within the context of the overall market trend, price structure (support/resistance), volume analysis, and potentially other confirming indicators.
Disclaimer: This indicator is a tool for analysis, not a standalone trading system. It does not provide financial advice. Always use risk management.
Settings Overview
Anchor Period: Determines how often the VWAP calculation resets (Session, Week, Month, etc.).
Source: The price data used for the separation calculation (default: hlc3).
Lookback Length: The number of bars used to calculate the average and standard deviation of the separation, influencing the oscillator's responsiveness.
Overbought/Oversold Levels: User-defined thresholds for identifying extreme Z-score values.
Color Oscillator Line: Option to color the oscillator line based on whether it's rising or falling.
Multi-Timeframe Anchored VWAP Valuation# Multi-Timeframe Anchored VWAP Valuation
## Overview
This indicator provides a unique perspective on potential price valuation by comparing the current price to the Volume Weighted Average Price (VWAP) anchored to the start of multiple timeframes: Weekly, Monthly, Quarterly, and Yearly. It synthesizes these comparisons into a single oscillator value, helping traders gauge if the current price is potentially extended relative to significant volume-weighted levels.
## Core Concept & Calculation
1. **Anchored VWAP:** The script calculates the VWAP separately for the current Week, Month, Quarter (3 Months), and Year (12 Months), starting the calculation from the first bar of each period.
2. **Price Deviation:** It measures how far the current `close` price is from each of these anchored VWAPs. This distance is measured in terms of standard deviations calculated *within* that specific anchor period (e.g., how many weekly standard deviations the price is away from the weekly VWAP).
3. **Deviation Score (Multiplier):** Based on this standard deviation distance, a score is assigned. The further the price is from the VWAP (in terms of standard deviations), the higher the absolute score. The indicator uses linear interpolation to determine scores between the standard deviation levels (defaulted at 1, 2, and 3 standard deviations corresponding to scores of +/-2, +/-3, +/-4, with a score of 1 at the VWAP).
4. **Timeframe Weighting:** Longer timeframes are considered more significant. The deviation scores are multiplied by fixed scalars: Weekly (x1), Monthly (x2), Quarterly (x3), Yearly (x4).
5. **Final Valuation Metric:** The weighted scores from all four timeframes are summed up to produce the final oscillator value plotted in the indicator pane.
## How to Interpret and Use
* **Histogram (Indicator Pane):**
* The main output is the histogram representing the `Final Valuation Metric`.
* **Positive Values:** Suggest the price is generally trading above its volume-weighted averages across the timeframes, potentially indicating strength or relative "overvaluation."
* **Negative Values:** Suggest the price is generally trading below its volume-weighted averages, potentially indicating weakness or relative "undervaluation."
* **Values Near Zero:** Indicate the price is relatively close to its volume-weighted averages.
* **Histogram Color:**
* The color of the histogram bars provides context based on the metric's *own recent history*.
* **Green (Positive Color):** The metric is currently *above* its recent average plus a standard deviation band (dynamic upper threshold). This highlights potentially significant "overvalued" readings relative to its normal range.
* **Red (Negative Color):** The metric is currently *below* its recent average minus a standard deviation band (dynamic lower threshold). This highlights potentially significant "undervalued" readings relative to its normal range.
* **Gray (Neutral Color):** The metric is within its typical recent range (between the dynamic upper and lower thresholds).
* **Orange Line:** Plots the moving average of the `Final Valuation Metric` itself (based on the "Threshold Lookback Period"), serving as the centerline for the dynamic thresholds.
* **On-Chart Table:**
* Provides a detailed breakdown for transparency.
* Shows the calculated VWAP, the raw deviation multiplier score, and the final weighted (adjusted) metric for each individual timeframe (W, M, Q, Y).
* Displays the current price, the final combined metric value, and a textual interpretation ("Overvalued", "Undervalued", "Neutral") based on the dynamic thresholds.
## Potential Use Cases
* Identifying potential exhaustion points when the indicator reaches statistically high (green) or low (red) levels relative to its recent history.
* Assessing whether price trends are supported by underlying volume-weighted average prices across multiple timeframes.
* Can be used alongside other technical analysis tools for confirmation.
## Settings
* **Calculation Settings:**
* `STDEV Level 1`: Adjusts the 1st standard deviation level (default 1.0).
* `STDEV Level 2`: Adjusts the 2nd standard deviation level (default 2.0).
* `STDEV Level 3`: Adjusts the 3rd standard deviation level (default 3.0).
* **Interpretation Settings:**
* `Threshold Lookback Period`: Defines the number of bars used to calculate the average and standard deviation of the final metric for dynamic thresholds (default 200).
* `Threshold StDev Multiplier`: Controls how many standard deviations above/below the metric's average are used to set the "Overvalued"/"Undervalued" thresholds (default 1.0).
* **Table Settings:** Customize the position and colors of the data table displayed on the chart.
## Important Considerations
* This indicator measures price deviation relative to *anchored* VWAPs and its *own historical range*. It is not a standalone trading system.
* The interpretation of "Overvalued" and "Undervalued" is relative to the indicator's logic and calculations; it does not guarantee future price movement.
* Like all indicators, past performance is not indicative of future results. Use this tool as part of a comprehensive analysis and risk management strategy.
* The anchored VWAP and Standard Deviation values reset at the beginning of each respective period (Week, Month, Quarter, Year).

THMA VWAP Oscillator [by Oberlunar]The THMA VWAP Oscillator of Oberlunar is a trend-following and liquidity-sensitive indicator that blends the Triple Hull Moving Average (THMA) with Volume Weighted Average Price (VWAP) deviation bands to highlight high-probability trading setups. It helps traders differentiate between healthy momentum moves and market noise , making it an effective tool for spotting trend continuations, reversals, and mean reversion trades .
At its core, the THMA is an advanced moving average that smooths price action while minimizing lag. Unlike conventional moving averages that react slowly, the THMA dynamically adapts to market conditions by applying a weighted smoothing process. This allows it to react more efficiently to momentum shifts , making it ideal for trend-following and breakout strategies .
The VWAP acts as a volume-weighted price equilibrium, giving traders a framework for understanding institutional positioning. Since VWAP considers both price and volume , it helps determine whether the market is trading at a premium or a discount relative to where most of the volume has transacted. The inclusion of VWAP deviation bands , derived from standard deviations, enhances the ability to detect overbought and oversold conditions , ensuring that signals align with key liquidity levels.
The indicator generates buy and sell signals based on a structured methodology that incorporates trend direction, liquidity positioning, and momentum confirmation . A buy signal is triggered when the THMA on a higher timeframe is positioned below the THMA of the current timeframe, indicating that the broader trend is supportive of an upward move. Additionally, the THMA must be trading below the lower VWAP deviation band , suggesting that price is in a discounted liquidity zone, which is often an area where institutional buyers step in. To ensure that the signal is not just a random fluctuation, the THMA must also show positive slope , meaning it is actively rising, confirming that price is attempting to reverse or continue its upward move with strength.
A sell signal follows the same logic in reverse. The THMA on a higher timeframe must be above the THMA of the current timeframe, confirming alignment with a broader downtrend. The THMA must also be positioned above the upper VWAP deviation band , signaling that price is extended and potentially due for a reversal. To validate that the momentum is actually weakening, the THMA must be in a declining slope , ensuring that price is not simply pausing but actually entering a phase of downward acceleration.
One of the key nuances of the THMA VWAP Oscillator is how it visually represents momentum through the serpentine line , which dynamically shifts color as it develops. When the serpentine line maintains a consistent color—green in an uptrend or red in a downtrend—it signals strong trend conviction . However, when the color fluctuates rapidly between green and red, it indicates a weakening signal , suggesting that price action is becoming choppy and trend strength is deteriorating. This alternation in color serves as an early warning of potential reversals, false breakouts, or trend exhaustion. Traders should be cautious when signals appear in conjunction with an unstable serpentine, as they are less likely to be reliable in such conditions.
To further enhance signal quality, the indicator incorporates a signal alternation mechanism , ensuring that consecutive buy or sell signals do not appear unless the previous trade setup has been invalidated. This helps prevent overtrading in consolidating markets and reduces the chances of chasing false breakouts. Additionally, the placement of buy and sell labels is optimized using ATR-based scaling , positioning them strategically above or below price action to maintain chart clarity without interfering with live price movements.
By integrating trend structure, liquidity positioning, and signal validation , the THMA VWAP Oscillator provides a structured approach to trade execution. It is particularly effective for traders looking to capture breakout moves, pullback entries, and mean reversion opportunities , as it ensures that entries are aligned with market momentum, institutional positioning, and price equilibrium dynamics . The ability to filter out weak signals while identifying strong momentum trends makes it an indispensable tool for trend-followers, breakout traders, and mean reversion specialists alike .
I am very pleased to share that I am publicly releasing one of my private indicators, which I usually provide exclusively to my community. This is a significant moment for me, as this tool has been carefully refined and tested to offer high-quality trading insights.
I also want to take this opportunity to thank my entire community for the incredible support I have received over the past few months. Your feedback, engagement, and enthusiasm continue to inspire me, and I truly appreciate being part of this journey with all of you.
Stay tuned for more updates, and as always, trade smart! 🚀
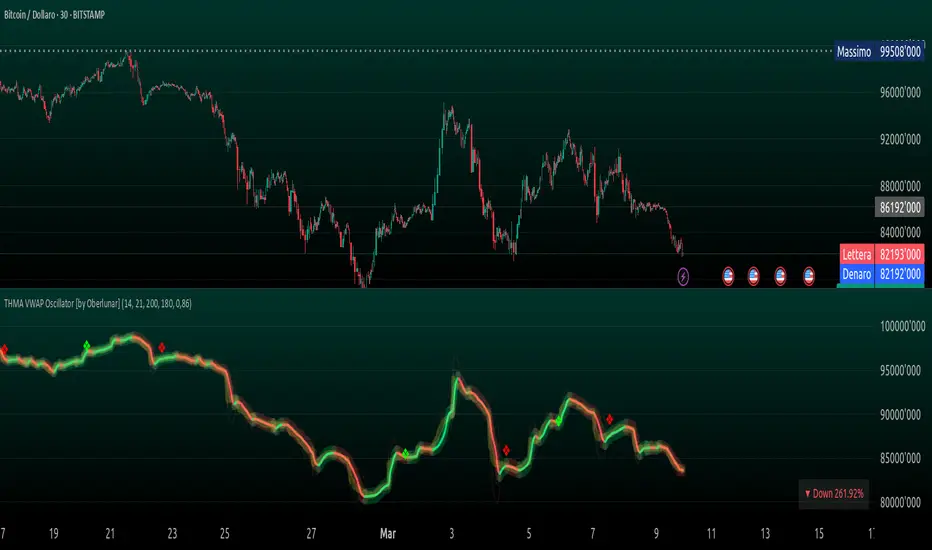
Multi-Timeframe VWAP Master ProThe Multi-Timeframe VWAP Suite is a comprehensive and highly customizable indicator designed for traders who rely on Volume-Weighted Average Price (VWAP) across multiple timeframes and periods. This tool provides a complete suite of VWAP calculations, including daily, weekly, monthly, quarterly, yearly, and custom VWAPs, allowing traders to analyze price action and volume trends with precision. Whether you're a day trader, swing trader, or long-term investor, this indicator offers unparalleled flexibility and depth for your trading strategy.
Multi-Timeframe VWAPs:
Daily, Weekly, Monthly, Quarterly, and Yearly VWAPs: Track VWAP across various timeframes to identify key support and resistance levels.
Customizable Timeframes: Use the SMA timeframe input to adjust the period for moving averages and other calculations.
Previous Period VWAPs:
Previous Daily, Weekly, Monthly, and Quarterly VWAPs: Analyze historical VWAP levels to understand past price behavior and identify potential reversal zones.
Previous Year Quarterly VWAPs: Compare current price action to VWAP levels from specific quarters of the previous year.
Custom VWAPs:
Custom Start Date and Timeframe: Define your own VWAP periods by specifying a start date and timeframe, allowing for tailored analysis.
Dynamic Custom VWAP Calculation: Automatically calculates VWAP based on your custom inputs, ensuring flexibility for unique trading strategies.
Seasonal and Yearly VWAPs:
April, July, and October VWAPs: Analyze seasonal trends by tracking VWAP levels for specific months.
Yearly VWAP: Get a broader perspective on long-term price trends with the yearly VWAP.
SMA Integration:
SMA Overlay: Combine VWAP analysis with a Simple Moving Average (SMA) for additional confirmation of trends and reversals.
Customizable SMA Length and Timeframe: Adjust the SMA settings to match your trading style and preferences.
User-Friendly Customization:
Toggle Visibility and Labels: Easily enable or disable the display of specific VWAPs and their labels to keep your chart clean and focused.
Color Customization: Each VWAP line and label is color-coded for easy identification and can be customized to suit your preferences.
Dynamic Labeling:
Automatic Labels: Labels are dynamically placed on the last bar, providing clear and concise information about each VWAP level.
Customizable Label Text: Labels include detailed information, such as the timeframe or custom period, for quick reference.
Flexible Timeframe Detection:
Automatic Timeframe Detection: The indicator automatically detects new days, weeks, months, and quarters, ensuring accurate VWAP calculations.
Support for Intraday and Higher Timeframes: Works seamlessly on all chart timeframes, from 1-minute to monthly charts.
Previous Year Quarterly VWAPs:
Q1, Q2, Q3, Q4 VWAPs: Compare current price action to VWAP levels from specific quarters of the previous year.
User-Selectable Year: Choose the year for which you want to calculate previous quarterly VWAPs.
Persistent Monthly VWAPs:
Option to Persist Monthly VWAPs Year-Round: Keep monthly VWAP levels visible even after the month ends for ongoing analysis.
Comprehensive Analysis: Combines multiple VWAP timeframes and periods into a single tool, eliminating the need for multiple indicators.
Customizable and Flexible: Tailor the indicator to your specific trading strategy with customizable timeframes, periods, and settings.
Enhanced Decision-Making: Gain deeper insights into price action and volume trends across different timeframes, helping you make more informed trading decisions.
Clean and Organized Charts: Toggle visibility and labels to keep your chart clutter-free while still accessing all the information you need.
Ideal For:
Day Traders: Use daily and intraday VWAPs to identify intraday support and resistance levels.
Swing Traders: Analyze weekly and monthly VWAPs to spot medium-term trends and reversals.
Long-Term Investors: Leverage quarterly and yearly VWAPs to understand long-term price behavior and key levels.
Seasonal Traders: Track April, July, and October VWAPs to capitalize on seasonal trends.
The Multi-Timeframe VWAP Suite is a powerful and versatile tool for traders of all styles and timeframes. With its comprehensive suite of VWAP calculations, customizable settings, and user-friendly design, it provides everything you need to analyze price action and volume trends with precision and confidence. Whether you're looking to fine-tune your intraday strategy or gain a broader perspective on long-term trends, this indicator has you covered.

VWAP [cryptalent]VWAP Indicator with Adjustable Source
Overview
This TradingView indicator calculates Daily, Weekly, and Monthly VWAP (Volume Weighted Average Price) with the flexibility to select different price sources (Open, High, Low, Close, HLC3, etc.). It also displays previous period VWAP levels, helping traders analyze past liquidity zones.
Key Features:
✅ Adjustable Source – Users can choose the price used for VWAP calculations (e.g., Close, High, Low, Open).
✅ Multi-Timeframe VWAP – Tracks Daily, Weekly, and Monthly VWAP to provide a broader market view.
✅ Historical VWAP Levels – Displays previous VWAP values for comparison and reference.
✅ Step Line Style – Ensures clear distinction between different periods and prevents overlapping.
✅ Visible in the Price Scale – The latest and historical VWAP values are displayed in the right-hand price scale for easy reference.
Customization:
You can easily modify the input settings to match your trading style.
Adjust the VWAP source price to test different perspectives (e.g., Open vs. High vs. Close).

ZenAlgo - Heavy DeltaThe ZenAlgo - Heavy Delta indicator is a comprehensive technical analysis tool designed for traders seeking a deeper understanding of market dynamics. It combines multiple advanced sub-indicators, including Order Blocks, Moving Averages, VWAP, and Delta Volume analysis, and more to provide actionable insights. This indicator is particularly useful for identifying potential trade entries and exits based on institutional order flow and price action patterns.
Features
Order Block Detection: Identifies bullish and bearish order blocks with detailed visualization and volume analysis.
VWAP (Volume Weighted Average Price): Tracks the average price of a security weighted by volume over various anchor periods.
Moving Averages (MA): Customizable MAs (13, 21, 50, 200 periods) to detect trends and momentum shifts.
Daily Open and Monday Range: Highlights key levels like daily open and intraday/multi-day high-low ranges for better price context.
Delta Volume Analysis: Measures the net difference between buying and selling volume for market sentiment insights.
Divergence Detection: Detects regular and hidden bullish/bearish divergences for trend reversal opportunities.
Visual Alerts: Displays intuitive symbols for potential buy/sell signals and key price levels.
Added Value: Why Is This Indicator Original/Why Shall You Pay for This Indicator?
The ZenAlgo - Heavy Delta indicator offers a distinct advantage by integrating multiple analysis techniques into one cohesive tool. While many individual indicators are freely available, this script goes beyond simple overlays to provide an advanced analytical framework. Here’s why it stands out:
1. Synergy of Indicators
Order Blocks: These are not static; the indicator dynamically calculates zones where institutional activity likely occurred, supported by volume-weighted metrics.
Delta Volume Analysis: Freely available delta volume tools typically show raw data, but this script filters noise, categorizes volume into meaningful up/down segments, and integrates it with other signals for context.
VWAP and Moving Averages: VWAP and customizable MAs are enhanced with divergence checks, color-coded trends, and market state classifications. This integration helps confirm trends and reversals with higher precision.
2. Volume-Based Insights
Traditional volume indicators often fail to show the "intent" behind price moves. This script combines delta volume and order block data to highlight areas of significant buying or selling pressure and their potential impacts on future price action.
3. Visual Simplicity with Advanced Logic
Unlike using several separate tools, which can clutter your chart, this indicator presents a streamlined interface. Every plotted element serves a clear purpose, minimizing distractions while maximizing actionable insights.
4. Customized for Active Traders
The indicator doesn’t just provide standard calculations. It includes proprietary adjustments like mitigation thresholds in order blocks, percentage-based signals for VWAP, and delta volume intensity levels that align better with active market conditions.
5. Why Pay for It?
Time and effort savings: Instead of setting up and calibrating multiple tools, this indicator combines them into a single efficient package.
Enhanced accuracy: Each sub-indicator validates the others, reducing false signals.
Unique features: For instance, the script automatically adjusts for multi-timeframe inconsistencies and uses gradient color fills to convey volume strength in order blocks—a feature absent in free indicators.
How It Works
The indicator combines individual sub-indicators into a logical framework where each part contributes to the overall analysis. Here’s how each feature operates:
1. Order Blocks
Identification: Uses specific price action patterns to locate zones of likely institutional interest (bullish or bearish blocks).
Dynamic Updates: The blocks adjust as new price data comes in, ensuring their relevance. Volume within these zones is weighted, helping assess their strength and potential price reactions.
Visual Enhancements: Blocks are color-coded and filled with gradients based on volume intensity, providing immediate visual cues about their importance.
2. VWAP (Volume Weighted Average Price)
Calculation: Anchored to user-selected periods (daily, weekly, etc.), VWAP is recalculated in real-time, showing the "fair" price based on traded volume.
Integration: Acts as a dynamic support/resistance line, particularly useful in intraday and swing trading. Labels provide percentage deviation for quick interpretation.
3. Moving Averages (MAs)
Customization: Supports various types (EMA, SMA, etc.) and lengths (13, 21, 50, 200). Traders can configure these to suit their strategies.
Market Status: By comparing the price to these MAs, the indicator classifies the market as Full Bull, Bullish, Neutral, Bearish, or Full Bear. This high-level summary helps traders quickly gauge market sentiment.
4. Delta Volume
Core Logic: Calculates the net difference between buying and selling pressure (volume) for each candle.
Visual Signals: Plots symbols when significant delta volume changes coincide with other indicator signals, like divergence or order block activity.
5. Daily Open and Monday Range
Purpose: Identifies key psychological levels like the daily open and the high/low range for the first trading day of the week.
Context: Highlights these levels with dynamic percentage changes, helping traders understand how price is behaving relative to them.
6. Divergence Detection
Logic: Tracks discrepancies between price movement and momentum (via Moving Averages, Delta Volume, and Order Blocks). These divergences often precede reversals.
Validation: Divergences are only flagged when other features, like delta volume shifts or order block interactions, confirm the setup.
By combining these tools in a meaningful way, ZenAlgo - Heavy Delta transforms raw data into actionable intelligence, giving traders a comprehensive view of market dynamics and a significant edge in decision-making.
Why Use Heikin Ashi for Heavy Delta?
The ZenAlgo - Heavy Delta indicator is optimized for Heikin Ashi (HA) candles, which smooth out market noise and make trends more visually apparent. Heikin Ashi works best for this strategy for several key reasons:
Why Heikin Ashi Works Best
Trend Clarity: Unlike traditional candlesticks, Heikin Ashi averages price data to create smoother transitions. This helps the indicator better identify sustained trends and reduces false signals caused by short-term price fluctuations.
Noise Reduction: HA candles filter out minor fluctuations and emphasize the overall market direction, making it easier to align the indicator’s signals (like Delta Volume and Order Blocks) with larger market movements.
Improved Visual Insights: Features like Order Blocks and Delta Volume align well with Heikin Ashi's smoothed representation, as it avoids the erratic movements that traditional candles sometimes display.
Better Support for Trend Strategies: Heikin Ashi candles naturally highlight key reversals and continuation patterns, which complement the analytical goals of this indicator.
Important Notes About Heikin Ashi:
Synthetic Nature of HA Candles: Heikin Ashi values are calculated differently than traditional candles. For example: a) The open is the average of the prior candle's open and close. b) The close is the average of the high, low, open, and close. This synthetic nature means that HA candles do not reflect actual market prices but rather smoothed averages, which can slightly lag real-time price movements.
Lagging Effect: Because HA candles use averaged data, they can lag behind actual price action. This is beneficial for identifying trends but less effective for precise entry/exit timing.
Inaccuracy in Low Volatility: In low-volume or low-volatility conditions, HA candles may distort actual price dynamics, leading to less reliable insights.
No Direct Alerts or Buy/Sell Signals : Issuing explicit buy or sell signals based on Heikin Ashi candles is not possible due to their averaged, synthetic nature. As such, the ZenAlgo - Heavy Delta indicator does not generate direct trading signals. Instead, the indicator is a decision-support tool that provides insights into trends, volume dynamics, and potential key levels, leaving trade execution to the trader's discretion.
Usage Examples
Trend Confirmation: Use the MA market status to identify if the market is in a Full Bull or Bear state.
Reversal Zones: Monitor order block zones for price rejection or absorption, signaling a potential reversal.
Breakout Trading: Trade breakouts when price surpasses VWAP or Monday Range highs/lows.
Delta Divergence: Look for positive/negative delta volume divergences during consolidations for breakout cues.
Mean Reversion: Use VWAP or MAs as dynamic support/resistance for mean reversion setups.
Intraday Scalping: Utilize daily open and intraday levels for short-term trades.
Swing Trading: Employ order blocks and multi-day ranges to frame swing trade setups.
Volume Climax: Identify volume spikes using Delta Volume to confirm trend continuation or reversal.
Momentum Trading: Combine divergence signals with Delta Volume for high-conviction entries.
Risk Management: Use defined order block boundaries to set stop losses and targets.
Settings
Order Blocks: Customize label visibility, label offsets, and block appearance.
VWAP: Adjust anchor period and toggle visibility.
Moving Averages: Configure length, type (EMA, SMA, etc.), and visibility of MAs (13, 21, 50, 200).
Delta Volume: Enable/disable delta symbols and labels, adjust sensitivity multipliers.
Daily Open/Monday Range: Toggle visibility and customize display preferences.
General Visuals: Adjust label offsets, color schemes, and transparency.
Important Notes
This indicator is a technical analysis tool and does not guarantee trading success.
Use it in conjunction with other indicators and fundamental analysis for a more comprehensive trading strategy.
Performance may vary in low-liquidity markets or during sudden news events.
Divergence signals might fail in strongly trending markets.
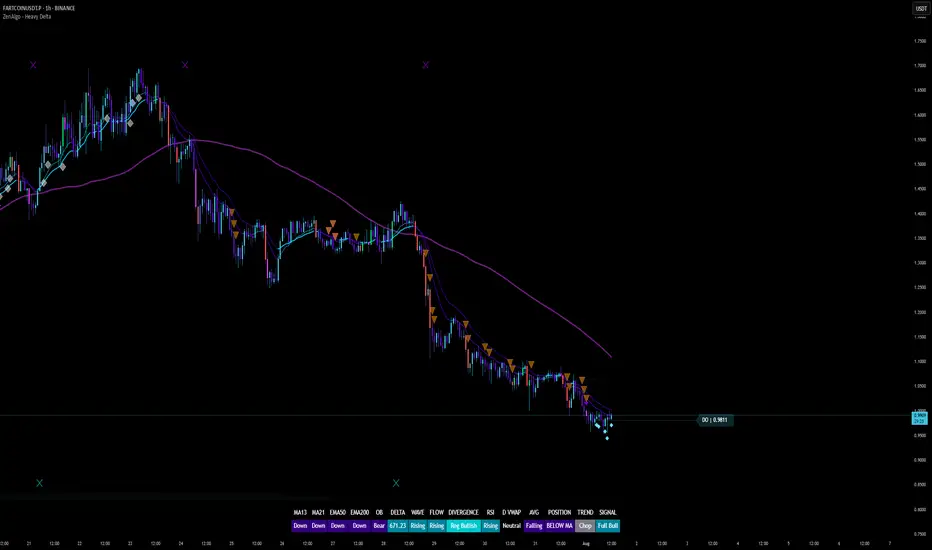
OHLC/4 Daily vs Quarterly CrossOHLC/4 Daily vs Quarterly Cross
The "OHLC/4 Daily vs Quarterly Cross" indicator is a powerful tool designed to provide traders with insights into trend alignment and potential market turning points. By calculating the average of the open, high, low, and close prices (OHLC/4), this script compares the daily average price action with the quarterly average to identify significant crossover events.
This indicator features two distinct lines: the Daily OHLC/4 and the Quarterly OHLC/4, each plotted in different colors for easy differentiation. A crossover occurs when the daily OHLC/4 moves above the quarterly average, potentially signaling bullish momentum or a shift in market direction. Conversely, a crossunder marks the daily OHLC/4 moving below the quarterly level, indicating potential bearish sentiment or a reversal.
With real-time plotting and built-in alert conditions, this script enables traders to stay ahead of critical market movements by setting automated notifications for crossover events. Whether you're seeking to confirm trends or identify new opportunities, the "OHLC/4 Daily vs Quarterly Cross" delivers clarity and actionable insights for more informed decision-making.
