Elliott Wave Noise FilterElliott Wave Noise Filter
Overview
The Elliott Wave Noise Filter is a specialized indicator for TradingView, designed to solve one of the biggest challenges in Elliott Wave analysis on lower timeframes: the identification of market noise. By combining multiple advanced filtering techniques, this indicator helps distinguish meaningful price action from random fluctuations.
The Problem
On lower timeframes—especially below 15 minutes—Elliott Wave analysis is significantly impacted by excessive market noise. This noise can lead to misinterpretation of wave structures, making it difficult to execute reliable trading decisions.
The Solution
The Elliott Wave Noise Filter utilizes four powerful methods to detect and filter noise:
ATR-Based Volatility Analysis: Identifies price movements too small to be structurally meaningful
Volume Confirmation: Filters out price moves that occur with insufficient volume
Trend Strength Measurement (ADX): Detects periods of weak trend activity, where noise tends to dominate
Fractal Pattern Recognition: Marks significant turning points that could be relevant for Elliott Wave analysis
Features
Visual Indicators
Background Coloring: Red indicates noise; green signifies a clear signal
Hull Moving Average: Smooths price action and highlights the prevailing trend
Fractal Markers: Triangles mark significant highs and lows
Status Panel: Displays current noise status and ADX value
Customization Options
ATR Period: Adjust the lookback period for ATR calculations
Noise Threshold: Defines the percentage of ATR below which a movement is considered noise
Volume Filter: Can be enabled or disabled
Volume Threshold: Sets the ratio to average volume for a move to be deemed significant
Hull MA Display and Length: Configure the moving average settings
ADX Parameters: Adjust trend strength sensitivity
Use Cases
For Elliott Wave Analysis
Eliminate noise to identify cleaner wave structures
Use fractal markers as potential wave endpoints
Reference the Hull MA for determining the broader trend
For General Trading
Identify high-noise periods to avoid low-quality setups
Spot clearer market phases for better entries
Assess price action quality through visual cues
Multi-Timeframe Approach
Apply the indicator across different timeframes for a comprehensive view
Prefer trading when both higher and lower timeframes align with consistent signals
Optimal Settings
For Very Short Timeframes (1–5 minutes)
Higher Noise Threshold (0.4–0.5)
Longer ATR Period (20–30)
Higher Volume Threshold (1.0–1.2)
For Medium Timeframes (15–60 minutes)
Medium Noise Threshold (0.2–0.3)
Standard ATR Period (14)
Standard Volume Threshold (0.8)
For Higher Timeframes (4h and above)
Lower Noise Threshold (0.1–0.2)
Shorter ATR Period (10)
Lower Volume Threshold (0.6–0.7)
Conclusion
The Elliott Wave Noise Filter is an essential tool for any Elliott Wave analyst or trader working on lower timeframes. By reducing noise and emphasizing significant market movements, it enables more precise analysis and potentially more profitable trading decisions.
Note: As with any technical indicator, the Elliott Wave Noise Filter should be used as part of a broader trading strategy and not as a standalone signal for trade execution.
Wave Analysis

IU Mean Reversion SystemDESCRIPTION
The IU Mean Reversion System is a dynamic mean reversion-based trading framework designed to identify optimal reversal zones using a smoothed mean and a volatility-adjusted band. This system captures price extremes by combining exponential and running moving averages with the Average True Range (ATR), effectively identifying overextended price action that is likely to revert back to its mean. It provides precise long and short entries with corresponding exit conditions, making it ideal for range-bound markets or phases of low volatility.
USER INPUTS :
Mean Length – Controls the smoothness of the mean; default is 9.
ATR Length – Defines the lookback period for ATR-based band calculation; default is 100.
Multiplier – Determines how wide the upper and lower bands are from the mean; default is 3.
LONG CONDITION :
A long entry is triggered when the closing price crosses above the lower band, indicating a potential upward mean reversion.
A position is taken only if there is no active long position already.
SHORT CONDITION :
A short entry is triggered when the closing price crosses below the upper band, signaling a potential downward mean reversion.
A position is taken only if there is no active short position already.
LONG EXIT :
A long position exits when the high price crosses above the mean, implying that price has reverted back to its average and may no longer offer favorable long risk-reward.
SHORT EXIT :
A short position exits when the low price crosses below the mean, indicating the mean reversion has occurred and the downside opportunity has likely played out.
WHY IT IS UNIQUE:
Uses a double smoothing approach (EMA + RMA) to define a stable mean, reducing noise and false signals.
Adapts dynamically to volatility using ATR-based bands, allowing it to handle different market conditions effectively.
Implements a state-aware entry system using persistent variables, avoiding redundant entries and improving clarity.
The logic is clear, concise, and modular, making it easy to modify or integrate with other systems.
HOW USER CAN BENEFIT FROM IT :
Traders can easily identify reversion opportunities in sideways or mean-reverting environments.
Entry and exit points are visually labeled on the chart, aiding in clarity and trade review.
Helps maintain discipline and consistency by using a rule-based framework instead of subjective judgment.
Can be combined with other trend filters, momentum indicators, or higher time frame context for enhanced results.

Aggregated VolumeThis is the volume for crypto instruments. The volume in crypto instruments is different from the volume in stock or forex instruments. Because in crypto instrument at the same coin, for example bitcoin, there are differences in volume appearing on chart in Tradingview between exchanges. For example the exchanges on Binance and OKX, and between the spot market and the future or perpetual market, even though the transaction is in the same coin, bitcoin, there are differences in volume appearing on chart.
For those of us who trade relying on base volume as the main analysis in trading or investing, it is important to see the differences in volume between exchanges on Bitget, Binance, Bybit, and others, that Tradingview does not display the total transaction volume on the chart, but only the transaction volume per exchange, that does not describe the reality of the transaction volume. Therefore we need an indicator that totals volume on all exchanges, both spot and future / perpetual markets.
This indicator is called Aggregated Volume, which is the total volume of the exchanges: Binance, Bybit, OKX, Coinbase, Bitget, Kukoin, Kraken, Cryptocom, and Mexc. We chose these exchanges because they are the top 9 exchanges in the world that dominate the crypto market.
Therefore, this indicator appearing the total volume of transactions made on the 9 exchanges, both spot and perpetual, and will be summed into one volume indicator called " Aggregated Volume ".

Money Flow: In & Out Detector[THANHCONG]Indicator Name:
Money Flow: In & Out Detector
Indicator Description:
The Money Flow: In & Out Detector indicator uses technical indicators such as RSI (Relative Strength Index), MFI (Money Flow Index), and volume analysis to determine money inflow and outflow in the market.
This indicator helps traders identify changes in money flow, allowing them to detect buy and sell signals based on the combination of the following factors:
RSI > 50 and MFI > 50: Money inflow, indicating a buy signal.
RSI < 50 and MFI < 50: Money outflow, indicating a sell signal.
Volume increase/decrease relative to the average: Identifies strong market behavior changes.
Adjustable Parameters:
RSI Length: The number of periods to calculate the RSI (default is 14).
MFI Length: The number of periods to calculate the MFI (default is 14).
Volume MA Length: The number of periods to calculate the moving average of volume (default is 20).
Volume Increase/Decrease (%): The percentage threshold for volume change compared to the moving average (default is 20%).
Look Back Period: The number of periods used to identify peaks and troughs (default is 20).
How to Use the Indicator:
Money Inflow: When both RSI and MFI are above 50, and volume increases significantly relative to the moving average, the indicator shows a Buy signal.
Money Outflow: When both RSI and MFI are below 50, and volume decreases significantly relative to the moving average, the indicator shows a Sell signal.
Identifying Peaks and Troughs: The indicator also helps identify market peaks and troughs based on technical conditions.
Note:
This indicator assists in decision-making, but does not replace comprehensive market analysis.
Use this indicator in conjunction with other technical analysis methods to increase the accuracy of trade signals.
Steps for Publishing the Indicator on TradingView:
Log in to TradingView:
Go to TradingView and log into your account.
Access Pine Script Editor:
Click on Pine Editor from the menu under the chart.
Paste your Pine Script® code into the editor window.
Check the Source Code:
Ensure your code is error-free and running correctly.
Review the entire source code and add the MPL-2.0 license notice if necessary.
Save and Publish:
After testing and confirming the code works correctly, click Add to Chart to try the indicator on your chart.
If satisfied with the result, click Publish Script at the top right of the Pine Editor.
Provide a name for the indicator and then enter the detailed description you’ve prepared.
Ensure you specify the MPL-2.0 license in the description if required.
Choose the Access Type:
You can choose either Public or Private access for your indicator depending on your intention.
Submit for Publication:
Wait for TradingView to review and approve your indicator. Typically, this process takes a few working days for verification and approval.
User Guide:
You can share detailed instructions for users on how to use the indicator on TradingView, including how to adjust the parameters and interpret the signals. For example:
Set RSI Length: Experiment with different RSI Length values to find the sensitivity that suits your strategy.
Interpreting In/Out Signals: When there is strong money inflow (In), consider entering a buy order. When there is strong money outflow (Out), consider selling.

VWAP Double Touch Alert (Timeframe-Aware)📌 VWAP Double Touch Alert — Smart Re-entry Signal for Precision Traders
Take your VWAP trading to the next level with this intelligent indicator that filters out the noise and zeroes in on high-probability re-entry setups.
💡 How it works:
This script tracks every time price touches the VWAP line and alerts you when it happens twice within a defined window of time (adjustable per your timeframe). This is often a sign of smart money accumulation, potential reversals, or explosive breakouts.
🔍 Why Traders Love It:
✅ Filters out weak signals — only alerts on confirmed double touches
✅ Fully adjustable VWAP zone sensitivity
✅ Selectable timeframe profiles or custom window (1m, 5m, 15m, 30m, etc.)
✅ Clean visual cues with minimal chart clutter
✅ Perfect for scalping, intraday reversals, or VWAP mean-reversion strategies
⚙️ Customization:
VWAP zone width (in %)
Time window in bars or automatic based on timeframe
Custom alert messages
Alert only triggers once per double-touch event to avoid spamming
🎯 Best For:
Crypto scalpers & day traders
VWAP bounce and mean-reversion traders
Traders who want clean, conclusive entry alerts without lag
Long Short dom📊 Long Short dom (VI+) — Custom Vortex Trend Strength Indicator
This indicator is a refined version of the Vortex Indicator (VI) designed to help traders identify trend direction, momentum dominance, and potential long/short opportunities based on VI+ and VI– dynamics.
🔍 What It Shows:
• VI+ (Green Line): Measures upward trend strength.
• VI– (Red Line): Measures downward trend strength.
• Histogram (optional): Displays the difference between VI+ and VI–, helping visualize which side is dominant.
• Background Coloring: Highlights bullish or bearish dominance zones.
• Zero Line: A visual baseline to enhance clarity.
• Highest/Lowest Active Lines: Real-time markers for the strongest directional signals.
⸻
🛠️ Inputs:
• Length: Vortex calculation period (default 14).
• Show Histogram: Enable/disable VI+–VI– difference bars.
• Show Trend Background: Toggle colored zones showing trend dominance.
• Show Below Zero: Decide whether to display values that fall below 0 (for advanced use).
⸻
📈 Strategy Insights:
• When VI+ crosses above VI–, it indicates potential long momentum.
• When VI+ crosses below VI–, it signals possible short pressure.
• The delta histogram (VI+ – VI–) helps you quickly see shifts in momentum strength.
• The background shading provides an intuitive visual cue to assess trend dominance at a glance.
⸻
🚨 Built-in Alerts:
• Bullish Cross: VI+ crosses above VI– → possible entry long.
• Bearish Cross: VI+ crosses below VI– → possible entry short.
⸻
✅ Ideal For:
• Trend-following strategies
• Identifying long/short bias
• Confirming entries/exits with momentum analysis
⸻
This tool gives you clean, real-time visual insight into trend strength and shift dynamics, empowering smarter trade decisions with clarity and confidence.
Vietnamese Market Structure With CountersThis indicator is designed to track Market Structure with Swing-Low Breakdowns and Swing-High Breakups specifically tailored for the Vietnamese stock market, though it can be applied elsewhere too. By default, it uses a 10-period EMA to dynamically detect key turning points in price action and count significant breakdowns or breakups from previous swing levels.
As an open source, you can modify the source code to match your needs.
What it does:
Detects when price breaks below previous swing lows or above previous swing highs.
Plots swing levels for both highs and lows.
Displays labeled counters on the chart to show how many consecutive breakdowns or breakups have occurred.
Helps traders identify trend shifts and possible exhaustion in moves.
Why it's useful:
This tool is great for visually tracking market momentum and structure changes — especially in trending or volatile environments. It emphasizes structure over indicators, helping you understand price behavior in a simplified, intuitive way.
License:
This script is published under the Mozilla Public License 2.0. Feel free to use, modify, and contribute!
Created with care by @doqkhanh.
If you find it useful, consider leaving a comment or sharing it with others!

Parsifal.Swing.TrendScoreThe Parsifal.Swing.TrendScore indicator is a module within the Parsifal Swing Suite, which includes a set of swing indicators such as:
• Parsifal Swing TrendScore
• Parsifal Swing Composite
• Parsifal Swing RSI
• Parsifal Swing Flow
Each module serves as an indicator facilitating judgment of the current swing state in the underlying market.
________________________________________
Background
Market movements typically follow a time-varying trend channel within which prices oscillate. These oscillations—or swings—within the trend are inherently tradable.
They can be approached:
• One-sidedly, aligning with the trend (generally safer), or
• Two-sidedly, aiming to profit from mean reversions as well.
Note: Mean reversions in strong trends often manifest as sideways consolidations, making one-sided trades more stable.
________________________________________
The Parsifal Swing Suite
The modules aim to provide additional insights into the swing state within a trend and offer various trigger points to assist with entry decisions.
All modules in the suite act as weak oscillators, meaning they fluctuate within a range but are not bounded like true oscillators (e.g., RSI, which is constrained between 0% and 100%).
________________________________________
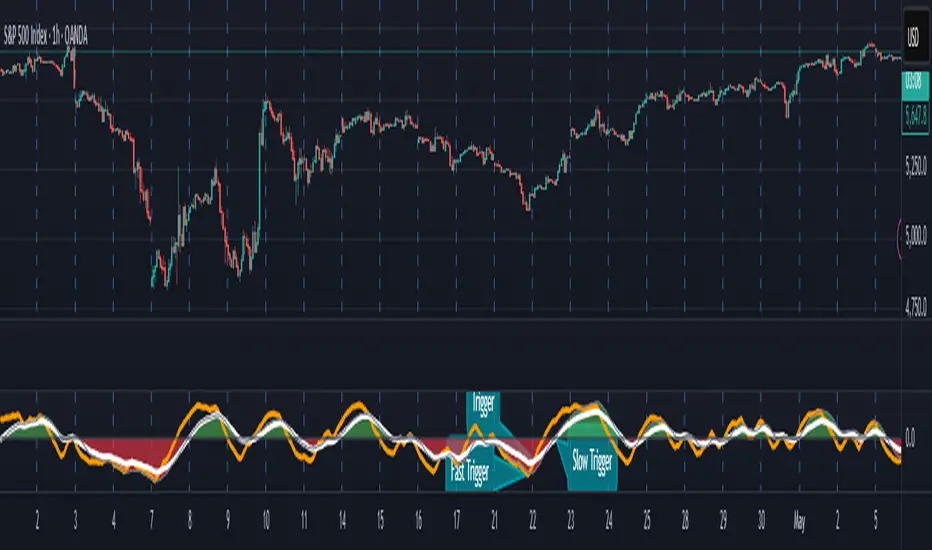
The Parsifal.Swing.TrendScore – Specifics
The Parsifal.Swing.TrendScore module combines short-term trend data with information about the current swing state, derived from raw price data and classical technical indicators. It provides an indication of how well the short-term trend aligns with the prevailing swing, based on recent market behavior.
________________________________________
How Swing.TrendScore Works
The Swing.TrendScore calculates a swing score by collecting data within a bin (i.e., a single candle or time bucket) that signals an upside or downside swing. These signals are then aggregated together with insights from classical swing indicators.
Additionally, it calculates a short-term trend score using core technical signals, including:
• The Z-score of the price's distance from various EMAs
• The slope of EMAs
• Other trend-strength signals from additional technical indicators
These two components—the swing score and the trend score—are then combined to form the Swing.TrendScore indicator, which evaluates the short-term trend in context with swing behavior.
________________________________________
How to Interpret Swing.TrendScore
The trend component enhances Swing.TrendScore’s ability to provide stronger signals when the short-term trend and swing state align.
It can also override the swing score; for example, even if a mean reversion appears to be forming, a dominant short-term trend may still control the market behavior.
This makes Swing.TrendScore particularly valuable for:
• Short-term trend-following strategies
• Medium-term swing trading
Unlike typical swing indicators, Swing.TrendScore is designed to respond more to medium-term swings rather than short-lived fluctuations.
________________________________________
Behavior and Chart Representation
The Swing.TrendScore indicator fluctuates within a range, as most of its components are range-bound (though Z-score components may technically extend beyond).
• Historically high or low values may suggest overbought or oversold conditions
• The chart displays:
o A fast curve (orange)
o A slow curve (white)
o A shaded background representing the market state
• Extreme values followed by curve reversals may signal a developing mean reversion
________________________________________
TrendScore Background Value
The Background Value reflects the combined state of the short-term trend and swing:
• > 0 (shaded green) → Bullish mode: swing and short-term trend both upward
• < 0 (shaded red) → Bearish mode: swing and short-term trend both downward
• The absolute value represents the confidence level in the market mode
Notably, the Background Value can remain positive during short downswings if the short-term trend remains bullish—and vice versa.
________________________________________
How to Use the Parsifal.Swing.TrendScore
Several change points can act as entry triggers or aids:
• Fast Trigger: change in slope of the fast signal curve
• Trigger: fast line crosses slow line or the slope of the slow signal changes
• Slow Trigger: change in sign of the Background Value
Examples of these trigger points are illustrated in the accompanying chart.
Additionally, market highs and lows aligning with the swing indicator values may serve as pivot points in the evolving price process.
________________________________________
As always, this indicator should be used in conjunction with other tools and market context in live trading.
While it provides valuable insight and potential entry points, it does not predict future price action.
Instead, it reflects recent tendencies and should be used judiciously.
________________________________________
Extensions
The aggregation of information—whether derived from bins or technical indicators—is currently performed via simple averaging. However, this can be modified using alternative weighting schemes, based on:
• Historical performance
• Relevance of the data
• Specific market conditions
Smoothing periods used in calculations are also modifiable. In general, the EMAs applied for smoothing can be extended to reflect expectations based on relevance-weighted probability measures.
Since EMAs inherently give more weight to recent data, this allows for adaptive smoothing.
Additionally, EMAs may be further extended to incorporate negative weights, akin to wavelet transform techniques.

Nifty Sectoral Performance ComparisonThis Pine Script indicator tracks and compares the percentage performance of Indian sectoral and thematic indices (e.g., Nifty 50, Nifty Bank, Nifty IT) relative to their starting price in a user-defined timeframe. Performance is plotted as colored lines on the chart, with transparent labels showing percentage changes. A user-configurable label offset ensures clarity. Ideal for analyzing sectoral trends in the Indian market.
Features
Multi-Index Tracking:
Monitors up to 21 indices in five groups:
Core/Large Cap: Nifty 50, Nifty Bank, Nifty Auto, Nifty IT, Nifty FMCG, Nifty Fin Services
Thematic/Sectoral: SENSEX, Nifty Healthcare, Nifty Metal, Nifty Pharma
Bank Sub-Indices & Realty: Nifty Pvt Bank, Nifty PSU Bank, Nifty Realty
Consumption & Energy: Nifty ConsDurables, Nifty Oil & Gas
MidSmall Cap Thematic: Nifty MidSmFinSrv, S&P BSE Healthcare, Nifty MidSmIT&Tel
Calculates performance as the percentage change from the first valid close in the timeframe.
Customizable Display:
Toggle each index on/off via boolean inputs.
Define ticker symbols and colors for each index (e.g., Blue for Nifty 50, Green for Nifty Fin Services).
Colors are preset but editable for clear differentiation.
Labeling:
Displays index name and performance (e.g., "Nifty 50: 12.34%") with transparent labels (no background).
Labels match the plot color and are positioned using a user-defined offset (in bars) to avoid overlap.
Precision and Timeframe:
Shows performance with two decimal places.
Supports custom timeframes (e.g., daily, weekly) for flexible analysis.
Overlay Mode:
Plots performance lines on the price chart for direct comparison with price movements.
Inputs
Label Offset (Bars): Set label position left of the current bar (default: 5, min: 0).
Show : Enable/disable each index’s plot and label.
Ticker : Specify ticker symbols (e.g., NSE:NIFTY).
Color : Choose plot and label colors.
How It Works
Performance Calculation:
Fetches closing prices via request.security for the specified ticker and timeframe.
Captures the first valid close as the starting price.
Computes performance: ((current_price / start_price) - 1) * 100.
Handles invalid data (e.g., na or zero start price) by returning na.
Plotting:
Plots enabled indices with valid performance as lines (linewidth: 1) in user-defined colors.
Labeling:
Creates labels for enabled indices with valid performance at bar_index - label_offset and the performance value.
Labels show the index name and percentage (e.g., "Auto: 5.67%") in the plot’s color, with no background.
Usage
Setup: Apply to a TradingView chart and set the desired timeframe.
Customize:
Enable relevant indices, adjust tickers, and modify colors.
Set Label Offset to position labels clearly.
Analyze:
Compare lines to spot outperforming/underperforming sectors.
Use labels for precise performance values.
Pair with price action or other indicators for trading insights.

Parsifal.Swing.CompositeThe Parsifal.Swing.Composite indicator is a module within the Parsifal Swing Suite, which includes a set of swing indicators such as:
• Parsifal Swing TrendScore
• Parsifal Swing Composite
• Parsifal Swing RSI
• Parsifal Swing Flow
Each module serves as an indicator facilitating judgment of the current swing state in the underlying market.
________________________________________
Background
Market movements typically follow a time-varying trend channel within which prices oscillate. These oscillations—or swings—within the trend are inherently tradable.
They can be approached:
• One-sidedly, aligning with the trend (generally safer), or
• Two-sidedly, aiming to profit from mean reversions as well.
Note: Mean reversions in strong trends often manifest as sideways consolidations, making one-sided trades more stable.
________________________________________
The Parsifal Swing Suite
The modules aim to provide additional insights into the swing state within a trend and offer various trigger points to assist with entry decisions.
All modules in the suite act as weak oscillators, meaning they fluctuate within a range but are not bounded like true oscillators (e.g., RSI, which is constrained between 0% and 100%).
________________________________________
The Parsifal.Swing.Composite – Specifics
This module consolidates multiple insights into price swing behavior, synthesizing them into an indicator reflecting the current swing state.
It employs layered bagging and smoothing operations based on standard price inputs (OHLC) and classical technical indicators. The module integrates several slightly different sub-modules.
Process overview:
1. Per candle/bin, sub-modules collect directional signals (up/down), with each signal casting a vote.
2. These votes are aggregated via majority counting (bagging) into a single bin vote.
3. Bin votes are then smoothed, typically with short-term EMAs, to create a sub-module vote.
4. These sub-module votes are aggregated and smoothed again to generate the final module vote.
The final vote is a score indicating the module’s assessment of the current swing state. While it fluctuates in a range, it's not a true oscillator, as most inputs are normalized via Z-scores (value divided by standard deviation over a period).
• Historically high or low values correspond to high or low quantiles, suggesting potential overbought or oversold conditions.
• The chart displays a fast (orange) and slow (white) curve against a solid background state.
• Extreme values followed by curve reversals may signal upcoming mean-reversions.
Background Value:
• Value > 0: shaded green → bullish mode
• Value < 0: shaded red → bearish mode
• The absolute value indicates confidence in the mode.
________________________________________
How to Use the Parsifal.Swing.Composite
Several change points in the indicator serve as potential entry triggers:
• Fast Trigger: change in slope of the fast curve
• Trigger: fast line crossing the slow line or change in the slow curve’s slope
• Slow Trigger: change in sign of the background value
These are illustrated in the introductory chart.
Additionally, market highs and lows aligned with swing values may act as pivot points, support, or resistance levels for evolving price processes.
________________________________________
As always, supplement this indicator with other tools and market information. While it provides valuable insights and potential entry points, it does not predict future prices. It reflects recent tendencies and should be used judiciously.
________________________________________
Extensions
All modules in the Parsifal Swing Suite are simple yet adaptable, whether used individually or in combination.
Customization options:
• Weights in EMAs for smoothing are adjustable
• Bin vote aggregation (currently via sum-of-experts) can be modified
• Alternative weighting schemes can be tested
Advanced options:
• Bagging weights may be historical, informational, or relevance-based
• Selection algorithms (e.g., ID3, C4.5, CAT) could replace the current bagging approach
• EMAs may be generalized into expectations relative to relevance-based probability
• Negative weights (akin to wavelet transforms) can be incorporated
CoffeeShopCrypto Supply Demand PPO AdvancedCoffeeShopCrypto PPO Advanced is a structure-aware momentum oscillator and price-trend overlay designed to help traders interpret momentum strength, exhaustion, and continuation across evolving market conditions. It’s not a “buy/sell” signal tool — it's a momentum context tool that helps confirm trend intent.
Original Code derived from the Price Oscillator Indicators (PPO) found in the TradingView Technical Indicators categories. You can view the info and calculation for the original PPO here
www.tradingview.com
Much like the MACD, the PPO uses a couple lagging indicators to present Momentum as a percentage. But it lacks context to market structure.
What It’s Based On
This tool is based on a dual-moving-average PPO oscillator structure (Percentage Price Oscillator) enhanced by:
Oscillator pivot structure: detection of Lower Highs (LH) and Higher Lows (HL) inside the oscillator.
Detection of Supply and Demand Trends via Market Absorption
Ability to transfer its average plots to price action
Detection of Trend Exhaustion
Real-time price-based exhaustion levels: projecting potential future supply and demand using trendlines from weakening momentum.
Integrated fast and slow Moving Averages on price using the same inputs as the oscillator, to visualize alignment between short- and long-term trends.
These elements combine momentum context with price action in a visual, intuitive system.
How It Works
1. Oscillator Structure
LHs (above zero): momentum weakening in uptrends.
HLs (below zero): momentum strengthening in downtrends.
Only valid pivots are shown (e.g., an LH must be preceded by a valid LL).
2. Exhaustion Levels
Green demand lines: price is making new lows, but oscillator prints HL → potential exhaustion.
Red supply lines: price is making new highs, but oscillator prints LH → potential exhaustion.
These lines are future-facing, projecting likely reaction zones based on momentum weakening.
3. Moving Averages on Price
Two MAs are drawn on the price chart:
Fast MA (same length as PPO short input)
Slow MA (same length as PPO long input)
These are not signal lines — they're visual guides for trend alignment.
MA crossover = PO crosses zero. This indicates short- and long-term momentum are syncing — a powerful signal of trend conviction.
When price is above both MAs, and the PO is rising above zero, bullish momentum is dominant.
When price is below both MAs, and the PO is falling below zero, bearish momentum dominates.
How Traders Can Use It
✅ Spot Trend Initiation
Wait for clear trend confirmation in price.
Use PPO Momentum+ to confirm momentum structure is aligned (e.g., HH/HL in oscillator + price above both MAs).
🔁 Track Continuations
In uptrends, look for oscillator HH and HL sequences with price holding above both MAs.
In downtrends, seek LL and LH sequences with price below both MAs.
⚠️ Watch for Exhaustion
Price breaking below red (supply) lines after oscillator LH = bearish exhaustion signal.
Price breaking above green (demand) lines after oscillator HL = bullish exhaustion signal.
These levels act like pre-mapped S/R zones, showing where momentum previously failed and price may react.
Why This Is Different
Momentum tools often lag or mislead when used blindly. This tool visualizes structural failure in momentum and maps potential outcomes. The integration of oscillator and price-based tools ensures traders are always reading context, not just raw signals.
Demand Trendlines
Demand trendlines show us Wykoff's law of "Absorbed Supply Reversal" In real time.
When aggressive selling pressure is persistently absorbed by passive buying interest without significant downward price continuation, and supply becomes exhausted, the market structure shifts as demand regains control—resulting in a directional reversal to the upside.
This commonly happens in a 3 phase interaction of price.
1. Selling pressure is absorbed quickly by buyers.
This PPO tool will calculate the trend of this absorption process
2. After there is a notable Bearish Exhaustion of price action, the PPO tool will draw a trendline of this absorption showing us the potential future prices where aggressive buyers will want to step in at lower prices.
3. After higher lows are defined in the oscillator, you'll see prices react in a strong bullish pattern at this trendline where aggressive buyers stepped in to reverse price action to the upside.
Supply Trendlines
Supply trendlines show us Wykoff's law of "Absorbed Demand Reversal" In real time.
When aggressive buying pressure is persistently absorbed by passive selling interest without significant downward price continuation, and demand becomes exhausted, the market structure shifts as supply regains control—resulting in a directional reversal to the downside.
This commonly happens in a 3 phase interaction of price.
1. Buying pressure is absorbed quickly by sellers.
This PPO tool will calculate the trend of this absorption process.
2. After there is a notable Bullish Exhaustion of price action, the PPO tool will draw a trendline of this absorption showing us the potential future prices where aggressive sellers will want to step in at higher prices.
3. After lower highs are defined in the oscillator, you'll see prices react in a strong bearish pattern at this trendline where aggressive sellers stepped in to reverse price action to the downside.
Lower High and Higher Low Signals
When the oscillator signals Lower Highs or High Lows its only noting that momentum in that trend direction is slowing. THis indicates a coming pause in the market and the proceeding longs of an uptrend or shorts of a downtrend should be taken with caution.
**These LH and HL markers are not reading as divergences in price vs momentum.**
They are simply registering against the highs and lows of itself..
Moving Averages on Price Action
The Oscillator will cross over its ZERO level the same time your Short and Long MAs cross each other. This will indicate that the short term average trend is moving ahead of the long term.
Crossovers are not an entry signal. It's a method in determining you current timeframe trend strength. Always observe price action as it passes through each of your moving averages and compare it to the positioning and direction of the oscillator.
If price dips in between the moving averages while the oscillator still shows a strong trend strength, you can wait for price to move ahead of your fast moving average.
Bar Colors and Signal Line for Trend Strength
Good Bullish Trend = Oscillator above zero + Signal rising below Oscillator
Weak Bullish Trend = Oscillator above zero + Signal above Oscillator
Good Bearish Trend = Oscillator below zero + Signal falling above Oscillator
Weak Bearish Trend = Oscillator below zero + Signal below Oscillator
Bar Colors
Bars are colored to match Oscillator Momentum Strength. Colors are set by user.
Why alter the known PPO (Percentage Price Oscillator) in this manner?
The PPO tool is great for measuring the strength as percentage of price action over and average amount of candles however, with these changes,
you know have the ability to correlate:
Wycoff theory of supply and demand,
Measure the depth of reversals and pullback by price positioning against moving averages,
Project potential reversal and exhaustion pricing,
Visibly note the structure of momentum much like you would note market structure,
Its not enough to know there is momentum. Its better to know
A) Is it enough
B) Is there something in the way which will cause price to push back
C) Does this momentum correlate to the prevailing trend

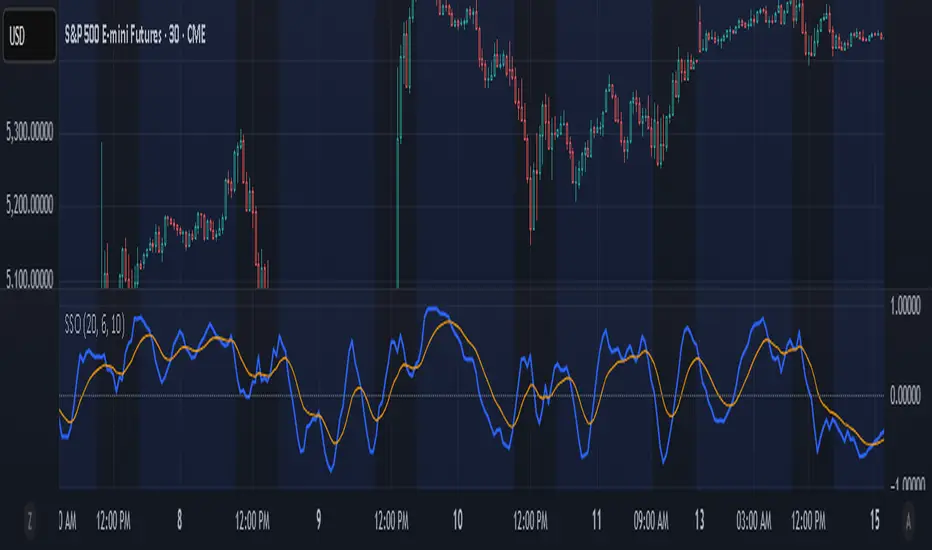
Sine Swing OscillatorThe Sine Swing Oscillator (SSO) is a custom momentum indicator that transforms price movement into a sine-based oscillator ranging from -1 to +1. It does this by measuring the deviation of the current price from a reference price, which is updated at fixed bar intervals. The price deviation is normalized using the Average True Range (ATR) over the same interval, then mapped through a sine transformation to create a bounded oscillator. This transformation helps identify cyclical price behavior in a consistent range.
The resulting sine values are smoothed using a Simple Moving Average (SMA), and a signal line is derived by applying an Exponential Moving Average (EMA) to the smoothed oscillator. Traders can use signal line crossovers, or moves through the zero line, to help identify potential entry or exit signals based on cyclical momentum shifts.
The oscillator and signal line are plotted in a separate pane, with user-configurable smoothing lengths and colors. The zero line is also included for reference.
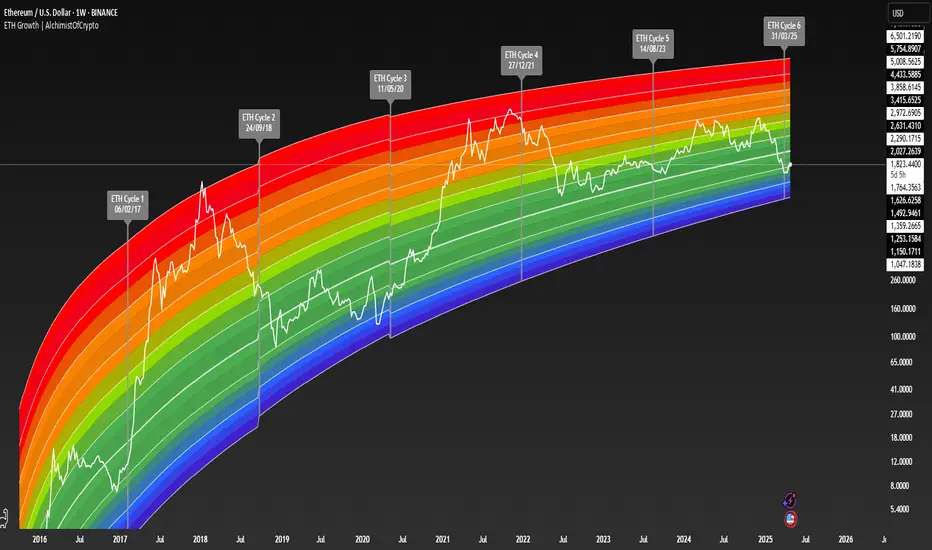
ETH Growth | AlchimistOfCrypto⚠️ DISCLAIMER: This indicator's source code is kept private as it represents a first-of-its-kind innovation in algorithmic cycle detection and visualization for Ethereum. The mathematical models and proprietary algorithms powering this indicator are the result of extensive research and development.
🌈 ETH Growth Rainbow – Unveiling Ethereum's Logarithmic Growth Fields 🌈
"The ETH Growth Rainbow, engineered through advanced logarithmic mathematics, visualizes the probabilistic distribution of Ethereum's price evolution within a multi-cycle growth paradigm. This indicator employs principles from logarithmic regression where coefficients p001, p002, and p003 create mathematical boundaries that define Ethereum's long-term value progression. Our implementation features algorithmically enhanced rainbow visualization derived from Fast Fourier Transform (FFT) spectral analysis, creating a dynamic representation of Ethereum's logarithmic growth with adaptive color gradients that highlight critical cycle-based phase transitions in the asset's monetary evolution."
📊 Professional Trading Application
The ETH Growth Rainbow transcends traditional price prediction models with a sophisticated multi-band illumination system that reveals the underlying structure of Ethereum's monetary evolution. Scientifically calibrated across multiple 85-week cycles (detected through spectral analysis) and featuring seamless rainbow visualization, it enables investors to perceive Ethereum's position within its macro growth trajectory with unprecedented clarity.
- Cycle Detection Methodology 🔬
The 85-week Ethereum cycle was discovered through sophisticated Fast Fourier Transform (FFT) analysis:
- Logarithmic price returns extracted from historical Ethereum data
- FFT decomposition identifies dominant frequency components in price movements
- Signal amplitude analysis reveals the 85-week cycle as the most statistically significant periodicity
- Adaptive frequency filtering validates cycle consistency across multiple market phases
- Cycle duration rounded to nearest week for practical application
- Visual Theming 🎨
Scientifically designed rainbow gradient optimized for cycle pattern recognition:
- Violet-Blue: Lower value accumulation zones with highest mathematical growth potential
- Green: Fair value equilibrium zone representing the regression mean
- Yellow-Orange: Moderate overvaluation regions indicating potential resistance
- Red: Statistical extreme zones indicating mathematical cycle peaks
- Deep Red: New euphoria band (+6) capturing exceptional market extremes
- Cycle Visualization 🔍
- Precise cycle boundaries demarcating Ethereum's fundamental cycle events
- Adaptive band spacing based on mathematical cycle progression (p003 = 0.858)
- Multiple sub-cycle markers revealing the probabilistic nature of Ethereum's trajectory
- Initial cycle starting from 0.1639 (August 3, 2015) to preserve historical accuracy
🚀 How to Use
1. Identify Macro Position ⏰: Locate Ethereum's current price relative to regression bands
2. Understand Cycle Context 🎚️: Note position within the current 85-week cycle for time-based analysis
3. Assess Mathematical Value 🌈: Determine potential over/undervaluation based on band location
4. Adjust Investment Strategy 🔎: Modulate position sizing based on mathematical value assessment
5. Identify Cycle Phases ✅: Monitor band transitions to detect accumulation and distribution zones
6. Invest with Precision 🛡️: Utilize lower bands for strategic accumulation, upper bands for strategic reduction
7. Manage Risk Dynamically 🔐: Scale investment allocations based on mathematical cycle positioning
#ethereum #ETH #cryptocurrency #tradingview #technicalanalysis #logarithmicregression #rainbowchart #cryptotrading #tradingstrategy #priceaction #cryptoinvesting #ethanalysis #tradingbands #cryptoresearch #FFTanalysis #cyclicalanalysis #ethinvestment #ethusd #buyandsell #accumulation #macroindicator #valueanalysis #priceprediction #ethgrowth #cryptosignals #cyclicpatterns #mathematicaltrading #AI #smartmoney #cryptowhales
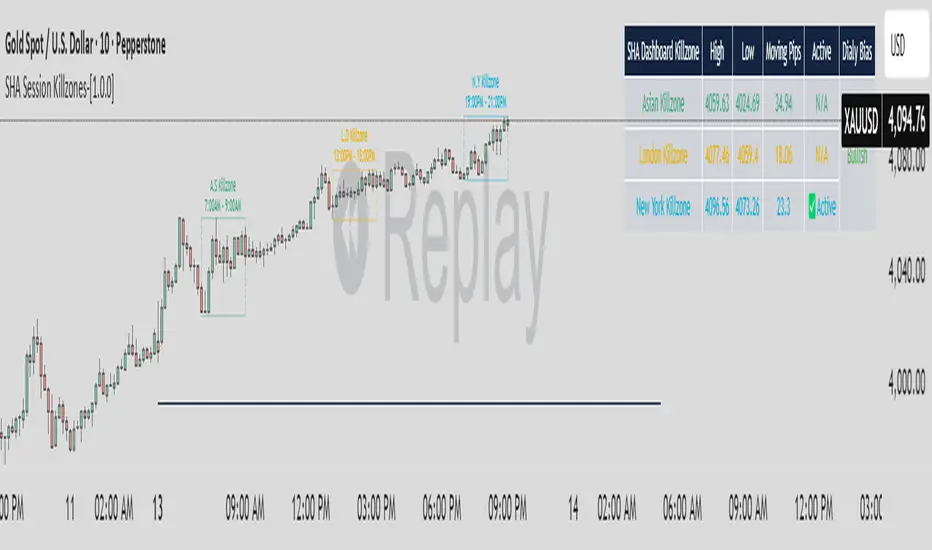
SHA Session Killzones-[1.0.0]
🔰 SHA Session Killzones
Created by:
Version: 1.0.0
Timeframes: Optimized for 5m,10m, 15m, 30m, and 1h
✨ Description:
The SHA Session Killzones indicator automatically highlights the most volatile market hours — the Asian, London, and New York sessions — directly on your chart. Each killzone is color-coded and visually boxed to help you identify:
- 🟧 Asian Killzone (07:00–09:00)
- 🟦 London Killzone (13:00–15:00)
- 🟪 New York Killzone (19:00–21:00)
This indicator helps you:
- 🔍 Focus only on high-probability trading windows
- 🚫 Avoid low-liquidity traps
- 🔄 Plan breakout/reversal strategies during peak hours
- 📊 Use session highs/lows as key intraday S/R levels
⚙️ Features:
- Adjustable time zones (default: UTC+7)
- Automatic session labeling
- Clean and minimal visuals for optimal chart clarity
- Compatible with all instruments, especially Gold (XAUUSD)
🧠 How to Use:
- Use with your trading strategy to filter out noise
- Apply on 10m–30m timeframes for maximum precision
📌 Tip:
Use in confluence with market structure, volume spikes, or news catalysts for more effective entries.
MACD Bullish Cross Alert📘 Indicator Description – MACD Bullish Cross Alert
This indicator is designed to detect bullish momentum shifts using the classic MACD (Moving Average Convergence Divergence) crossover strategy.
Key Features:
Calculates the MACD Line and Signal Line using customizable inputs (default: 12, 26, 9).
Triggers an alert when the MACD Line (blue) crosses above the Signal Line (orange).
Helps identify early bullish trend reversals or momentum entry points.
Ideal for swing traders, position traders, and crypto investors using the weekly timeframe.
How to Use:
Add to any chart and set the timeframe to 1W (weekly).
Create an alert using the built-in MACD Bullish Crossover condition.
Combine with price action, volume, or RSI for higher conviction entries.
Use Cases:
Spotting early entry points after long downtrends.
Confirming a trend reversal in high timeframes.
Generating high-probability entries in trend-following systems.

Liquidity Fair Value Bands | QuantumResearch 🔹 Liquidity Fair Value Bands | QuantumResearch
A Dynamic Liquidity-Based Fair Value Model Using Volume-Weighted Linear Regression and Deviation Bands
📘 Overview
The Liquidity Fair Value Bands is a specialized volatility and valuation indicator designed to help traders identify dynamic fair value zones based on liquidity-adjusted price behavior. Unlike standard deviation bands or traditional moving averages, this tool integrates volume-weighted linear regression to estimate a fair value baseline — a more accurate representation of price equilibrium under active market participation.
This script is not a simple mashup of existing indicators. It introduces a novel concept by fusing the following elements:
📊 Volume-Weighted Linear Regression (VWLR) to determine the fair value baseline
📈 Standard Deviation Bands layered around this baseline to visualize statistically significant deviations
🔄 Trend Signals derived from slope direction and baseline crossover
🎨 Gradient-Based Visual Modes for enhanced readability
🚨 Built-in Alerts for overbought/oversold and trend breakout conditions
🧠 Concept & Calculation
🟩 1. Fair Value Baseline (Core Innovation)
The baseline is calculated using a volume weighted linear regression.
This formula ensures that higher-volume periods influence the regression line more heavily, offering a liquidity-aware estimate of what the asset is “really worth” based on market consensus.
A positive slope indicates a growing fair value — bullish environment
A negative slope signals declining fair value — bearish environment
📏 2. Deviation Bands
Three layers of symmetric deviation bands are plotted above and below the baseline, each representing a multiple of standard deviation (1σ, 2σ, 3σ) over the same lookback period:
Upper Bands highlight statistically significant overvaluation
Lower Bands indicate undervaluation and potential reversion zones
These zones are visualized using translucent color fills to help traders instantly interpret risk/reward conditions.
🔄 3. Trend Detection
Optionally, the indicator displays up/down arrows when the price crosses the fair value baseline and a new trend is forming:
✅ Uptrend: Price crosses above baseline and baseline slope increases
🔻 Downtrend: Price drops below baseline and slope declines
These dynamic signals allow you to react to trend reversals early, rather than waiting for lagging confirmation.
🎯 How to Use
This tool excels in trend-trading, mean reversion, and liquidity-based fair value analysis.
✅ Buy Zones: Price enters lower bands (e.g. -1σ to -3σ) during lower fair value zone
❌ Sell Zones: Price enters upper bands (e.g. +1σ to +3σ) during higher fair value
🕵️♂️ Fair Value Confirmation: Flat baseline in consolidating markets helps avoid chop
📈 Trend Entry: Use baseline crossovers and band inflections to time entries
⚙️ Customization Features
🔧 Adjustable regression length and offset
🎨 Eight visual modes for light/dark themes
🔔 Optional alerts for significant band breaches (1σ, 2σ, 3σ)
🟡 Toggle individual band visibility (1st, 2nd, 3rd) for cleaner UI
⚡ Optional trend signal arrows
🧪 Interpretation Example
If the current price trades 2+ standard deviations above the liquidity-based fair value line, it likely indicates:
A short-term overbought market
Potential for mean reversion
Or signal that a strong trend breakout is underway (confirm with slope direction)
✅ Why It’s Unique
This is not just a Bollinger Bands variant — it is a liquidity-aware fair value model with enhanced statistical depth. The baseline adapts to both price and volume, unlike simple moving averages that assume equal importance across all candles.
It combines three important market principles:
🎯 Price Action
🏦 Liquidity Weighting
📊 Volatility Analysis
All in one clean and visually intuitive script.
📢 Disclaimer
This indicator is for educational purposes only and is not financial advice. Always use additional confluence and proper risk management in your trading.

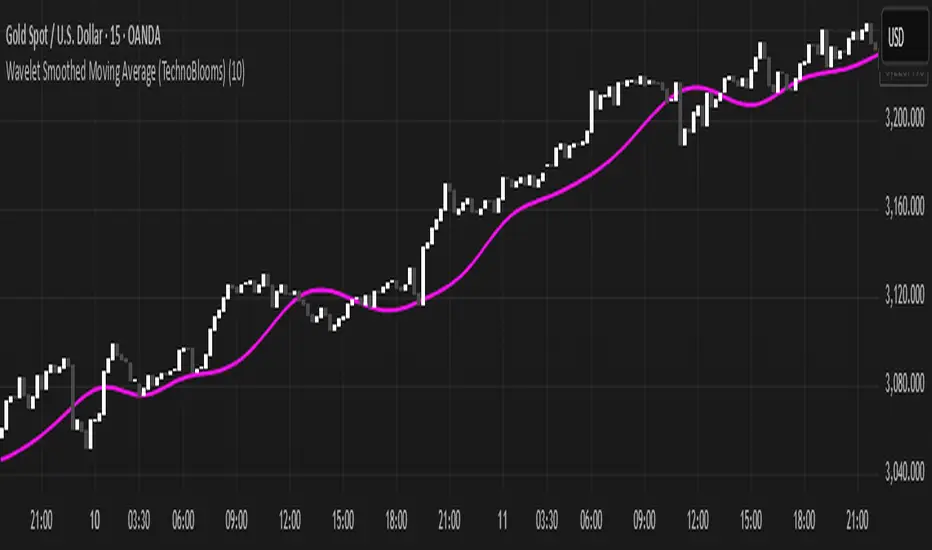
Wavelet Smoothed Moving Average (TechnoBlooms)Wavelet Smoothed Moving Average (WSMA) is a part of the Quantum Price Theory (QPT) Series of indicators.
Overview:
The Wavelet Smoothed Moving Average (WSMA) is a trend-following indicator inspired by multi-level Haar Wavelet decomposition. Rather than using traditional wavelet basis functions, it emulates the core wavelet concept of multi-resolution analysis using nested simple moving averages (SMA).
How It Works:
WSMA applies three levels of smoothing:
• Level 1: SMA on price (base smoothing)
• Level 2: SMA on Level 1 output (further denoising)
• Level 3: SMA on Level 2 output (final approximation)
Why Use WSMA:
• Multi-Level Smoothing: Captures price structure across multiple time scales, unlike single-length MAs.
• Noise Reduction: Filters out short-term volatility and focuses on the underlying trend.
• Low Lag, High Clarity: Unlike traditional moving averages that react slowly or miss subtle shifts, WSMA’s layered smoothing delivers cleaner and more adaptive trend detection.
Unique Value:
• Wavelet-Inspired Design: Mimics core wavelet decomposition logic without the complexity of downsampling or basis functions.
• Perfect for Trend Confirmation: The final line (a3) can act as a trend filter, while the detail levels can help identify momentum shifts and volatility bursts.
• Fits Into Quantum Price Theory: As part of the QPT framework, WSMA bridges scientific theory with trading application, giving traders a deeper understanding of market structure and signal compression.
Fractal Wave MarkerFractal Wave Marker is an indicator that processes relative extremes of fluctuating prices within 2 periodical aspects. The special labeling system detects and visually marks multi-scale turning points, letting you visualize fractal echoes within unfolding cycles dynamically.
What This Indicator Does
Identifies major and minor swing highs/lows based on adjustable period.
Uses Phi in power exponent to compute a higher-degree swing filter.
Labels of higher degree appear only after confirmed base swings — no phantom levels, no hindsight bias. What you see is what the market has validated.
Swing points unfold in a structured, alternating rhythm . No two consecutive pivots share the same hierarchical degree!
Inspired by the Fractal Market Hypothesis, this script visualizes the principle that market behavior repeats across time scales, revealing structured narrative of "random walk". This inherent sequencing ensures fractal consistency across timeframes. "Fractal echoes" demonstrate how smaller price swings can proportionally mirror larger ones in both structure and timing, allowing traders to anticipate movements by recursive patterns. Cycle Transitions highlight critical inflection points where minor pivots flip polarity such as a series of lower highs progress into higher highs—signaling the birth of a new macro trend. A dense dense clusters of swing points can indicate Liquidity Zones, acting as footprints of institutional accumulation or distribution where price action validates supply and demand imbalances.
Visualization of nested cycles within macro trend anchors - a main feature specifically designed for the chartists who prioritize working with complex wave oscillations their analysis.

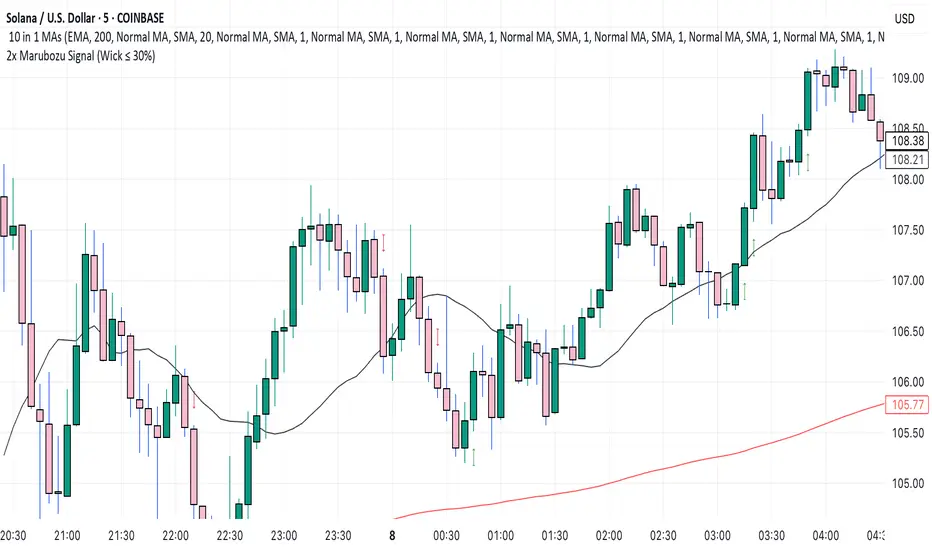
2x Marubozu Signal (Wick ≤ 30%)The 2x Marubozu Signal (Wick ≤ 30%) is a powerful, momentum-based price action indicator designed to catch strong bullish or bearish trends early. It scans for two consecutive Marubozu-style candles (where wicks are ≤ 30% of the total candle size) to identify moments of solid conviction from buyers or sellers.
This indicator detects:
Bullish Signal: Two green candles in a row, both with tiny wicks (≤ 30% of total candle size), indicating strong buying pressure and momentum.
Bearish Signal: Two red candles in a row, both with tiny wicks (≤ 30%), signaling dominant selling pressure.
The signal appears on the second candle — confirming the continuation move after initial momentum.
Key Features:
🔍 Wick Ratio Filter: Only triggers if both candles have upper and lower wicks less than or equal to 30% of the full candle range (High - Low).
📈 Visual Signal Arrows:
Green Up Arrow on bullish 2x Marubozu
Red Down Arrow on bearish 2x Marubozu
⚙️ Clean and Lightweight: No lag, perfect for intraday, swing, or trend-based strategies.
🎯 Use Case:
Trend Confirmation: Enter after the second strong Marubozu to ride breakout moves.
Momentum Filter: Combine with your existing strategy to filter only high-conviction price action setups.
Reversal Spotting: Catch reversals at key support/resistance when Marubozus form.
🧠 Pro Tips:
Works best on 15m–1D charts, especially after consolidation.
Combine with support/resistance, volume, or EMA/SMA zones for confirmation.
Avoid overtrading in choppy zones—this is a momentum-only tool.
🚀 Who’s It For?
Price Action Traders
Scalpers & Swing Traders
Trend-followers
Crypto, Forex, Stocks
📌 Author Note:
This indicator was crafted for traders who trust pure candle structure over lagging indicators. If you respect momentum, this is your edge.
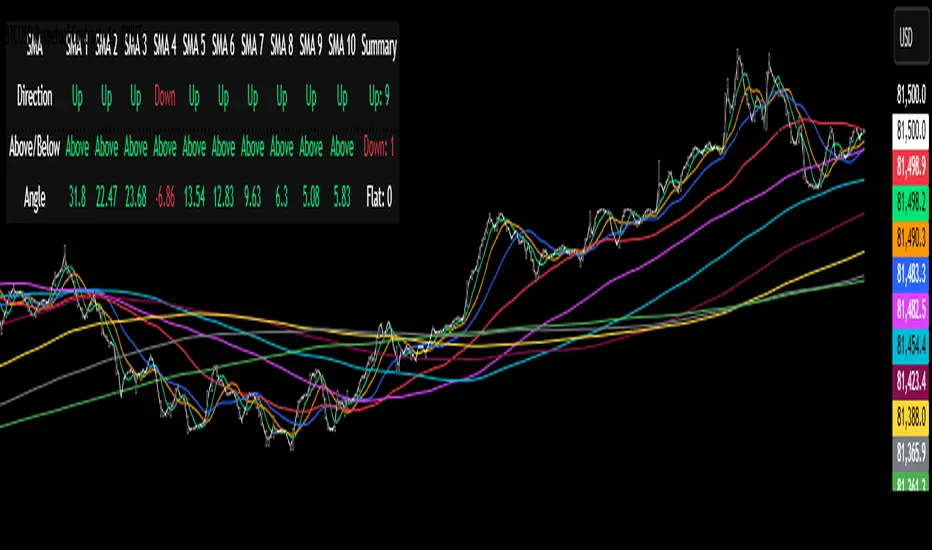
Multi-SMA Dashboard (10 SMAs)Description:
This script, "Multi-SMA Dashboard (10 SMAs)," creates a dashboard on a TradingView chart to analyze ten Simple Moving Averages (SMAs) of varying lengths. It overlays the chart and displays a table with each SMA’s direction, price position relative to the SMA, and angle of movement, providing a comprehensive trend overview.
How It Works:
1. **Inputs**: Users define lengths for 10 SMAs (default: 5, 10, 20, 50, 100, 150, 200, 250, 300, 350), select a price source (default: close), and customize table appearance and options like angle units (degrees/radians) and debug plots.
2. **SMA Calculation**: Computes 10 SMAs using the `ta.sma()` function with user-specified lengths and price source.
3. **Direction Determination**: The `sma_direction()` function checks each SMA’s trend:
- "Up" if current SMA > previous SMA.
- "Down" if current SMA < previous SMA.
- "Flat" if equal (no strength distinction).
4. **Price Position**: Compares the price source to each SMA, labeling it "Above" or "Below."
5. **Angle Calculation**: Tracks the most recent direction change point for each SMA and calculates its angle (atan of price change over time) in degrees or radians, based on the `showInRadians` toggle.
6. **Table Display**: A 12-column table shows:
- Columns 1-10: SMA name, direction (Up/Down/Flat), Above/Below status, and angle.
- Column 11: Summary of Up, Down, and Flat counts.
- Colors reflect direction (lime for Up/Above, red for Down/Below, white for Flat).
7. **Debug Option**: Optionally plots all SMAs and price for visual verification when `debug_plots_toggle` is enabled.
Indicators Used:
- Simple Moving Averages (SMAs): 10 user-configurable SMAs ranging from short-term (e.g., 5) to long-term (e.g., 350) periods.
The script runs continuously, updating the table on each bar, and overlays the chart to assist traders in assessing multi-timeframe trend direction and momentum without cluttering the view unless debug mode is active.
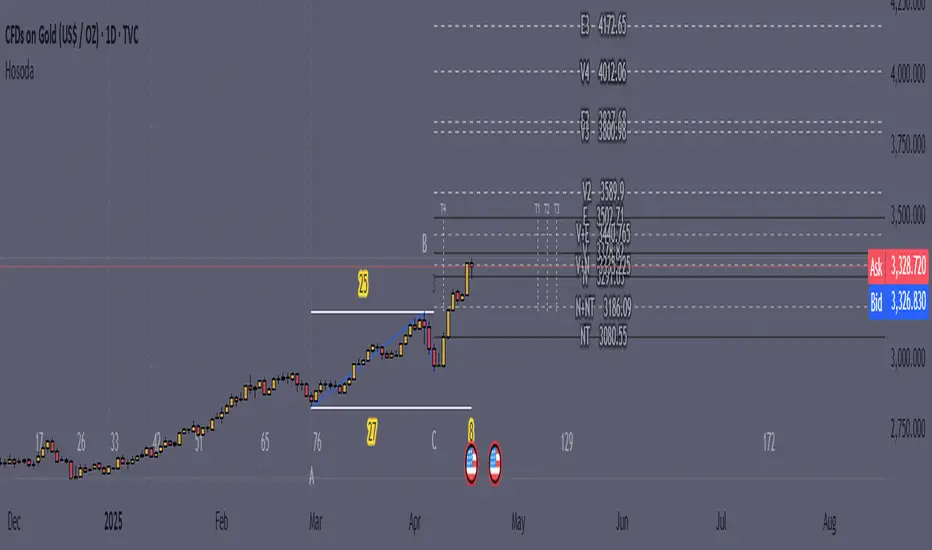
Goichi Hosoda TheoryGreetings to traders. I offer you an indicator for trading according to the Ichimoku Kinho Hyo trading system. This indicator determines possible time cycles of price reversal and expected asset price values based on the theory of waves and time cycles by Goichi Hosoda.
The indicator contains classic price levels N, V, E and NT, and is supplemented with intermediate levels V+E, V+N, N+NT and x2, x3, x4 for levels V and E, which are used in cases where the wave does not contain corrections and there is no possibility to update the impulse-corrective wave.
A function for counting bars from points A B and C has also been added.
Multi Oscillator OB/OS Signals v3 - Scope TestIndicator Description: Multi Oscillator OB/OS Signals
Purpose:
The "Multi Oscillator OB/OS Signals" indicator is a TradingView tool designed to help traders identify potential market extremes and momentum shifts by monitoring four popular oscillators simultaneously: RSI, Stochastic RSI, CCI, and MACD. Instead of displaying these oscillators in separate panes, this indicator plots distinct visual symbols directly onto the main price chart whenever specific predefined conditions (typically related to overbought/oversold levels or line crossovers) are met for each oscillator. This provides a consolidated view of potential signals from these different technical tools.
How It Works:
The indicator calculates the values for each of the four oscillators based on user-defined settings (like length periods and price sources) and then checks for specific signal conditions on every bar:
Relative Strength Index (RSI):
It monitors the standard RSI value.
When the RSI crosses above the user-defined Overbought (OB) level (e.g., 70), it plots an "Overbought" symbol (like a downward triangle) above that price bar.
When the RSI crosses below the user-defined Oversold (OS) level (e.g., 30), it plots an "Oversold" symbol (like an upward triangle) below that price bar.
Stochastic RSI:
This works similarly to RSI but is based on the Stochastic calculation applied to the RSI value itself (specifically, the %K line of the Stoch RSI).
When the Stoch RSI's %K line crosses above its Overbought level (e.g., 80), it plots its designated OB symbol (like a downward arrow) above the bar.
When the %K line crosses below its Oversold level (e.g., 20), it plots its OS symbol (like an upward arrow) below the bar.
Commodity Channel Index (CCI):
It tracks the CCI value.
When the CCI crosses above its Overbought level (e.g., +100), it plots its OB symbol (like a square) above the bar.
When the CCI crosses below its Oversold level (e.g., -100), it plots its OS symbol (like a square) below the bar.
Moving Average Convergence Divergence (MACD):
Unlike the others, MACD signals here are not based on fixed OB/OS levels.
It identifies when the main MACD line crosses above its Signal line. This is considered a bullish crossover and is indicated by a specific symbol (like an upward label) plotted below the price bar.
It also identifies when the MACD line crosses below its Signal line. This is a bearish crossover, indicated by a different symbol (like a downward label) plotted above the price bar.
Visualization:
All these signals appear as small, distinct shapes directly on the price chart at the bar where the condition occurred. The shapes, their colors, and their position (above or below the bar) are predefined for each signal type to allow for quick visual identification. Note: In the current version of the underlying code, the size of these shapes is fixed (e.g., tiny) and not user-adjustable via the settings.
Configuration:
Users can access the indicator's settings to customize:
The calculation parameters (Length periods, smoothing, price source) for each individual oscillator (RSI, Stoch RSI, CCI, MACD).
The specific Overbought and Oversold threshold levels for RSI, Stoch RSI, and CCI.
The colors associated with each type of signal (OB, OS, Bullish Cross, Bearish Cross).
(Limitation Note: While settings exist to toggle the visibility of signals for each oscillator individually, due to a technical workaround in the current code, these toggles may not actively prevent the shapes from plotting if the underlying condition is met.)
Alerts:
The indicator itself does not automatically generate pop-up alerts. However, it creates the necessary "Alert Conditions" within TradingView's alert system. This means users can manually set up alerts for any of the specific signals generated by the indicator (e.g., "RSI Overbought Enter," "MACD Bullish Crossover"). When creating an alert, the user selects this indicator, chooses the desired condition from the list provided by the script, and configures the alert actions.
Intended Use:
This indicator aims to provide traders with convenient visual cues for potential over-extension in price (via OB/OS signals) or shifts in momentum (via MACD crossovers) based on multiple standard oscillators. These signals are often used as potential indicators for:
Identifying areas where a trend might be exhausted and prone to a pullback or reversal.
Confirming signals generated by other analysis methods or trading strategies.
Noting shifts in short-term momentum.
Disclaimer: As with any technical indicator, the signals generated should not be taken as direct buy or sell recommendations. They are best used in conjunction with other forms of analysis (price action, trend analysis, volume, fundamental analysis, etc.) and within the framework of a well-defined trading plan that includes risk management. Market conditions can change, and indicator signals can sometimes be false or misleading.

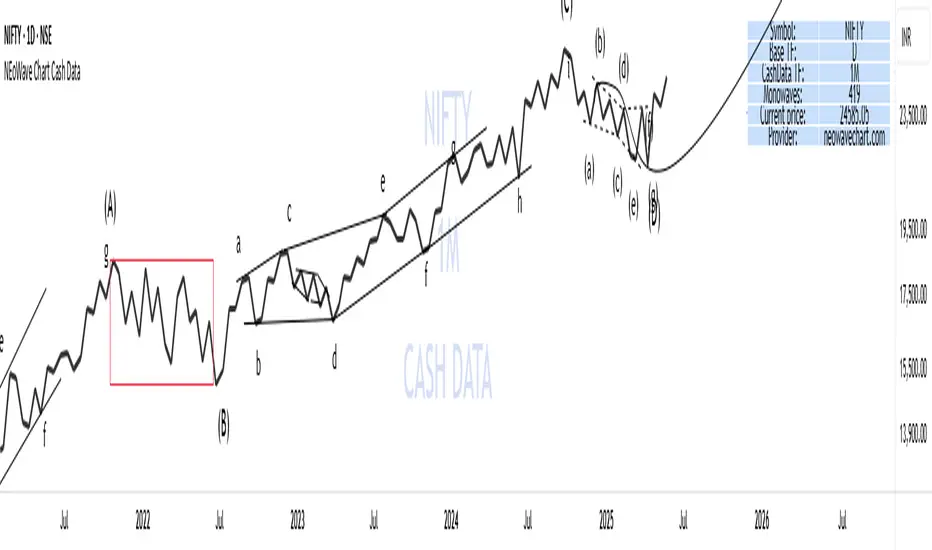
NEoWave Chart Cash Data The NEoWave Chart Cash Data indicator is an efficient tool for generating wave charts or cash data based on the NeoWave method, benefiting not only NeoWave analysts but also Elliott Wave practitioners. This indicator produces cash data with exceptional precision.
Developed by Glenn Neely, NeoWave is considered a more complete, scientific, and innovative iteration of the Elliott Wave theory. This method relies on a specialized chart known as a "wave chart" or "cash data," which, when drawn manually by recording the highest and lowest prices in their order of occurrence, is a complex and time-consuming process. However, this indicator automatically and in real-time identifies the highest and lowest prices for any symbol and time frame, plotting them in sequence. For instance, in a daily time frame, it separates each month's data and prepares a "monthly cash data chart" for analysis using the NeoWave method.
Fully compatible with all account types, this tool enables the creation of cash data across various time frames (from minutes to years) and customizable scales. Its standout features include real-time updates, watermarking capabilities, display of useful data in tables, detection of suspicious monowaves (where the highest and lowest prices occur within the same candlestick), simultaneous display of two cash data charts with different time frames, and the ability to view cash data for any desired time period.
CASH DATA TIMEFRAMES
The core feature of this indicator is CASH DATA TIMEFRAMES, which generates and displays Cash Data based on your base timeframe. Here’s how it works:
.1 Minute ("1"): Cash Data: 5, 10, 15, 30, 60, 120, 180 minutes
.3 Minutes ("3"): Cash Data: 30, 60, 120, 180, 240 minutes
.5 Minutes ("5"): Cash Data: 30, 60, 120, 180, 240 minutes, 1 day (1D)
.15 Minutes ("15"): Cash Data: 120, 180, 240 minutes, 1 day (1D), 2 days (2D), 3 days (3D)
.30 Minutes ("30"): Cash Data: 180, 240 minutes, 1 day (1D), 2 days (2D), 3 days (3D), 1 week (1W)
.1 Hour ("60"): Cash Data: 1 day (1D), 2 days (2D), 3 days (3D), 1 week (1W), 2 weeks (2W)
.2 Hours ("120"): Cash Data: 1 day (1D), 2 days (2D), 3 days (3D), 1 week (1W), 2 weeks (2W), 1 month (1M)
.3 Hours ("180"): Cash Data: 1 day (1D), 2 days (2D), 3 days (3D), 1 week (1W), 2 weeks (2W), 1 month (1M)
.4 Hours ("240"): Cash Data: 2 days (2D), 3 days (3D), 1 week (1W), 2 weeks (2W), 1 month (1M), 2 months (2M)
.Daily ("D"): Cash Data: 1 week (1W), 2 weeks (2W), 1 month (1M), 2 months (2M), 3 months (3M), 6 months (6M), 12 months (12M)
.Weekly ("W"): Cash Data: 2 months (2M), 3 months (3M), 6 months (6M)
.Monthly ("M"): Cash Data: 6 months (6M), 12 months (12M)
Suspicious monowaves
Suspicious monowaves, visible in the "Inputs" section under the label "Sus Monowaves," are highlighted in red upon detection. This occurs when the highest and lowest prices within a given time period appear in a single candlestick. As illustrated, suspicious monowaves are marked with red squares, and the candlestick indicated by a red arrow is the trigger for identifying these monowaves.
In such instances, our indicator automatically plots the monowaves with high precision. This feature is tailored for users seeking cash data of the utmost accuracy. Whenever these monowaves appear on the chart, it is recommended that users examine the suspicious monowaves in a lower time frame for further analysis.
Other Cash Data TF
One of the key features of this indicator is the "Other Cash Data TF" option, which, when enabled, allows you to create two cash data charts with different time frames within your base time frame. This feature becomes particularly useful when, for example, your base time frame is daily, and you’ve identified a pattern like a zigzag in the monthly cash data. To confirm this pattern, you need to examine the internal waves A and C to determine whether they are impulsive. By activating this option and setting "Other TF" to a weekly time frame, you can easily analyze the internal waves of your chosen wave without altering the base time frame.
When this option is activated, a column is added to the table, indicating that the "Base TF" is daily, "Cash Data TF" is monthly, and "Other Cash Data TF" is weekly (as shown in the image below).
Other features of the indicator include:
.A Table providing useful information such as the symbol, base time frame, cash data time frame (Cash Data TF), number of monowaves, and live price.
.Customizable options for the table (including color, size, and column removal), watermark, cash data lines, suspicious monowaves, and more.
.A Time Separator that divides the chart into equal periods.
.The ability to add a watermark.