1000SATSUSDT 1D#1000SATS has broken the descending triangle resistance with huge volume on the daily chart. It is currently trying to close the daily candle above the SMA200. Consider buying near the support zone, where the triangle may retest. The potential targets are:
🎯 $0.00006031
🎯 $0.00006850
🎯 $0.00007669

#1000SATS Falling Wedge📊#1000SATS Falling Wedge📈
🧠From a chart perspective, we've formed a falling wedge after a long period of consolidation at the bottom, a pattern we typically follow for upward movement. We've already broken through the upper edge of the wedge, and if we can hold above it, we might see a larger break

1000SATSUSDT Forming Bullish Momentum1000SATSUSDT has recently shown signs of strength after breaking out of a prolonged consolidation phase. The chart pattern highlights a strong reversal structure forming, supported by healthy volume that adds weight to the bullish outlook. With technical indicators pointing toward upward momentum, t

1000SATSUSDT.P MAKE A FALLING WEDGE🛫 COIN :1000SATSUSDT.P
🕯 CHART : 3D
📊 PATTREN : FALLING WEDGE
🔼 POSITION : BULLISH📈
💵1 Target - $ 0.0002500
💵2 Target - $ 0.0003635
💵3 Target - $ 0.0004650
💵4 Target - $ 0.0005950

My Current Outlook on 1000SATS Price fell out of the bullish structure after a huge dump coming off of another recent lower high. So far it looks like the price respected the retest area of the raising broadening wedge, but, this asset is known to fake out traders in both directions, although, early shorts at the previous high st

SATS Buy/Long Setup (1H)Given the bullish structure, the formation of bullish BOS (Break of Structure), the preservation of the trendline, and the absence of any significant supply zone in front of the candles, we can consider entering this setup with proper risk and capital management.
The targets are marked on the chart

1000SAT Trade Setup – Neckline Retest📊 1000SAT Trade Setup – Neckline Retest 📈
🔹 Current Action: Pulling back to Green Neckline (Inverted H&S) 🟢
✅ Confirmation: Break & Close Above Red Resistance Zone 🔴
🎯 Target: Green Line Level 🚀
⚠️ Invalidation: Breakdown Below Green Neckline 👇

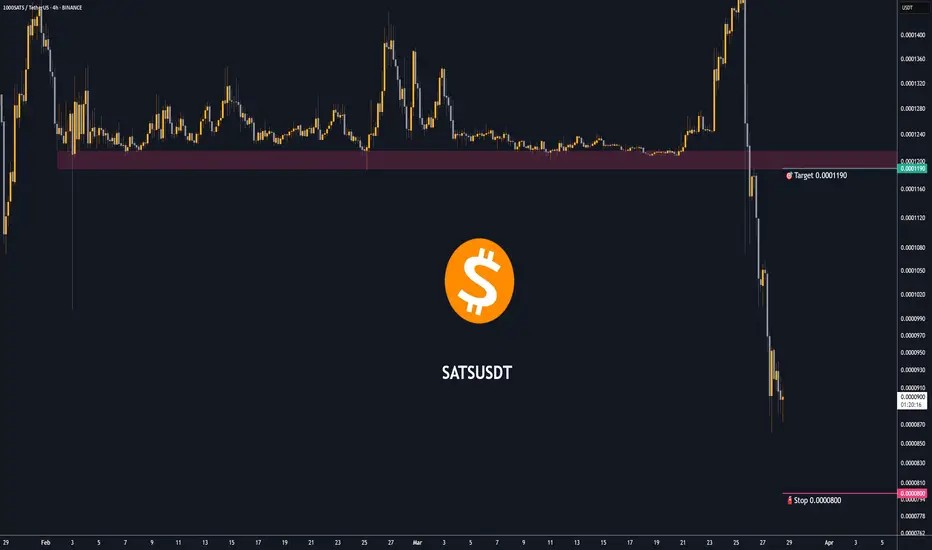
Trading opportunity for 1000SATSUSDTBased on technical factors there is a Buy position in :
📊 1000SATSUSDT
🔵 Buy Now
🪫Stop loss 0.0000800
🔋Target 0.0001190
📏 R/R 3
💸RISK : 1%
We hope it is profitable for you ❤️
Please support our activity with your likes👍 and comments📝
Trading opportunity for 1000SATSUSDT SATS (Ordinals)Based on technical factors there is a Buy position in :
📊 1000SATSUSDT
🔵 Buy Now
🪫Stop loss 0.0000950
🔋Target 0.0001850
📏 R/R 2,2
💸RISK : 1%
We hope it is profitable for you ❤️
Please support our activity with your likes👍 and comments📝

1000SATS/USDT (Binance - 1D Chart)📍 Timeframe: 1D (Binance Exchange)
📈 Current Price: 0.0001268 (+1.93%)
Key Technical Insights:
Accumulation & Breakout Setup:
Price has been consolidating at a low volatility range for several weeks.
Potential breakout setup is forming, as indicated by the bullish structure.
Support & Resistance L

See all ideas
Summarizing what the indicators are suggesting.
Oscillators
Neutral
SellBuy
Strong sellStrong buy
Strong sellSellNeutralBuyStrong buy
Oscillators
Neutral
SellBuy
Strong sellStrong buy
Strong sellSellNeutralBuyStrong buy
Summary
Neutral
SellBuy
Strong sellStrong buy
Strong sellSellNeutralBuyStrong buy
Summary
Neutral
SellBuy
Strong sellStrong buy
Strong sellSellNeutralBuyStrong buy
Summary
Neutral
SellBuy
Strong sellStrong buy
Strong sellSellNeutralBuyStrong buy
Moving Averages
Neutral
SellBuy
Strong sellStrong buy
Strong sellSellNeutralBuyStrong buy
Moving Averages
Neutral
SellBuy
Strong sellStrong buy
Strong sellSellNeutralBuyStrong buy
Displays a symbol's price movements over previous years to identify recurring trends.