Aarti Industries basing and looking for a pre-earnings runupShowing good accumulation with key averages being crossed.
Next report date
—
Report period
—
EPS estimate
—
Revenue estimate
—
8.05 INR
3.31 B INR
72.16 B INR
205.08 M
About AARTI Industries Ltd
Sector
Industry
CEO
Suyog Kalyanji Kotecha
Website
Headquarters
Mumbai
Founded
1984
ISIN
INE769A01020
FIGI
BBG000CMRR35
AARTI Industries Ltd. is a holding company, which engages in the development and manufacture of specialty chemicals, pharmaceuticals, and home and personal care intermediates. It operates through the following segments: Specialty Chemicals and Pharmaceuticals. The Specialty Chemicals segment offers benzene, sulphur, and toluene product chains. The Pharmaceuticals segment focuses on active pharmaceutical ingredients, custom synthesis, and contract research. The company was founded by Chandrakant Vallabhaji Gogri and Shantilal Tejshi Shah on September 28, 1984 and is headquartered in Mumbai, India.
Related stocks

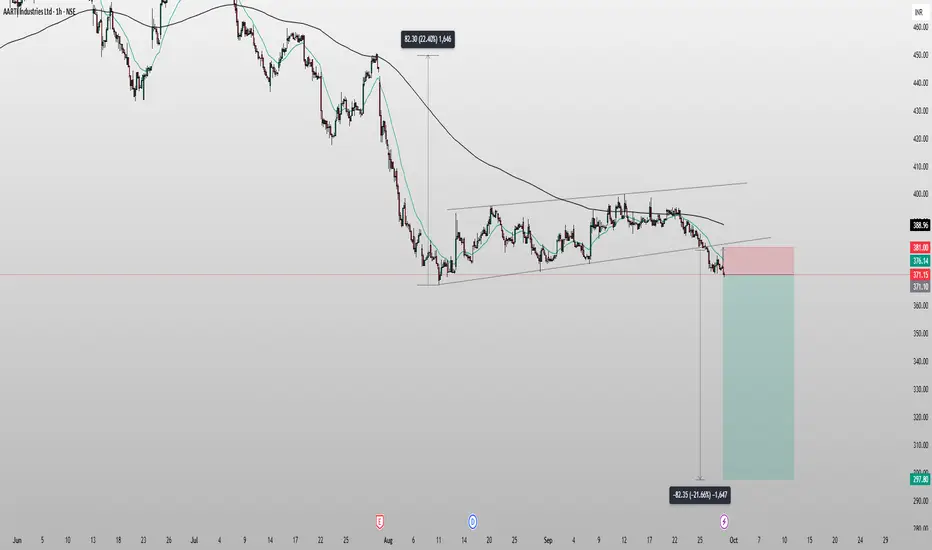
INVERTED FLAG AND POLE - AARTI INDUSTRIESAfter a prolonged consolidation, the price has broken below the support trendline, confirming a bearish breakdown. The structure is showing weakness with lower highs and consistent selling pressure.
Entry: Around 376
Stop Loss (SL): 381
Target: 297
Risk-Reward Ratio (RR): ~3.5
The breakdown is bac
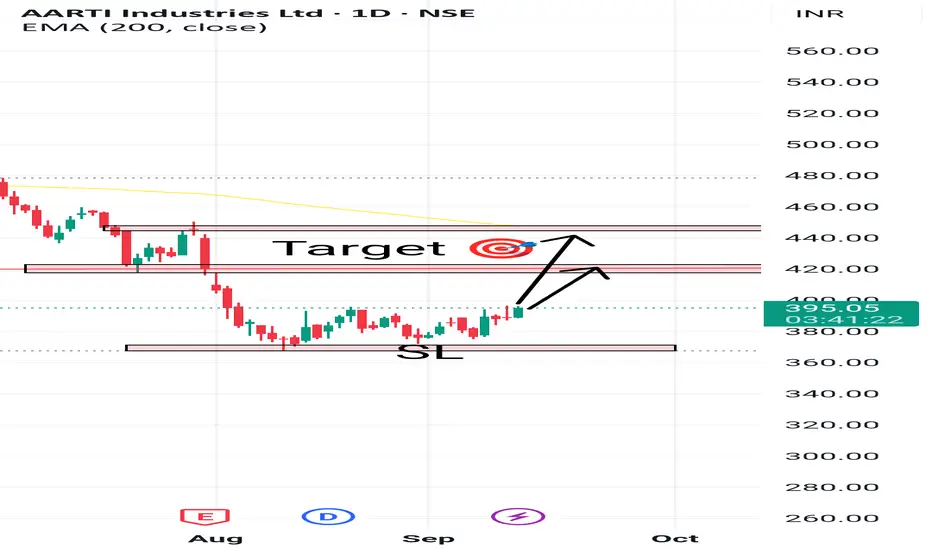
Buy AARTI INDUSTRIES 14/9/25
Buy Price : 387.10
SL : 367.50
Target 1 : 406.70
Target 2 : 426.35
Target 3 : 446

Aarti Industries at Solid Base – Potential Upside Loading!!Aarti Industries – Weekly Chart Update
Chart Pattern: Stock is trading within a shorter-timeframe parallel channel.
Support Zone: Strong support observed near ₹370 – ₹380 levels.
RSI Indicator: RSI is also taking support and moving upward, indicating positive momentum.
Trend Outlook: If this sup
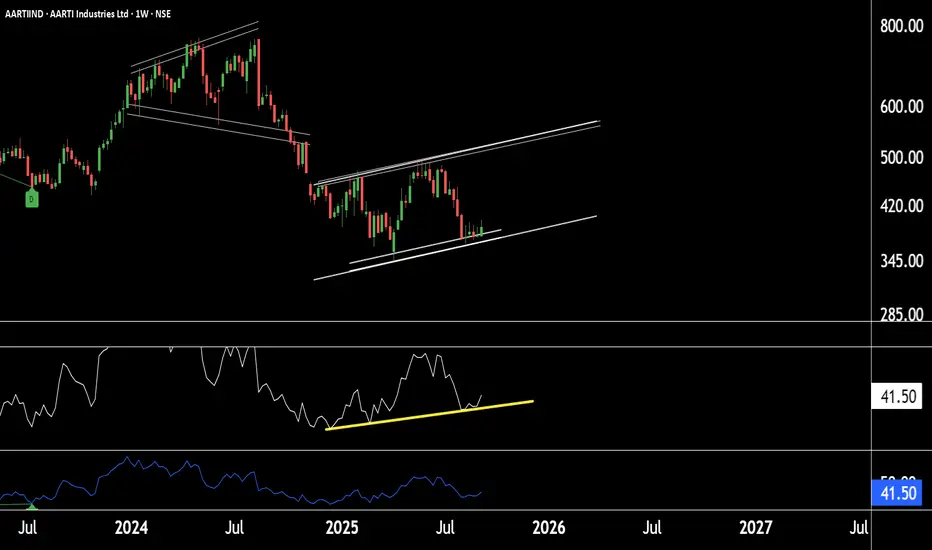
AARTI INDUSTRIES Price at lower end and support also there. So possible that it will move upper side
SL and target 🎯 marked on chart 📈📉
This idea is for Educational purpose and paper trading only. Please consult your financial advisor before investing or making any position. Facts or Data given above may be sl
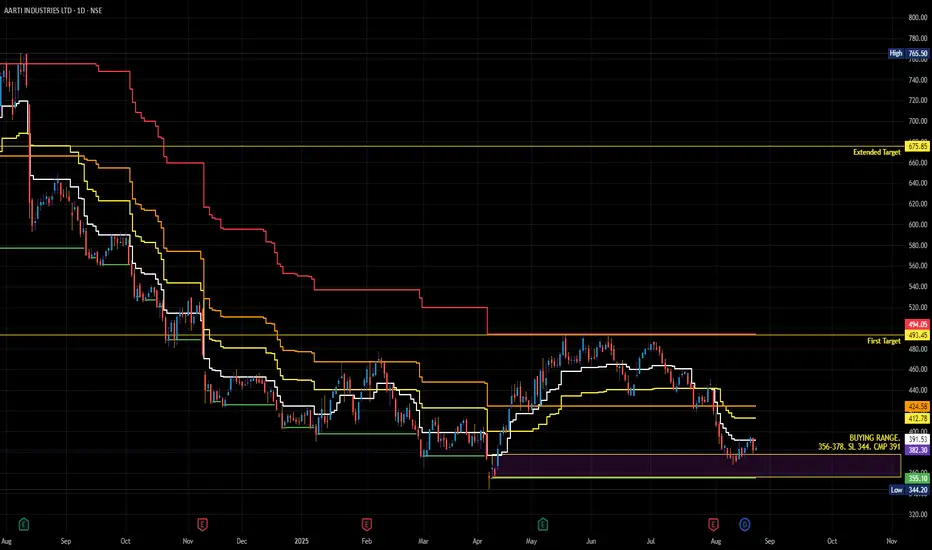
AARTIIND | Buy above 395 | Strict SL below 370 |Targets 480, 590Disclaimer:
This is not financial advice. Please do your own research or consult with a financial advisor before making any investment decisions. Investments in stocks can be risky and may result in loss of capital.

AARTIIND- Very High RiskPlease follow levels provided on chart.
Please calculate possible losses before entering any suggestion.
AARTIIND | Buy above 460 | Strict SL below 415 | Target 640, 760Disclaimer:
This is not financial advice. Please do your own research or consult with a financial advisor before making any investment decisions. Investments in stocks can be risky and may result in loss of capital.

Aarti Industries: Attempting a Reversal🔄 Aarti Industries: Attempting a Reversal 🔄
📉 CMP: ₹470
🔒 Stop Loss: ₹428
🎯 Targets: ₹554 | ₹604
📊 Technical Setup:
✅ Rounding Bottom Breakout confirmed
✅ Retest completed, providing a low-risk entry zone
✅ Strong base formed after prolonged downtrend
This setup offers a good swing trading oppo

What a beautiful Wave!AARTIIND is showing a potential short-term bullish reversal after a prolonged decline, supported by RSI momentum, moving average crossover, and rising volume. A breakout above ₹486 could give a further rally toward ₹490+ Bullish Bias (If price sustains above ₹454):
Target: ₹486 → ₹492
The push will

See all ideas
Summarizing what the indicators are suggesting.
Neutral
SellBuy
Strong sellStrong buy
Strong sellSellNeutralBuyStrong buy
Neutral
SellBuy
Strong sellStrong buy
Strong sellSellNeutralBuyStrong buy
Neutral
SellBuy
Strong sellStrong buy
Strong sellSellNeutralBuyStrong buy
An aggregate view of professional's ratings.
Neutral
SellBuy
Strong sellStrong buy
Strong sellSellNeutralBuyStrong buy
Neutral
SellBuy
Strong sellStrong buy
Strong sellSellNeutralBuyStrong buy
Neutral
SellBuy
Strong sellStrong buy
Strong sellSellNeutralBuyStrong buy
Displays a symbol's price movements over previous years to identify recurring trends.
Frequently Asked Questions
The current price of AARTIIND is 382.30 INR — it has increased by 0.39% in the past 24 hours. Watch AARTI Industries Ltd stock price performance more closely on the chart.
Depending on the exchange, the stock ticker may vary. For instance, on NSE exchange AARTI Industries Ltd stocks are traded under the ticker AARTIIND.
AARTIIND stock has fallen by −0.96% compared to the previous week, the month change is a 1.15% rise, over the last year AARTI Industries Ltd has showed a −15.70% decrease.
We've gathered analysts' opinions on AARTI Industries Ltd future price: according to them, AARTIIND price has a max estimate of 550.00 INR and a min estimate of 330.00 INR. Watch AARTIIND chart and read a more detailed AARTI Industries Ltd stock forecast: see what analysts think of AARTI Industries Ltd and suggest that you do with its stocks.
AARTIIND reached its all-time high on Oct 19, 2021 with the price of 1,012.40 INR, and its all-time low was 0.75 INR and was reached on Mar 5, 1999. View more price dynamics on AARTIIND chart.
See other stocks reaching their highest and lowest prices.
See other stocks reaching their highest and lowest prices.
AARTIIND stock is 1.22% volatile and has beta coefficient of 1.46. Track AARTI Industries Ltd stock price on the chart and check out the list of the most volatile stocks — is AARTI Industries Ltd there?
Today AARTI Industries Ltd has the market capitalization of 138.60 B, it has decreased by −1.05% over the last week.
Yes, you can track AARTI Industries Ltd financials in yearly and quarterly reports right on TradingView.
AARTI Industries Ltd is going to release the next earnings report on Feb 2, 2026. Keep track of upcoming events with our Earnings Calendar.
AARTIIND earnings for the last quarter are 2.85 INR per share, whereas the estimation was 2.27 INR resulting in a 25.66% surprise. The estimated earnings for the next quarter are 2.83 INR per share. See more details about AARTI Industries Ltd earnings.
AARTIIND net income for the last quarter is 1.06 B INR, while the quarter before that showed 430.00 M INR of net income which accounts for 146.51% change. Track more AARTI Industries Ltd financial stats to get the full picture.
Yes, AARTIIND dividends are paid annually. The last dividend per share was 1.00 INR. As of today, Dividend Yield (TTM)% is 0.26%. Tracking AARTI Industries Ltd dividends might help you take more informed decisions.
AARTI Industries Ltd dividend yield was 0.26% in 2024, and payout ratio reached 10.96%. The year before the numbers were 0.15% and 8.70% correspondingly. See high-dividend stocks and find more opportunities for your portfolio.
As of Nov 29, 2025, the company has 13.91 K employees. See our rating of the largest employees — is AARTI Industries Ltd on this list?
EBITDA measures a company's operating performance, its growth signifies an improvement in the efficiency of a company. AARTI Industries Ltd EBITDA is 10.02 B INR, and current EBITDA margin is 13.41%. See more stats in AARTI Industries Ltd financial statements.
Like other stocks, AARTIIND shares are traded on stock exchanges, e.g. Nasdaq, Nyse, Euronext, and the easiest way to buy them is through an online stock broker. To do this, you need to open an account and follow a broker's procedures, then start trading. You can trade AARTI Industries Ltd stock right from TradingView charts — choose your broker and connect to your account.
Investing in stocks requires a comprehensive research: you should carefully study all the available data, e.g. company's financials, related news, and its technical analysis. So AARTI Industries Ltd technincal analysis shows the sell today, and its 1 week rating is sell. Since market conditions are prone to changes, it's worth looking a bit further into the future — according to the 1 month rating AARTI Industries Ltd stock shows the sell signal. See more of AARTI Industries Ltd technicals for a more comprehensive analysis.
If you're still not sure, try looking for inspiration in our curated watchlists.
If you're still not sure, try looking for inspiration in our curated watchlists.